

Abstract
Dramatic changes in the structure of cell membranes on apoptosis allow easy, sensitive and non-destructive analysis of this process with the application of fluorescence methods. The strong plasma membrane asymmetry is present in living cells, and its loss on apoptosis is commonly detected with the probes interacting strongly and specifically with phosphatidylserine (PS). This phospholipid becomes exposed to the cell surface, and the application of annexin V labeled with fluorescent dye is presently the most popular tool for its detection. Several methods have been suggested recently that offer important advantages over annexin V assay with the ability to study apoptosis by spectroscopy of cell suspensions, flow cytometry and confocal or two-photon microscopy. The PS exposure marks the integrated changes in the outer leaflet of cell membrane that involve electrostatic potential and hydration, and the attempts are being made to provide direct probing of these changes. This review describes the basic mechanisms underlying the loss of membrane asymmetry during apoptosis and discusses, in comparison with the annexin V-binding assay, the novel fluorescence techniques of detecting apoptosis on cellular membrane level. In more detail we describe the detection method based on smart fluorescent dye F2N12S incorporated into outer leaflet of cell membrane and reporting on apoptotic cell transformation by easily detectable change of the spectral distribution of fluorescent emission. It can be adapted to any assay format.
Keywords: Phosphatidylserine, Apoptosis, Membrane asymmetry, Flow cytometry, Fluorescence microscopy, Cell membrane probes, 3-Hydroxyflavones, F2N12S
Introduction
Apoptosis is a programmed mode of cell death that is involved in a wide variety of physiological and pathological processes (Krampe and Al-Rubeai 2010; Pereira and Amarante-Mendes 2011; Ulukaya et al. 2011). Detection of apoptosis is of great importance for many areas of biological research, for understanding the pathological conditions and for the development of new drugs. In cancer, the balance between cell proliferation and apoptosis shifts toward the cell proliferation, and this stimulates an active search for the most efficient and safe anticancer therapeutic regimens that induce apoptosis (Coppola et al. 2008). The ability to monitor apoptosis using noninvasive sensing and imaging techniques would markedly enhance early assessment and continuous evaluation of the efficacy of anticancer drugs (Kim et al. 2002).
Apoptosis is a very complex cellular phenomenon that can be triggered by both extrinsic and intrinsic factors (Martinez et al. 2010a). Extrinsic activation of apoptosis depends on activation of death receptors (i.e., TNFR family) located on the surface of cell membrane, whereas an intrinsic activation results from disruption of intracellular homeostasis (DNA damage, cellular stress). On the intrinsic pathway, mitochondria play an essential role, and lipid peroxidation can be directly responsible for the generation of the apoptotic phenotype (Kagan et al. 2000). This pathway can be stimulated by chemotherapeutics, mitochondrial damage or ionizing radiation. Among the factors that lead to the activation of intrinsic apoptotic pathways are the drugs that are used to treat a variety of types of cancer including taxanes and anthracylines, such as paclitaxel and doxorubicin, respectively. Release of several mitochondrial factors, activation of cascade of cytoplasmic caspase enzymes and changes in cell membranes are followed by the loss of mitochondrial membrane potential, condensation of chromatin and then fragmentation of DNA. All these processes occur with the maintenance of cell integrity, and only the cell shrinkage can be clearly seen in its course. Even on the latest step, when the cell is disintegrated, its cytoplasm is not released but is maintained in apoptotic bodies.
In view of these numerous and versatile changes, many different techniques can be used to study apoptotic events. Meantime, in reality most of these methods are difficult in realization or are disruptive to the cellular environment. In most cases, their performance is toxic to the cells or require fixation. On a large scale, three major methodologies are currently used in cellular research (Krysko et al. 2008; Martinez et al. 2010a; Tait 2008):
Intracellular caspase activation imaged by using molecular beacons comprised of dye-labeled caspase substrates (Edgington et al. 2009; Lee et al. 2008; Martinez et al. 2010b; Riedl and Shi 2004) or the application of fluorescent caspase inhibitors (Lee et al. 2008).
Mitochondrial membrane potential collapse monitored by reduced levels of phosphonium cations that normally accumulate in healthy mitochondria (Green and Kroemer 2004).
Exposure of phosphatidylserine (PS) on the extracellular face of the plasma membrane (Balasubramanian and Schroit 2003; Boersma et al. 2005). Such exposure can be detected by dye-labeled PS-binding proteins, such as annexin V in a non-perturbing manner.
This latter methodology is presently the most attractive, since PS provides extracellular binding targets that can be detected without the need to penetrate the cell. Also, it is the most popular because it is not toxic or destructive in cellular research and since it allows extension to the tissue and whole-body level. It allows capturing profound changes occurring in the structure of cell membrane. Due to these changes, the apoptotic cell produces a specific ‘eat-me’ signal for its recognition and its subsequent detaining and degradation by macrophages. The exposed PS on cell surface serves as a tag for such specific cell recognition (Ravichandran 2010).
These biomembrane changes on apoptosis will be in focus of the present review. We will describe them and discuss their mechanisms. Then we will overview in short the fluorescence techniques used for the analysis and imaging of apoptosis and critically analyze the most popular annexin V assay and its analogs. Alternative techniques based on detection of the changes in cell surface will be discussed. Finally, we will present the new method based on application of smart fluorescent dye F2N12S and discuss its applicability.
Aminophospholipid asymmetry of plasma membrane and its apoptotic changes
Plasma membrane of a living cell is a highly organized three-dimensional system composed of lipids, proteins and glycans, so that the two leaflets forming it are of quite different composition. The major part of electrically neutral phosphatidylcholine (PC) and sphingomyelin (SM) is located in its outer leaflet, whereas most of phosphatidylethanolamine (PE) and practically all anionic lipids phosphatidylserine (PS) and phosphatidic acid (PA) face the cytosolic milieu (Kiessling et al. 2009; Yamaji-Hasegawa and Tsujimoto 2006).
Such asymmetry creates a strong distribution of electrostatic charge between two membrane surfaces that is maintained due to the action of specific lipid-translocating proteins (Fig. 1). Its maintaining is of great biological importance allowing correct assembly of membrane proteins and interaction with intracellular structures (van Meer 2005; Zwaal et al. 2005). The membrane ATPases called flippases and floppases facilitate translocation of lipid molecules from one leaflet to the other against their concentration gradient. Such translocase activity is ubiquitously present and contributes significantly to the asymmetry of phospholipid location. The lipid exchange can be provided by scramblases being coupled to translocation of Ca2+ ions. Scramblases translocate the phospholipids bidirectionally over the two leaflets thereby collapsing PS asymmetry, which makes randomization of the phospholipids over the two membrane leaflets much faster than their spontaneous flip–flop.
Fig. 1.

Transporter-controlled exchange of phospholipids between intracellular and extracellular leaflets of the cell membrane creating strong charge asymmetry (Zwaal et al. 2005), modified
The loss of phospholipid asymmetry is a universal process occurring during early apoptosis, independent of the species, of the cell type or of the apoptosis inducer (Balasubramanian and Schroit 2003). It occurs without compromising the barrier function of the cell membrane allowing already on a short time scale after the apoptotic stimulus to change the cell-to-cell recognition. Together with externalization of several protein factors the exposed PS molecules generate an ‘eat-me’ signal that allows the clearance of apoptotic cells by phagocytes (Erwig and Henson 2008; Ravichandran and Lorenz 2007).
The PS exposure is a rather early phenomenon in the apoptotic process. The data obtained by both flow cytometry and immunofluorescence with PS-specific antibodies demonstrate that the PS translocation can be observed as early as 5–10 min after the treatment of cells (Mourdjeva et al. 2005), at the time when the barrier functions of the membrane are still not lost and the characteristic morphological changes undetected. Nuclear condensation, the degradation of cytoskeletal elements and the DNA strand breaks appear in later stage of apoptosis (Rucker-Martin et al. 1999). The membrane changes correlate with the failure of mitochondrial transmembrane potential and activation of caspases, but the mechanism of coupling of these events is not clear. There is no direct evidence of relation with biomembrane changes of cytochrome c release from mitochondria, caspase activation or DNA fragmentation. Moreover, the degradation of erythrocytes involves a characteristic pathway called eryptosis, which is a version of apoptosis. These cells lack both nucleus and mitochondria, but PS externalization is also characteristic for them (Foller et al. 2008).
The appearance of anionic PS on the cell surface is the most remarkable feature in apoptosis because of the abundance of this phospholipid in membranes, its negative charge and the ability to change interactions with other lipids (Balasubramanian and Schroit 2003) leading to disruption of lipid rafts (Oncul et al. 2010). Different methods discussed herein have been developed for its detection.
It should be noted, however, that the specificity of PS externalization is not absolute for apoptosis and may indicate different pathological conditions (Korngold et al. 2008; Schutters and Reutelingsperger 2010; Zwaal et al. 2005). Thus, it was reported about the occurrence of PS expression on surface of endothelial cells of tumor vasculature and stressed tumor cells (Ran et al. 2002; Ran and Thorpe 2002). Exposed PS is observed on platelet activation, being a part of blood clotting process. Anionic lipids expressed on activated platelets are important for the coordinated assembly of coagulation factors (Kerbiriou-Nabias and Geldwerth-Feniger 2007). Activated macrophages that are engaged to engulf dying cells also expose PS on their surface, and inhibition of their PS exposure greatly impairs phagocytic capacity (Ravichandran and Lorenz 2007). Thus the methods detecting PS externalization lack absolute specificity for apoptosis and they can be used also in the studies of these processes (Elliott et al. 2005).
All the techniques addressing the changes in plasma membrane should allow distinguishing early apoptotic cells, in which these membranes remain intact and continue performing barrier function, from already dead cells, in which these membranes are disintegrated. Therefore the cell membrane tests must be complemented by the test for integrity of cell membrane. This is commonly done with the aid of cell-impermeable dye that produces strong fluorescence enhancement on interaction with nuclear DNA when it penetrates into the cell. Propidium iodide (PI) is usually used for this purpose. Its red emission is easily distinguished from green emission of commonly used FITC-labeled annexin V. It can be used with other fluorescent techniques detecting biomembrane changes. If the PI fluorescence enhancement is observed, the cell is considered dead.
Fluorescence techniques in the detection of apoptosis
With proper application of molecular probes and labels fluorescence techniques allow reporting by a signal of analytical value in a variety of formats, such as cuvette-based spectrofluorimetry, flow cytometry, different versions of microscopy, microarrays, etc. (Demchenko 2009). With conventional spectrofluorimetry one can study an integrated response of a cell population with the advantage of high spectral resolution. Different experimental conditions can be applied here, and it is easy to follow the development of the process as a function of time. Simultaneous study with several probes can be made if their response is spectrally resolved and even minor changes in response signal can be detected.
Presently the most frequently measured parameter is the fluorescence intensity at single wavelength. Meantime, such very simple measurements being displayed in relative units do not allow calibration at molecular level (self-calibration). This means that the output signal will depend on the concentration of applied fluorescent label. Moreover, it may not discriminate between bound and unbound label, so an additional procedure, such as the washing-out of the unbound label may be needed. The output will be sensitive to any undesirable factor influencing the fluorescence intensity. Therefore in analytical applications of fluorescence there is a clearly observed tendency of shifting towards more sophisticated methods that allow self-calibration (Demchenko 2005b).
The parameters that allow molecular-scale calibration are the anisotropy, lifetime of fluorescence emission and also the spectroscopic changes, such as the spectral shifts and the appearance of new bands (Demchenko 2009). For the former two methods an advanced instrumentation and specially designed probes are needed. Based on detection of anisotropy the changes in the freedom of rotation of fluorescent probes can be detected. The lifetime measurements need special probe development (Gasser et al. 2009) and their results are sensitive to temperature and collisional quenchers in the medium. If the response is provided by a strong shift of fluorescence band or by the appearance of a new band, then the measured fluorescence intensities at two selected wavelength presented as their ratio allow obtaining the output signal, in which variations of dye concentrations will be compensated. This signal will be insensitive to variations of instrumental factors, such as the intensity of light source or sensitivity of detector (Demchenko 2005c). Such wavelength-ratiometric detection (Demchenko 2010) uses simple instrumentation and can be applied on a micro-scale with the aid of plate readers or even further miniaturized to microarray format (Demchenko 2005a). The problem is the design of proper fluorescence reporters (Demchenko 2010), which is critical for the whole field of fluorescence detection, including the detection of apoptosis.
These considerations can be transferred to flow cytometry, which is the most popular method of studying apoptosis (Telford et al. 2011). With this method one can operate with the population of cells in a way that allows acquiring statistical information (Steensma et al. 2003). Most flow cytometers can measure 1,000–10,000 cells in few seconds. But in contrast to spectroscopic methods, here one can operate only with a small number of output parameters, such as light scattering and fluorescence intensities displayed in several wavelength channels. The high cell counts and multiparametric detection combined with the possibility of sorting cells in some cases, makes flow cytometry extremely valuable for cell analysis. In applications to apoptosis, a combination of these output parameters can give information on the ratio of apoptotic to living cells and also to discriminate dead cells (Martinez et al. 2010a). The method is ideally suited to wavelength-ratiometric recording of a signal from single dye molecules, but these applications have just begun to emerge. Its power is commonly used in combined fluorescence measurements of fluorescence intensity from several dyes, for instance, for discriminating apoptotic and dead cells (see below).
Microscopy complements spectroscopy allows obtaining images of individual cells and in conventional confocal or two-photonic formats the resolution can be as high as 200–500 nm. Recent technical developments allow extending the wavelength range for excitation and image collection and provide construction of images in anisotropy and time domains. These methods even in automatic recording can only measure a few tens of cells at a time but, in contrast to flow cytometry, allow measurement of adherent cells and tissue slices. The methods using high-throughput microscopy with image-based quantification develop rapidly (Nath et al. 2012; Rimon and Schuldiner 2011). However such measurements based on imaging are slow because they require time for stage movement, autofocusing, and long exposures to detect low-intensity signals. They require significant resources for data storage (Downey et al. 2011).
The need for high-throughput screening that could allow rapid analysis in parallel of thousands of chemical, biochemical, genetic or pharmacological tests brought the development of new technologies. Microarray technique allows scanning a number of images (Fernandes et al. 2009; Yarmush and King 2009) and microfluidics (Yin and Marshall 2012) can be used to provide reagent addition and realize reactions in miniature volumes operating with single cells or small number of cells. Fluorescence spectroscopy and flow cytometry are achievable on microscale for providing in-chip analysis of apoptosis (Martinez et al. 2010a). Even the application of 96-well or 384-well plates must bring substantial improvement in toxicology research and drug discovery related to apoptosis. Fluorescence signal can be detected on a very low intensity level that is quite sufficient for working with spotted microarrays with sub-micrometer resolution. So what are the limiting factors for application of all these techniques to apoptosis?
The limit depends on the properties and mode of application of fluorescence reporters and sensing molecules that carry fluorescence labels. Reporting must be based on informative signal originated by the change in intermolecular interactions. This occurs in all the cases, but some of the reporters allow obtaining informative signal from these interactions directly and some require washing or separation steps before the analysis (Altschuh et al. 2006). They represent two basic methodologies in application of fluorescence to sensing and imaging (Fig. 2).
Fig. 2.

Comparison of “labeling” and “sensing” methodologies in application of fluorescence dyes
One of these methodologies is the “labeling”. The fluorophore is incorporated into the studied system usually being attached to one of interacting structures (e.g. FITC bound to annexin V) to indicate location, to produce contrast, etc. In this application the aim is the highest emission intensity, whereas the sensitivity to environment parameters (e.g. medium polarity, pH, temperature) is not desirable. If unbound or unreacted labeled structures remain in the studied system, they will also produce the fluorescence signal, so they have to be removed or quenched before the measurement and data analysis.
The other conceptually different methodology can be called “probing”. In this case, a high emission intensity is important, but the most essential is the response to structural or dynamic change in the system by observing the changes in one of fluorescence parameters: anisotropy, lifetime or positions and relative intensities of spectral bands (Demchenko 2009). In this case the probing fluorescence emitter should stay within the studied system, but its response should be modulated by the change in this system and should report on this change. If the dyes with appropriate properties can be found and applied, this case can be realized easily in homogeneous “mix-and-measure” formats, which are commonly simple, rapid and robust.
There is a great difference in applications between these methodologies. For realization of “labeling” the researcher possesses unlimited choice of fluorescent dyes (Schellenberger et al. 2004). And not only the dyes—radioactive or electron-dense labeling can be successfully applied. In contrast, for probing we need smart specially designed dyes that satisfy special requirements. As we will see below, the difference between these two methodologies is apparent on comparison of two methods—PS-affinity assay with annexin V and biomembrane probing with F2N12S.
PS-affinity assay with annexin V
Annexin V is a single-chain 36 kDa calcium-binding protein that interacts specifically and with high affinity with negatively charged PS. This molecule is composed of two distinct regions: a C-terminal core and an amino N-terminal “head” region. The core is highly conserved across the annexin protein family, and the N-terminus varies greatly. Successful expression in bacterial systems gave a source of recombinant protein that stimulated numerous investigations and generation of commercially available assay kits (Brumatti et al. 2008). The methods of conjugation of this protein to FITC and similar fluorophores and of its use for the detection of apoptotic cells are well described (Schellenberger et al. 2004). Labeling with NIR dyes extend applications towards tissue tomography (Ntziachristos et al. 2004). Fluorescent semiconductor nanoparticles (Quantum Dots) can be also used for annexin V labeling with the advantage of higher brightness and photostability (Le Gac et al. 2006). The labeled annexin V is currently the most frequently used probe to visualize the early-stage apoptosis in microscopy and to characterize the apoptotic cell populations by flow cytometry (Boersma et al. 2005; Hanshaw and Smith 2005; van Engeland et al. 1998).
The principle of annexin V assay is presented in Fig. 3. Operating in physiological conditions, this protein binds to the surface of cells that expose PS assembling into oligomeric structures. Since the affinity is very high (Kd ~ 10−7–10−8 M), in the conditions of apotosis practically all the annexin V molecules are bound, and due to attached fluorescent dye these cells become labeled.
Fig. 3.

The principle of apoptosis detection method based on annexin V. With the aid of Ca2+ ions, this protein interacts with high affinity with PS heads exposed on the membrane surface. Annexin V can be labeled with fluorescent dye that allows visualization of cells exposing PS
Using fluorescently labeled annexin V, it was demonstrated that the apoptotic cells expose PS at their outer membrane early after onset of the execution phase of apoptosis (Boersma et al. 2005). Interacting with vital or apoptotic cells, this protein molecule is not able to penetrate the phospholipid bilayer and label inner leaflet. However, in dead cells, since the integrity of the plasma membrane is lost, the inner leaflet of the membrane is available for binding of extrinsically applied annexin V. To discriminate between dead and apoptotic cells, a membrane-impermeable DNA stain, such as propidium iodide (PI), can be added simultaneously to the cell suspension. In this way vital, apoptotic and dead cells can be distinguished on the basis of double-labeling for annexin V and PI, and analyzed either by flow cytometry or by fluorescence microscopy. The results of typical flow cytometry experiment are presented in Fig. 4.
Fig. 4.

Flow cytometry of T lymphoblastoid cells treated by actinomycin D and stained by annexin V-FITC and PI. FITC and PI were selectively excited at 488 nm and their fluorescence at 530 and 610 nm, respectively, was collected simultaneously. a Cells are sorted into living (dark green), dead (purple), and apoptotic (blue) cell populations by the absolute intensities of the two probes. Note that on both coordinates the scale is logarithmic. b Histograms plotted on the basis of intensity response of bound annexin V-FITC (Shynkar et al. 2007). (Color figure online)
The years of application of annexin V test allowed revealing its strong and weak points. They are summarized in Table 1. A short comment to this table is presented below.
Table 1.
Summary of distinguishing properties of annexin V assay
| Strong points | Weak points |
|---|---|
| Annexin V when applied easily diffuses in the medium and binds spontaneously to plasma membrane surface without any cell damage | Diffusion and formation of high-affinity complexes is rather slow. Complete annexin V binding requires incubation times of tens of minutes |
| Annexin V demonstrates high affinity in binding to externalized PS | The test requires the presence of millimolar (usually ~2.5 mM) concentrations of Ca2+ ions, which is often not desirable |
| Annexin V demonstrates high selectivity of binding to PS against other molecules exposed to cell surface | The false positive results are observed due to binding to negatively charged aldehyde adducts (Balasubramanian et al. 2001) and in some apoptosis-independent pathologies, such as Barth syndrome (Kuijpers et al. 2004) |
| Annexin V test is applicable to in vivo and in tissue studies and also to cells obtained from solid tissues by protease treatment (van Engeland et al. 1998) | Being a protein, annexin V may exhibit slow diffusion in tissues and be itself a subject of enzymatic degradation |
| Protein recombinant technology is well developed for annexin V production | The labeled recombinant annexin V is expensive and moderately unstable |
| The protein can be labeled in different ways. The unlimited choice of dyes exists for its labeling | The unbound labeled protein contributes to background emission. For removing it the washing-out steps may be needed |
Primarily it should be stressed that this assay with regard to fluorescence reporting is a typical “labeling” technique with its brightness and simplicity advantage and disadvantage of dealing with unbound labeled annexin V that may produce strong background signal. Therefore it is not convenient for high throughput screening assays in drug discovery. The attempts have been made to introduce “sensing” methodology by labeling the protein with “polarity-sensitive” dyes. Thus, their thiol-reactive derivatives were inserted into the protein loop regions, so that on its Ca2+-dependent interaction with the membrane their environment changes from a polar (aqueous solution) to a nonpolar (lipid membrane) with dramatic enhancement of fluorescence (Kim et al. 2010). Technique known under the name pSIVA marks an important step forward in annexin V based methodology. In experiments on live-cell imaging, the dynamic local changes in individual rat neurons during degeneration in vitro and in vivo were observed.
Since annexin V bound to PS-exposing membranes forms oligomers (dimers or trimers), the cell treatment with a mixture of monomers carrying two different labels, forming the pair of donor and acceptor in excited-state resonance energy transfer, allows obtaining the signal reporting on the binding by observing the shifting from donor fluorescence to that of the acceptor. With this method the apoptotic cells can be detected in homogeneous sensing format without washing-out of the unbound annexin V, but the healthy cells remain undetected and cannot be quantified (Gasser et al. 2009).
These developments indicate the steps towards ‘mix-and-read’ direct sensing but they do not allow overcoming other disadvantages of annexin V assay, particularly the necessity of the presence of Ca2+ ions in millimolar (usually ~2.5 mM) concentrations. The X-ray structure shows that one phosphoserine head group is coordinated to two bridging Ca2+ ions that are in turn coordinated to one of the four canonical binding sites at the protein surface (Swairjo et al. 1995). The requirement on the participation of calcium ions in the assay produces complications in its practical use. For instance, the isolation of blood cells requires adding Ca2+ chelators for suppressing blood clotting, after that the chelators have to be washed-out and Ca2+ ions added again for apoptosis assay. Also, false positive results may appear because most animal cells have a Ca2+-dependent scramblase that can move PS to the cell surface.
The annexin V binding requires incubation times of tens of minutes. This makes problematic its application for kinetic analysis of the process that develops on the time scale of hours and this does not allow catching its earliest steps of PS exposure occurring in minutes (Mourdjeva et al. 2005). The annexin V binding is limited by slow diffusion of this 36 kDa protein and by slow formation of its high-affinity complexes. Its short lifetime in the body and its slow diffusion may result in difficulties for optical imaging of solid tissues.
When the cells from the solid tissues are prepared by separation with the aid of proteolytic enzymes it should not be forgotten that annexin V can be itself a subject of enzyme degradation, so before testing a proteolytic activity should be suppressed (van Engeland et al. 1998). Manipulation with detergents may also influence the lipid binding specificity (Meers and Mealy 1993). There is a concern that an increased binding of annexin V does not necessarily reflect an apoptotic state of the cell (Dong et al. 2011) and this test has to be supported by other methods.
With a goal of finding the PS-binding probes that are alternatives to annexin V, investigators have examined other proteins, such as annexin VI, Lactadhedrin and Synaptotagmin-I (Alam et al. 2010; Smith et al. 2010). Their PS-binding recombinant fragments were expressed which allowed site-specific binding of fluorescent labels. The smaller size of these proteins may be an advantage for some applications.
Other assays based on the binding to externalized PS
Despite successful application of fluorescently labeled annexin V and its analogs, there is a call for exploiting novel, convenient and inexpensive detection reagents that offer more versatility in applications (Hanshaw and Smith 2005). Most of recently suggested solutions are focused on the recognition of PS on the surface of apoptotic cells just mimicking the binding mechanism of annexin V. The most attractive ones in this line are the developments of low-molecular-weight high-affinity PS chelators. Among suggested compounds the most attention was directed towards the synthetic zinc(II)-di-2-picolylamine (Zn2+-DPA) coordination complexes (Koulov et al. 2005). Similarly to Ca2+ ions in annexin V assay, the Zn2+ ions mediate cooperative association of the probe molecule to the anionic head groups of the membrane-bound PS. So, in this case also the selective recognition of apoptotic cells needs a three-component assembly process. In the initially suggested compound, two DPA subunits were attached to an anthracene scaffold absorbing light at 380 nm, and this compound was called PSS-380 (Koulov et al. 2005). Two of Zn2+-DPA molecules can be also attached to side groups of fluorescein-labeled short peptides for increasing the strength of membrane binding (DiVittorio et al. 2006). Substitution of fluorescein by a near-IR fluorescence reporter allowed extending the imaging possibilities (Smith et al. 2011a). Thus, a probe, named PSS-794, was assessed for its ability to detect cell death in animal models. The whole-body and ex vivo imaging showed the effect of the radiation treatment of tumor. PSVue®, the commercial product of Molecular Targeting Technologies, Inc., is based on these developments.
Thus we observe that this PS detecting approach does not exclude the problem of ion dependence addressed to annexin V assay but allowed more flexibility in use for ex vivo and in vivo studies. Multivalent display of Zn2+-DPA units binding PS would further enhance the sensor affinity and could provide new synthetic nanomaterials with tunable characteristics. With this goal, the attempts to use nanoparticles as the scaffolds for these units have been made (Quinti et al. 2006). Diaminopropionic acid (Dpr), was selected as the building unit of the short PS-binding peptide. On each peptide, four DPA units were appended to the side chain of Dpr residues to increase the binding affinity and the labeling with fluorescein was performed. A good correlation with annexin V staining of apoptotic cells was observed.
The alternative approach was to select the species with high PS binding properties from the peptide libraries. Such short peptides (hexamers to 14-mers) that bind exposed PS with nanomolar affinity were found. The peptide with a sequence CLSYYPSYC was selected and when labeled with fluorescein applied for in vivo imaging (Thapa et al. 2008). Nanomolar binding affinity towards PS was achieved with a 14-residue peptide (Xiong et al. 2011). Promising in applications are the designed cyclic peptides that mimic the recognition site of the natural PS binding protein lactadherin (Zheng et al. 2011). Such binding does not need any metal cation cofactors.
Fluorescence methods targeting the cell surface charge
When the negatively charged PS re-locates to cell surface, it substitutes the neutral lipids and generates a change in the surface charge. Since this charge becomes more negative, the cationic dye can be readily adsorbed on cell surface. Such experiments are known, and one of tested dyes was merocyanine 540 (Laakko et al. 2002). The affinity of this dye for PS and selectivity in PC/PS ratio was studied in model membranes (Waczulikova et al. 2002), and with its cellular application the difference in fluorescence response was demonstrated on binding to vital and apoptotic cells (Laakko et al. 2002). Small affinity of this type of dyes to negatively charged membranes and their weak response to the binding as the change of fluorescence intensity plus their toxicity did not favor further developments and applications.
More success has been achieved when the cells were incubated with polycationic species that can provide multipoint binding to apoptotic cell membrane, such as the liposomes formed of artificial cationic lipids (Bose et al. 2004). Meantime, due to their low stability they are not attractive for practical use. The most interesting and practically attractive in this respect is the application of conjugated polymers with the side cationic groups that combine multipoint binding with strong fluorescence. In a recent study (Zhu et al. 2011) it was shown that poly(p-phenylene vinylene) derivative demonstrates remarkable ability to discriminate apoptotic cells from normal cells. This method offers a strong advantage over annexin V in terms of cost and stability. However, the incubation time to reach the equilibrium binding conditions with the cells is even longer than for annexin V, which strongly limits its application.
The method based on F2N12S probe
Based on the change of the cell surface charge on apoptosis, more sophisticated fluorescence probing can be provided. It can use the experience of fluorescence probe studies of the cellular membranes accumulated for years together with new important developments (Demchenko et al. 2009). If the transformations in the cell membranes that change these parameters occur during apoptosis, a small molecular tool reporting on the changes of surface potential can be developed to detect them (Demchenko and Yesylevskyy 2009). It is also known that apoptosis decreases the membrane lipid order (Schlegel et al. 1993) and increases the level of lipid oxidation (Matsura et al. 2005), which must lead to an increase of the polarity and hydration of the membrane. Therefore the problem was to develop a probe that could respond to these changes in the most sensitive and characteristic way.
On this pathway, several problems have to be solved. One of them is selecting the format of fluorescence detection that can potentially fit the broad range of applications and all kinds of inexpensive instrumentation (fluorimeters, fluorescent microscopes, flow cytometers, plate readers, microarrays). The response should be self-referenced on molecular scale and independent of instrumentation parameters. The only fluorescence format that satisfies these requirements is the wavelength-ratiometry (Demchenko 2010). Until present, its most popular its realization is the application of two dyes connected by FRET (Förster Resonance Energy Transfer) or by formation of excimers, j-aggregates, etc. If we avoid double labeling and develop the technology that could use a single dye, the test can be much simplified. But this is a complicated task that does not allow many solutions. In line with the above considerations, we have to find the dye exhibiting the change of emission color by switching between its two emission bands, and this should allow ultrasensitive ratiometric detection (Fig. 5).
Fig. 5.
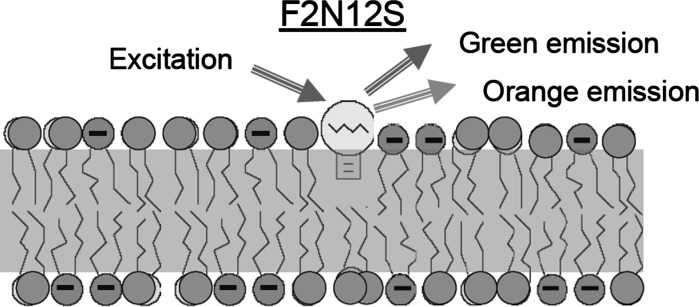
The principle of apoptosis detection method based on F2N12S dye. Due to high affinity, the dye is incorporated into the phospholipid moiety of the outer leaflet of the membrane and reports on the changes in surface potential, molecular order and hydration by the change of color of its emission. On apoptosis the relative intensity of “green” emission increases over the “orange” emission. (Color figure online)
The other problem was the selection of the proper basic fluorophore, which should be nontoxic and uncharged for not disturbing the bilayer structure. Being excited at single wavelength it should present switching between well resolved fluorescence bands in response to the surface charge and probably also to the lipid order and hydration. Based on the results of our previous studies (Demchenko 2006; Demchenko et al. 2003; Klymchenko et al. 2003) we selected the dye from the 4′-(dialkylamino)-3-hydroxyflavone family, which exhibits excited-state intramolecular proton transfer (ESIPT) reaction producing together with initially excited “green” N* band (at 515–545 nm) the reaction product “orange” T* band (at 564–606 nm). The dynamic equilibrium between these two forms is shifted by variation of intermolecular interactions producing the relative changes of correspondent fluorescence intensities (Demchenko 2006; Klymchenko et al. 2003; Shynkar et al. 2004). Since the dynamic equilibrium between these two forms is established prior to emission (Shynkar et al. 2003), the factors changing the fluorescence lifetime (temperature, dynamic quenchers) do not change the ratiometric response (Oncul and Demchenko 2006; Tomin et al. 2007). Both these bands are strongly Stokes-shifted, so the “blue” excitation (with the maximum at about 420 nm) allows avoiding light-scattering artefacts.
The third problem was the achieving of high affinity towards lipid component of membrane (Hope-Roberts et al. 2011) together with high specificity of binding to outer leaflet of cellular membrane only, so that the probe could not move to inner leaflet (flip–flop) at the time of experiment. This was accomplished by synthesizing the derivative containing a membrane anchor, composed of two groups of opposite charge interacting with phospholipid heads and a long (dodecyl) hydrophobic tail. As a consequence a developed probe F2N12S (Fig. 6) satisfied all these requirements, including the last one. It exhibits only a limited flip–flop in the membranes of living cells during the time course of our experiments (0.5–1 h), as the absence of time-dependent changes in its emission spectrum was shown at this time scale. (Shynkar et al. 2007).
Fig. 6.

Location of F2N12S probe in the outer leaflet of biological membrane. Interactions between opposite charges with PC molecules are indicated
This probe was first tested on neutral and negatively charged model membranes and showed a dramatic difference in response between them. Then the expected differences were observed on cultured cells with spectroscopy (Fig. 7), microscopy (Fig. 8) and flow cytometry (Fig. 9). In all these studies it was shown that the ratio of intensities of the two emission bands changed dramatically in response to apoptosis. The ability of producing bright fluorescence image of cellular membrane is seen by both confocal (Shynkar et al. 2007) and two-photon (Oncul et al. 2010) microscopy.
Fig. 7.

Fluorescence spectra of F2N12S probe in cell suspensions. The spectra were recorded in normal (solid) or in apoptotic CEM cells either in the absence (dashes) or in the presence of 2 mM Ca2+ ions (dots). Excitation wavelength was 400 nm. Final probe concentration was 100 nM (Shynkar et al. 2007)
Fig. 8.

Example of an application of F2N12S in cell microscopy. Fluorescence ratiometric images of normal (a) and apoptotic (b) cells stained with F2N12S using two-photon excitation at 830 nm. Note that the images are presented in artificial color based on intensity ratio at 520 and 580 nm (Oncul et al. 2010). (Color figure online)
Fig. 9.

Example of an application of F2N12S in flow cytometry. a The distribution of treated cells stained by F2N12S between the living (green) and apoptotic plus dead cells can be seen as two separate populations based on T*/N* ratio. Application of logarithmic coordinate based on PI response allows separating apoptotic (blue) and dead (purple) cell sub-populations. b Representation of results of the same experiment in two coordinates of N* and T* intensities for living (green) and dead plus apoptotic (red) cells. The wavelengths of maximal transmission and bandwidths of used filters are indicated in parenthesis for the headings of the axes (Shynkar et al. 2007). (Color figure online)
Figure 9 demonstrates the results obtained by flow cytometry. They show that the ratio T*/N* of intensities of two emission bands measured for each cell is characteristic for the process of apoptosis and cell death. In Fig. 9a we clearly observe two populations, one of them (shown in green) demonstrates high plotted T*/N* intensity ratio and, in accordance with our data on spectroscopic and microscopic analysis, we assign it to normal living cells. Another population is characterized by low T*/N* intensity ratio and has to be assigned to apoptotic and dead cells. Application of additional coordinate based on PI response allows distinguishing apoptotic and dead cells. Sensitivity of the test is witnessed by the fact that in control experiments, in which the same cells were studied without induction of apoptosis, the response of only intact and dead cells but not of the apoptotic cells was detected.
When the cell responses are counted and plotted as a two-dimensional diagram of N* and T* intensities (Fig. 9b), we observe that the range of these intensities is very broad covering up to two orders of magnitude. This is quite understood, since the cells must differ by the amount of their probe uptake. However, essential is the response of every cell plotted in these coordinates to a definite straight line (linear function stemming from zero point). There are only two of these lines and they are well separated. Two conclusions can be made here. One is that regardless of the amount of uptake of applied probe molecules by the cell their fluorescence response indicates its discrete functional state, vital or apoptotic. The other conclusion is that the vital and apoptotic states are really discrete, with the absence of intermediate forms.
From this experiment one can derive the most important advantage of F2N12S compared to annexin V and related probes. It is the fluorescence ratiometric response to apoptosis, which provides a self-calibrating absolute parameter of apoptotic transformation, so that both healthy and apoptotic cells produce fluorescence signal, but different for healthy and apoptotic cells. Moreover, since F2N12S is nonfluorescent in water, no background signal is generated and therefore no washing step is required. The latter simplifies significantly the staining protocol for experiments in cell suspensions, which makes the new probe attractive for high-throughput screening using reliable concentration-independent ratiometric detection technology.
Thus, the advantages of this new technology can be summarized as follows (Demchenko 2012):
Due to the small probe molecular size, its binding kinetics is fast and needs several minutes only. This allows observing apoptosis process in development starting from very early steps.
Incorporation of probe occurs with high affinity to all types of cells (living, apoptotic or dead), which allows detecting these cells on comparable scale of fluorescence intensity analyzing only their distinguishing ratiometric signal.
Background probe signal is absent not only due to its complete incorporation into any type of cells but also due to the absence of fluorescence of unbound probe in water or in aqueous buffers. So, no washing steps are required.
Binding of probe is independent of Ca2+ or of any other type of ions. Apoptosis can be detected under a broad variety of conditions (temperature, pH, etc.,).
Proteases cannot modify the probe and, therefore, fluorescence response.
Being ratiometric and providing a dramatic color change, the response of the new probe can be easily quantified on an absolute scale.
Since a ratiometric signal is generated in a single dye, no double labeling is needed, and excitation can be provided at a single wavelength by a single light source.
Self-calibration of apoptotic signal on molecular scale allows recording the degree and the spatial distribution of the apoptotic changes over the cell plasma membranes. The studying of generation and propagation of apoptotic signal over the membranes of individual cells becomes possible.
In addition, since F2N12S is a relatively small organic molecule, it is more stable than a protein-based reagent, can be readily synthesized from inexpensive compounds and is easy to handle.
The F2N12S kit for flow cytometry (Telford 2012) is produced by Invitrogen (Cat. No. A35137), and this by no means limits its applications. This technology is compatible with many current sensing and imaging techniques, including different versions of fluorescent microscopy and microplate or microflow spectroscopy. It is essential that combination of such attractive features cannot be achieved by any ‘labeling’ technology aimed at detection of particular compounds.
Conclusions and prospects
In view of great importance of apoptosis to many areas of biological research there is a strong request for methods that permit continuous monitoring of cell viability or apoptotic changes in a nontoxic and noninvasive manner. Cell surface is easily accessible, and interactions on this surface usually do not produce its damage. Detection of structural changes in cell membranes does not need to compromise the cell integrity or to provide penetration of odd compounds into its interior. These changes occur and can be detected on early steps of apoptosis when the cell integrity is not disrupted. Furthermore, such strategy of probing the cell surface opens pathways for the applications for site-specific in vivo imaging of apoptotic tissues that would be useful in the treatment of various diseases such as cancer and cardiovascular disease.
Two major methodologies can be applied for detecting and characterizing these changes. One is focused on detection of particular molecules, and the other on characterizing integral changes in the studied structure on a larger scale. PS is one of molecular targets. Although its specificity to apoptosis is not absolute, its efficiency as an apoptosis marker is well recognized. Its molecular recognition requires multi-point binding and has commonly to be mediated by third components—bivalent cations. Advantages of this approach are apparent, but the limitations are also observed. They appear due to slow diffusion and recognition processes and to the influence of many external factors of them. The sensor molecules should contain fluorescence reporter, and their presence without binding may produce substantial background signal. The commonly applied detection methods are based on the measurements of fluorescence intensity at a single wavelength. It is the relative parameter that does not allow calibration on molecular scale.
The recently developed alternative methodology is based on a different concept. Small-size fluorescent organic molecule can be rapidly incorporated into the cell membrane. Its design allows high-affinity labeling of only the outer membrane leaflet. Moreover, operating with substituent structures one can locate such molecule at desired depth and orientation in the membrane. The selection of this organic fluorophore leads to a smart molecule that is nonfluorescent without binding to membrane (zero background) and, when bound, responds in a convenient wavelength range on the changes in hydration, polarity or surface potential. This response is in concentration-independent and calibrated manner on a molecular scale. F2N12S possesses these properties. Combining high spatial/temporal resolution, sensitivity, and easiness of use, this methodology is open for further development.
New challenges are put forward. When the fluorescence techniques are applied on the level of tissues or whole organisms, strong limitations appear due to low penetration of light in these media because of high absorbance and light-scattering. Presently in this case the ‘labeling’ technology has definite advantages, since it allows free selection of fluorescence reporters including the dyes excited in the near-IR range 800–1,000 nm (the wavelength range of maximal transparency of living tissues) (Ntziachristos et al. 2004; Smith et al. 2011b), the fluorescent nanoparticles exhibiting upconversion phenomenon (Nagarajan and Zhang 2011) or applying two-photon excitation (Rubart 2004). In the case of deeply located cells and dense tissues the probing with radioactive or MRI contrast agents (Blankenberg and Norfray 2011) or smart nanoparticles that combine MRI and fluorescence responses (van Tilborg et al. 2006) was suggested. Regarding ‘sensing’ technology, these applications are not straightforward, though F2N12S can be a relatively good two-photonic absorber (Oncul et al. 2010). Development of apoptosis detecting technology based on smart responsive red and near-IR sensing dyes remains a great challenge.
Strong but still unrealized advantages of ‘sensing’ technology exist on the sub-cellular level, and these studies may need high but achievable time resolution. The ‘eat-me’ signal could be initiated at some site and then propagated over the whole cell membrane, so that externalization of PS could be only a part of a specific spatial reorganization of existing membrane components. Some unknown switching mechanism should provide transcending the membrane together with the whole cell from one discrete physiologic state (nonapoptotic) to another (apoptotic) discrete state. What is the mechanism of this rapid and coordinated switching? The technical means are becoming available to visualize and monitor the progression of apoptotic transformation on the biomembrane level from early stages to complete cell death. The experiments are expected to become available at the single-cell level and even with intra-cellular resolution both in culture and in tissue.
References
- Alam IS, Neves AA, Witney TH, Boren J, Brindle KM. Comparison of the C2A domain of synaptotagmin-I and annexin-V as probes for detecting cell death. Bioconjug Chem. 2010;21:884–891. doi: 10.1021/bc9004415. [DOI] [PubMed] [Google Scholar]
- Altschuh D, Oncul S, Demchenko AP. Fluorescence sensing of intermolecular interactions and development of direct molecular biosensors. J Mol Recognit. 2006;19:459–477. doi: 10.1002/jmr.807. [DOI] [PubMed] [Google Scholar]
- Balasubramanian K, Schroit AJ. Aminophospholipid asymmetry: a matter of life and death. Annu Rev Physiol. 2003;65:701–734. doi: 10.1146/annurev.physiol.65.092101.142459. [DOI] [PubMed] [Google Scholar]
- Balasubramanian K, Bevers EM, Willems GM, Schroit AJ. Binding of annexin V to membrane products of lipid peroxidation. Biochemistry. 2001;40:8672–8676. doi: 10.1021/bi010841y. [DOI] [PubMed] [Google Scholar]
- Blankenberg FG, Norfray JF. Multimodality molecular imaging of apoptosis in oncology. Am J Roentgenol. 2011;197:308–317. doi: 10.2214/AJR.11.6953. [DOI] [PubMed] [Google Scholar]
- Boersma HH, Kietselaer BL, Stolk LM, Bennaghmouch A, Hofstra L, Narula J, Heidendal GA, Reutelingsperger CP. Past, present, and future of annexin A5: from protein discovery to clinical applications. J Nucl Med. 2005;46:2035–2050. [PubMed] [Google Scholar]
- Bose S, Tuunainen I, Parry M, Medina OP, Mancini G, Kinnunen PK. Binding of cationic liposomes to apoptotic cells. Anal Biochem. 2004;331:385–394. doi: 10.1016/j.ab.2004.05.033. [DOI] [PubMed] [Google Scholar]
- Brumatti G, Sheridan C, Martin SJ. Expression and purification of recombinant annexin V for the detection of membrane alterations on apoptotic cells. Methods. 2008;44:235–240. doi: 10.1016/j.ymeth.2007.11.010. [DOI] [PubMed] [Google Scholar]
- Coppola JM, Ross BD, Rehemtulla A. Noninvasive imaging of apoptosis and its application in cancer therapeutics. Clin Cancer Res. 2008;14:2492–2501. doi: 10.1158/1078-0432.CCR-07-0782. [DOI] [PMC free article] [PubMed] [Google Scholar]
- Demchenko AP. The future of fluorescence sensor arrays. Trends Biotech. 2005;23:456–460. doi: 10.1016/j.tibtech.2005.06.003. [DOI] [PubMed] [Google Scholar]
- Demchenko AP. Optimization of fluorescence response in the design of molecular biosensors. Anal Biochem. 2005;343:1–22. doi: 10.1016/j.ab.2004.11.041. [DOI] [PubMed] [Google Scholar]
- Demchenko AP. The problem of self-calibration of fluorescence signal in microscale sensor systems. Lab Chip. 2005;5:1210–1223. doi: 10.1039/b507447a. [DOI] [PubMed] [Google Scholar]
- Demchenko AP. Visualization and sensing of intermolecular interactions with two-color fluorescent probes. FEBS Lett. 2006;580:2951–2957. doi: 10.1016/j.febslet.2006.03.091. [DOI] [PubMed] [Google Scholar]
- Demchenko AP. Introduction to fluorescence sensing. Amsterdam: Springer; 2009. [Google Scholar]
- Demchenko AP. The concept of lambda-ratiometry in fluorescence sensing and imaging. J Fluoresc. 2010;20:1099–1128. doi: 10.1007/s10895-010-0644-y. [DOI] [PubMed] [Google Scholar]
- Demchenko AP (2012) Cellular membrane changes on apoptosis. Fluorescence detection. Exp Oncol (Kiev) 34 (in press) [PubMed]
- Demchenko AP, Yesylevskyy SO. Nanoscopic description of biomembrane electrostatics: results of molecular dynamics simulations and fluorescence probing. Chem Phys Lipids. 2009;160:63–84. doi: 10.1016/j.chemphyslip.2009.05.002. [DOI] [PubMed] [Google Scholar]
- Demchenko AP, Klymchenko AS, Pivovarenko VG, Ercelen S, Duportail G, Mely Y. Multiparametric color-changing fluorescence probes. J Fluoresc. 2003;13:291–295. doi: 10.1023/A:1025302525771. [DOI] [Google Scholar]
- Demchenko AP, Mely Y, Duportail G, Klymchenko AS. Monitoring biophysical properties of lipid membranes by environment-sensitive fluorescent probes. Biophys J. 2009;96:3461–3470. doi: 10.1016/j.bpj.2009.02.012. [DOI] [PMC free article] [PubMed] [Google Scholar]
- DiVittorio KM, Johnson JR, Johansson E, Reynolds AJ, Jolliffe KA, Smith BD. Synthetic peptides with selective affinity for apoptotic cells. Org Biomol Chem. 2006;4:1966–1976. doi: 10.1039/b514748d. [DOI] [PubMed] [Google Scholar]
- Dong HP, Holth A, Ruud MG, Emilsen E, Risberg B, Davidson B. Measurement of apoptosis in cytological specimens by flow cytometry: comparison of Annexin V, caspase cleavage and dUTP incorporation assays. Cytopathology. 2011;22:365–372. doi: 10.1111/j.1365-2303.2010.00811.x. [DOI] [PubMed] [Google Scholar]
- Downey MJ, Jeziorska DM, Ott S, Tamai TK, Koentges G, Vance KW, Bretschneider T. Extracting fluorescent reporter time courses of cell lineages from high-throughput microscopy at low temporal resolution. PLoS One. 2011;6:e27886. doi: 10.1371/journal.pone.0027886. [DOI] [PMC free article] [PubMed] [Google Scholar]
- Edgington LE, Berger AB, Blum G, Albrow VE, Paulick MG, Lineberry N, Bogyo M. Noninvasive optical imaging of apoptosis by caspase-targeted activity-based probes. Nat Med. 2009;15:967–973. doi: 10.1038/nm.1938. [DOI] [PMC free article] [PubMed] [Google Scholar]
- Elliott JI, Surprenant A, Marelli-Berg FM, Cooper JC, Cassady-Cain RL, Wooding C, Linton K, Alexander DR, Higgins CF. Membrane phosphatidylserine distribution as a non-apoptotic signalling mechanism in lymphocytes. Nat Cell Biol. 2005;7:808–816. doi: 10.1038/ncb1279. [DOI] [PubMed] [Google Scholar]
- Erwig LP, Henson PM. Clearance of apoptotic cells by phagocytes. Cell Death Differ. 2008;15:243–250. doi: 10.1038/sj.cdd.4402184. [DOI] [PubMed] [Google Scholar]
- Fernandes TG, Diogo MM, Clark DS, Dordick JS, Cabral JM. High-throughput cellular microarray platforms: applications in drug discovery, toxicology and stem cell research. Trends Biotechnol. 2009;27:342–349. doi: 10.1016/j.tibtech.2009.02.009. [DOI] [PMC free article] [PubMed] [Google Scholar]
- Foller M, Huber SM, Lang F. Erythrocyte programmed cell death. IUBMB Life. 2008;60:661–668. doi: 10.1002/iub.106. [DOI] [PubMed] [Google Scholar]
- Gasser JP, Hehl M, Millward TA. A homogeneous time-resolved fluorescence resonance energy transfer assay for phosphatidylserine exposure on apoptotic cells. Anal Biochem. 2009;384:49–55. doi: 10.1016/j.ab.2008.09.016. [DOI] [PubMed] [Google Scholar]
- Green DR, Kroemer G. The pathophysiology of mitochondrial cell death. Science. 2004;305:626–629. doi: 10.1126/science.1099320. [DOI] [PubMed] [Google Scholar]
- Hanshaw RG, Smith BD. New reagents for phosphatidylserine recognition and detection of apoptosis. Bioorg Med Chem. 2005;13:5035–5042. doi: 10.1016/j.bmc.2005.04.071. [DOI] [PubMed] [Google Scholar]
- Hope-Roberts M, Horobin RW, Wainwright M. Identifying apoptotic cells with the 3-hydroxyflavone derivative F2N12S, a ratiometric fluorescent small molecule probe selective for plasma membranes: a possible general mechanism for selective uptake into apoptotic cells. Biotech Histochem. 2011;86:255–261. doi: 10.3109/10520291003723426. [DOI] [PubMed] [Google Scholar]
- Kagan VE, Fabisiak JP, Shvedova AA, Tyurina YY, Tyurin VA, Schor NF, Kawai K. Oxidative signaling pathway for externalization of plasma membrane phosphatidylserine during apoptosis. FEBS Lett. 2000;477:1–7. doi: 10.1016/S0014-5793(00)01707-5. [DOI] [PubMed] [Google Scholar]
- Kerbiriou-Nabias D, Geldwerth-Feniger D. Exposition membranaire de la phosphatidylsérine et activité procoagulante des plaquettes. Hématologie. 2007;13:94–109. [Google Scholar]
- Kiessling V, Wan C, Tamm LK. Domain coupling in asymmetric lipid bilayers. Biochim Biophys Acta. 2009;1788:64–71. doi: 10.1016/j.bbamem.2008.09.003. [DOI] [PMC free article] [PubMed] [Google Scholar]
- Kim R, Tanabe K, Uchida Y, Emi M, Inoue H, Toge T. Current status of the molecular mechanisms of anticancer drug-induced apoptosis. The contribution of molecular-level analysis to cancer chemotherapy. Cancer Chemother Pharmacol. 2002;50:343–352. doi: 10.1007/s00280-002-0522-7. [DOI] [PubMed] [Google Scholar]
- Kim YE, Chen J, Chan JR, Langen R. Engineering a polarity-sensitive biosensor for time-lapse imaging of apoptotic processes and degeneration. Nat Methods. 2010;7:67–73. doi: 10.1038/nmeth.1405. [DOI] [PMC free article] [PubMed] [Google Scholar]
- Klymchenko AS, Pivovarenko VG, Ozturk T, Demchenko AP. Modulation of the solvent-dependent dual emission in 3-hydroxychromones by substituents. New J Chem. 2003;27:1336–1343. doi: 10.1039/b302965d. [DOI] [Google Scholar]
- Korngold EC, Jaffer FA, Weissleder R, Sosnovik DE. Noninvasive imaging of apoptosis in cardiovascular disease. Heart Fail Rev. 2008;13:163–173. doi: 10.1007/s10741-007-9068-4. [DOI] [PMC free article] [PubMed] [Google Scholar]
- Koulov AV, Hanshaw RG, Stucker KA, Lakshmi C, Smith BD. Biophysical studies of a synthetic mimic of the apoptosis-detecting protein annexin V. Israel J Chem. 2005;45:373–379. doi: 10.1560/6AD4-LC9G-P57M-BE5Y. [DOI] [Google Scholar]
- Krampe B, Al-Rubeai M. Cell death in mammalian cell culture: molecular mechanisms and cell line engineering strategies. Cytotechnology. 2010;62:175–188. doi: 10.1007/s10616-010-9274-0. [DOI] [PMC free article] [PubMed] [Google Scholar]
- Krysko DV, Vanden Berghe T, D’Herde K, Vandenabeele P. Apoptosis and necrosis: detection, discrimination and phagocytosis. Methods. 2008;44:205–221. doi: 10.1016/j.ymeth.2007.12.001. [DOI] [PubMed] [Google Scholar]
- Kuijpers TW, Maianski NA, Tool AT, Becker K, Plecko B, Valianpour F, Wanders RJ, Pereira R, Van Hove J, Verhoeven AJ, Roos D, Baas F, Barth PG. Neutrophils in Barth syndrome (BTHS) avidly bind annexin-V in the absence of apoptosis. Blood. 2004;103:3915–3923. doi: 10.1182/blood-2003-11-3940. [DOI] [PubMed] [Google Scholar]
- Laakko T, King L, Fraker P. Versatility of merocyanine 540 for the flow cytometric detection of apoptosis in human and murine cells. J Immunol Methods. 2002;261:129–139. doi: 10.1016/S0022-1759(01)00562-2. [DOI] [PubMed] [Google Scholar]
- Le Gac S, Vermes I, van den Berg A. Quantum dots based probes conjugated to annexin V for photostable apoptosis detection and imaging. Nano Lett. 2006;6:1863–1869. doi: 10.1021/nl060694v. [DOI] [PubMed] [Google Scholar]
- Lee BW, Olin MR, Johnson GL, Griffin RJ. In vitro and in vivo apoptosis detection using membrane permeant fluorescent-labeled inhibitors of caspases. Methods Mol Biol. 2008;414:109–135. doi: 10.1007/978-1-59745-339-4_10. [DOI] [PubMed] [Google Scholar]
- Martinez MM, Reif RD, Pappas D. Detection of apoptosis: a review of conventional and novel techniques. Anal Methods. 2010;2:996–1004. doi: 10.1039/c0ay00247j. [DOI] [Google Scholar]
- Martinez MM, Reif RD, Pappas D. Early detection of apoptosis in living cells by fluorescence correlation spectroscopy. Anal Bioanal Chem. 2010;396:1177–1185. doi: 10.1007/s00216-009-3298-3. [DOI] [PubMed] [Google Scholar]
- Matsura T, Togawa A, Kai M, Nishida T, Nakada J, Ishibe Y, Kojo S, Yamamoto Y, Yamada K. The presence of oxidized phosphatidylserine on Fas-mediated apoptotic cell surface. Biochim Biophys Acta. 2005;1736:181–188. doi: 10.1016/j.bbalip.2005.08.011. [DOI] [PubMed] [Google Scholar]
- Meers P, Mealy T. Calcium-dependent annexin V binding to phospholipids: stoichiometry, specificity, and the role of negative charge. Biochemistry. 1993;32:11711–11721. doi: 10.1021/bi00094a030. [DOI] [PubMed] [Google Scholar]
- Mourdjeva M, Kyurkchiev D, Mandinova A, Altankova I, Kehayov I, Kyurkchiev S. Dynamics of membrane translocation of phosphatidylserine during apoptosis detected by a monoclonal antibody. Apoptosis. 2005;10:209–217. doi: 10.1007/s10495-005-6076-5. [DOI] [PubMed] [Google Scholar]
- Nagarajan S, Zhang Y. Upconversion fluorescent nanoparticles as a potential tool for in-depth imaging. Nanotechnology. 2011;22:395101. doi: 10.1088/0957-4484/22/39/395101. [DOI] [PubMed] [Google Scholar]
- Nath S, Spencer VA, Han J, Chang H, Zhang K, Fontenay GV, Anderson C, Hyman JM, Nilsen-Hamilton M, Chang YT, Parvin B. Identification of fluorescent compounds with non-specific binding property via high throughput live cell microscopy. PLoS One. 2012;7:e28802. doi: 10.1371/journal.pone.0028802. [DOI] [PMC free article] [PubMed] [Google Scholar]
- Ntziachristos V, Schellenberger EA, Ripoll J, Yessayan D, Graves E, Bogdanov A, Jr, Josephson L, Weissleder R. Visualization of antitumor treatment by means of fluorescence molecular tomography with an annexin V-Cy5.5 conjugate. Proc Natl Acad Sci USA. 2004;101:12294–12299. doi: 10.1073/pnas.0401137101. [DOI] [PMC free article] [PubMed] [Google Scholar]
- Oncul S, Demchenko AP. The effects of thermal quenching on the excited-state intramolecular proton transfer reaction in 3-hydroxyflavones. Spectrochim Acta A Mol Biomol Spectrosc. 2006;65:179–183. doi: 10.1016/j.saa.2005.10.002. [DOI] [PubMed] [Google Scholar]
- Oncul S, Klymchenko AS, Kucherak OA, Demchenko AP, Martin S, Dontenwill M, Arntz Y, Didier P, Duportail G, Mely Y. Liquid ordered phase in cell membranes evidenced by a hydration-sensitive probe: effects of cholesterol depletion and apoptosis. Biochim Biophys Acta. 2010;1798:1436–1443. doi: 10.1016/j.bbamem.2010.01.013. [DOI] [PubMed] [Google Scholar]
- Pereira WO, Amarante-Mendes GP. Apoptosis: a programme of cell death or cell disposal? Scand J Immunol. 2011;73:401–407. doi: 10.1111/j.1365-3083.2011.02513.x. [DOI] [PubMed] [Google Scholar]
- Quinti L, Weissleder R, Tung CH. A fluorescent nanosensor for apoptotic cells. Nano Lett. 2006;6:488–490. doi: 10.1021/nl0524694. [DOI] [PubMed] [Google Scholar]
- Ran S, Thorpe PE. Phosphatidylserine is a marker of tumor vasculature and a potential target for cancer imaging and therapy. Int J Radiat Oncol Biol Phys. 2002;54:1479–1484. doi: 10.1016/S0360-3016(02)03928-7. [DOI] [PubMed] [Google Scholar]
- Ran S, Downes A, Thorpe PE. Increased exposure of anionic phospholipids on the surface of tumor blood vessels. Cancer Res. 2002;62:6132–6140. [PubMed] [Google Scholar]
- Ravichandran KS. Find-me and eat-me signals in apoptotic cell clearance: progress and conundrums. J Exp Med. 2010;207:1807–1817. doi: 10.1084/jem.20101157. [DOI] [PMC free article] [PubMed] [Google Scholar]
- Ravichandran KS, Lorenz U. Engulfment of apoptotic cells: signals for a good meal. Nat Rev Immunol. 2007;7:964–974. doi: 10.1038/nri2214. [DOI] [PubMed] [Google Scholar]
- Riedl SJ, Shi Y. Molecular mechanisms of caspase regulation during apoptosis. Nat Rev Mol Cell Biol. 2004;5:897–907. doi: 10.1038/nrm1496. [DOI] [PubMed] [Google Scholar]
- Rimon N, Schuldiner M. Getting the whole picture: combining throughput with content in microscopy. J Cell Sci. 2011;124:3743–3751. doi: 10.1242/jcs.087486. [DOI] [PubMed] [Google Scholar]
- Rubart M. Two-photon microscopy of cells and tissue. Circ Res. 2004;95:1154–1166. doi: 10.1161/01.RES.0000150593.30324.42. [DOI] [PubMed] [Google Scholar]
- Rucker-Martin C, Henaff M, Hatem SN, Delpy E, Mercadier JJ. Early redistribution of plasma membrane phosphatidylserine during apoptosis of adult rat ventricular myocytes in vitro. Basic Res Cardiol. 1999;94:171–179. doi: 10.1007/s003950050140. [DOI] [PubMed] [Google Scholar]
- Schellenberger EA, Weissleder R, Josephson L. Optimal modification of annexin V with fluorescent dyes. ChemBioChem. 2004;5:271–274. doi: 10.1002/cbic.200300741. [DOI] [PubMed] [Google Scholar]
- Schlegel RA, Stevens M, Lumley-Sapanski K, Williamson P. Altered lipid packing identifies apoptotic thymocytes. Immunol Lett. 1993;36:283–288. doi: 10.1016/0165-2478(93)90101-7. [DOI] [PubMed] [Google Scholar]
- Schutters K, Reutelingsperger C. Phosphatidylserine targeting for diagnosis and treatment of human diseases. Apoptosis. 2010;15:1072–1082. doi: 10.1007/s10495-010-0503-y. [DOI] [PMC free article] [PubMed] [Google Scholar]
- Shynkar V, Mely Y, Duportail G, Piemont E, Klymchenko AS, Demchenko AP. Picosecond time-resolved fluorescence studies are consistent with reversible excited-state intramolecular proton transfer in 4′-dialkylamino-3-hydroxyflavones. J Phys Chem A. 2003;109:9522–9529. doi: 10.1021/jp035855n. [DOI] [Google Scholar]
- Shynkar VV, Klymchenko AS, Piemont E, Demchenko AP, Mely Y. Dynamics of intermolecular hydrogen bonds in the excited states of 4′-dialkylamino-3-hydroxyflavones. On the pathway to an ideal fluorescent hydrogen bonding sensor. J Phys Chem A. 2004;108:8151–8159. doi: 10.1021/jp047990l. [DOI] [Google Scholar]
- Shynkar VV, Klymchenko AS, Kunzelmann C, Duportail G, Muller CD, Demchenko AP, Freyssinet JM, Mely Y. Fluorescent biomembrane probe for ratiometric detection of apoptosis. J Am Chem Soc. 2007;129:2187–2193. doi: 10.1021/ja068008h. [DOI] [PubMed] [Google Scholar]
- Smith C, Mehta R, Gibson DF, Levashova Z, Blankenberg FG, Tait JF. Characterization of a recombinant form of annexin VI for detection of apoptosis. Bioconjug Chem. 2010;21:1554–1558. doi: 10.1021/bc100239k. [DOI] [PubMed] [Google Scholar]
- Smith B, Xiao S, Wolter W, Wheeler J, Suckow M, Smith B. In vivo targeting of cell death using a synthetic fluorescent molecular probe. Apoptosis. 2011;16:722–731. doi: 10.1007/s10495-011-0601-5. [DOI] [PMC free article] [PubMed] [Google Scholar]
- Smith BA, Gammon ST, Xiao S, Wang W, Chapman S, McDermott R, Suckow MA, Johnson JR, Piwnica-Worms D, Gokel GW, Smith BD, Leevy WM. In vivo optical imaging of acute cell death using a near-infrared fluorescent zinc—dipicolylamine probe. Mol Pharm. 2011;8:583–590. doi: 10.1021/mp100395u. [DOI] [PMC free article] [PubMed] [Google Scholar]
- Steensma DP, Timm M, Witzig TE. Flow cytometric methods for detection and quantification of apoptosis. Methods Mol Med. 2003;85:323–332. doi: 10.1385/1-59259-380-1:323. [DOI] [PubMed] [Google Scholar]
- Swairjo MA, Concha NO, Kaetzel MA, Dedman JR, Seaton BA. Ca(2+)-bridging mechanism and phospholipid head group recognition in the membrane-binding protein annexin V. Nat Struct Biol. 1995;2:968–974. doi: 10.1038/nsb1195-968. [DOI] [PubMed] [Google Scholar]
- Tait JF. Imaging of apoptosis. J Nucl Med. 2008;49:1573–1576. doi: 10.2967/jnumed.108.052803. [DOI] [PubMed] [Google Scholar]
- Telford WG (2012) A violet ratiometric membrane probe for the detection of apoptosis. Curr Protoc Cytom UNIT 9.38: 9.38.31–39.38.12
- Telford WG, Komoriya A, Packard BZ, Bagwell CB. Multiparametric analysis of apoptosis by flow cytometry. Methods Mol Biol. 2011;699:203–227. doi: 10.1007/978-1-61737-950-5_10. [DOI] [PubMed] [Google Scholar]
- Thapa N, Kim S, So IS, Lee BH, Kwon IC, Choi K, Kim IS. Discovery of a phosphatidylserine-recognizing peptide and its utility in molecular imaging of tumour apoptosis. J Cell Mol Med. 2008;12:1649–1660. doi: 10.1111/j.1582-4934.2008.00305.x. [DOI] [PMC free article] [PubMed] [Google Scholar]
- Tomin VI, Oncul S, Smolarczyk G, Demchenko AP. Dynamic quenching as a simple test for the mechanism of excited-state reaction. Chem Phys. 2007;342:126–134. doi: 10.1016/j.chemphys.2007.09.036. [DOI] [Google Scholar]
- Ulukaya E, Acilan C, Yilmaz Y. Apoptosis: why and how does it occur in biology? Cell Biochem Funct. 2011;29:468–480. doi: 10.1002/cbf.1774. [DOI] [PubMed] [Google Scholar]
- van Engeland M, Nieland LJ, Ramaekers FC, Schutte B, Reutelingsperger CP. Annexin V-affinity assay: a review on an apoptosis detection system based on phosphatidylserine exposure. Cytometry. 1998;31:1–9. doi: 10.1002/(SICI)1097-0320(19980101)31:1<1::AID-CYTO1>3.0.CO;2-R. [DOI] [PubMed] [Google Scholar]
- van Meer G. Cellular lipidomics. EMBO J. 2005;24:3159–3165. doi: 10.1038/sj.emboj.7600798. [DOI] [PMC free article] [PubMed] [Google Scholar]
- van Tilborg GAF, Mulder WJM, Chin PTK, Storm G, Reutelingsperger CP, Nicolay K, Strijkers GJ. Annexin A5-conjugated quantum dots with a paramagnetic lipidic coating for the multimodal detection of apoptotic cells. Bioconj Chem. 2006;17:865–868. doi: 10.1021/bc0600463. [DOI] [PubMed] [Google Scholar]
- Waczulikova I, Rozalski M, Rievaj J, Nagyova K, Bryszewska M, Watala C. Phosphatidylserine content is a more important contributor than transmembrane potential to interactions of merocyanine 540 with lipid bilayers. Biochim Biophys Acta. 2002;1567:176–182. doi: 10.1016/S0005-2736(02)00614-4. [DOI] [PubMed] [Google Scholar]
- Xiong C, Brewer K, Song S, Zhang R, Lu W, Wen X, Li C. Peptide-based imaging agents targeting phosphatidylserine for the detection of apoptosis. J Med Chem. 2011;54:1825–1835. doi: 10.1021/jm101477d. [DOI] [PubMed] [Google Scholar]
- Yamaji-Hasegawa A, Tsujimoto M. Asymmetric distribution of phospholipids in biomembranes. Biol Pharm Bull. 2006;29:1547–1553. doi: 10.1248/bpb.29.1547. [DOI] [PubMed] [Google Scholar]
- Yarmush ML, King KR. Living-cell microarrays. Annu Rev Biomed Eng. 2009;11:235–257. doi: 10.1146/annurev.bioeng.10.061807.160502. [DOI] [PMC free article] [PubMed] [Google Scholar]
- Yin H, Marshall D. Microfluidics for single cell analysis. Curr Opin Biotechnol. 2012;23:110–119. doi: 10.1016/j.copbio.2011.11.002. [DOI] [PubMed] [Google Scholar]
- Zheng H, Wang F, Wang Q, Gao J. Cofactor-free detection of phosphatidylserine with cyclic peptides mimicking lactadherin. J Am Chem Soc. 2011;133:15280–15283. doi: 10.1021/ja205911n. [DOI] [PubMed] [Google Scholar]
- Zhu C, Yang Q, Liu L, Wang S. A potent fluorescent probe for the detection of cell apoptosis. Chem Commun (Camb) 2011;47:5524–5526. doi: 10.1039/c0cc05158f. [DOI] [PubMed] [Google Scholar]
- Zwaal RF, Comfurius P, Bevers EM. Surface exposure of phosphatidylserine in pathological cells. Cell Mol Life Sci. 2005;62:971–988. doi: 10.1007/s00018-005-4527-3. [DOI] [PMC free article] [PubMed] [Google Scholar]