

Abstract
Pyramidal neurons in the CA3 region of the hippocampal formation integrate synaptic information arriving in the dendrites within discrete laminar regions. At potentials near or below the resting potential integration of synaptic signals is most affected by the passive properties of the cell and hyperpolarization-activated currents (Ih). Here we focused specifically on a subset of neurons within the CA3b subregion in order to better understand their membrane response within subthreshold voltage ranges. Using a combined experimental and computational approach we found that the passive properties of these neurons varied up to 5-fold between cells. Likewise, there was a large variance in the expression of Ih channels. However, the contribution of Ih was minimal at resting potentials endowing the membrane with an apparent linear response to somatic current injection within ±10 mV. Unlike in CA1 pyramidal neurons, however, Ih activation was not potentiated in an activity dependent-manner. Computer modeling, based on a combination of voltage- and current-clamp data, suggested that an increasing density of these channels with distance from the soma, compared with a uniform distribution, would have no significant effect on the general properties of the cell because of their relatively lower expression. Nonetheless, temporal summation of excitatory inputs was affected by the presence of Ih in the dendrites in a frequency- and distance-dependent fashion.
Keywords: Dendrite, synaptic integration, resonance, voltage-clamp, computer modeling, temporal summation
Introduction
Synaptic integration in pyramidal neurons involves the electrical summation of excitatory and inhibitory signals transmitted from dendrite to the spike generating zone in concert with the activation of a repertoire of voltage-gated conductances shaping those signals (Hausser and Mel, 2003; Williams and Stuart, 2003; Johnston and Narayanan, 2008). Firing of a neuron is determined by interactions between the subthreshold linear and non-linear properties of the cell. CA3 pyramidal neurons have a number of interesting and unique properties with respect to synaptic integration. First, the passive properties of these cells are significantly different from other principal neurons in the hippocampal formation. The input resistance and membrane time constant of these cells is, on average, approximately 2-fold larger than CA1 pyramidal neurons (Spruston and Johnston, 1992; Major et al., 1994; Podlogar and Dietrich, 2006; Hemond et al., 2008). Second, the density of hyperpolarization-activated channels (Ih) are expressed at a significantly lower density compared with CA1 pyramidal neurons (Santoro et al., 2000; Vasilyev and Barish, 2002).
To better understand how the linear properties of CA3 pyramidal neurons affect synaptic integration and to investigate how the low density of Ih channels might impact synaptic conduction from dendrite to soma, we combined experimental and computational approaches using voltage- and current-clamp recordings to construct compartmental models of CA3 pyramidal cells. Here we report that both the passive properties and the density of Ih conductances in pyramidal neurons of area CA3b vary significantly from cell to cell. Using computer modeling we show that in spite of the relatively lower expression of Ih in these cells, temporal summation of excitatory inputs is affected in a frequency- and distance-dependent fashion. Finally, unlike CA1 pyramidal neurons (Fan et al., 2005) Ih activation was not plastic; theta-burst patterns of CA3 pyramidal neuron firing did not increase Ih and therefore had no activity-dependent effect on membrane excitability.
Experimental Procedures
Hippocampal slices
Animal use was in accordance with the University of Texas at San Antonio University Institutional Animal Care and Use Committee. Sprague-Dawley rats (Harlan Sprague-Dawley, Chicago, IL) 4-6 weeks old were anesthetized with halothane followed by pentobarbital (130 mg/kg i.p.). Animals were perfused with an ice-cold (4 °C), oxygenated (95% O2/5% CO2) modified artificial cerebrospinal fluid (aCSF) containing (in mM): 124 choline chloride, 2.5 KCl, 26 NaHCO3, 7 MgCl2, 0.5 CaCl2, 1.25 Na2HPO4, and 20 dextrose. Brains were removed and blocked to prepare horizontal brain slices (300-350 μm) containing transverse sections of the hippocampus with a vibratome (Vibratome Company, St. Louis, MO). Slices were first incubated in a submerged chamber for 30 minutes at 34 °C in oxygenated aCSF where choline chloride was replaced with equimolar NaCl. In addition, CaCl2, MgCl2, and dextrose were adjusted to 2.5, 1.3, and 10 mM, respectively. After this 30 minute period the tissue was allowed to return to room temperature (22-24 °C). Slices were transferred as needed to a submersion-type recording chamber mounted on an upright compound microscope (Zeiss Axioskop FS or Olympus BX50WI) perfused with oxygenated aCSF (~2 ml/min) at 34-35 °C. Except where noted, excitatory and inhibitory synaptic transmission was blocked with kynurenate (1 mM) or CNQX (10 μM), APV (50 μM), and bicucculine (20 μM) added to the aCSF (Sigma-Aldrich, St. Louis, MO).
Patch-clamp Recording
Whole-cell and nystatin-patch recordings were made from pyramidal neurons in region CA3b. This area was operationally defined as the length of the pyramidal layer that extended beyond the blades of the granule cell layer of the dentate gyrus and up to the fimbria (Masukawa et al., 1982). Cells were visually identified using infrared, video-DIC optics beneath a 40X water immersion objective. For whole-cell recording borosilicate glass pipettes (3-5 MΩ) were filled with (in mM): 120 K-gluconate, 20 KCl, 2 MgCl2, 0.1 ethylene glycol-bis[β-aminoethyl ether]-N,N,N’,N’-tetraacetic acid (EGTA), 10 n-[2-Hydroxyethyl]piperazine-N’-2-ethanesulfonic acid (HEPES), 3 Na2ATP, and 0.3 Na2GTP. For nystatin perforated patch recordings pipette tips were loaded with K-gluconate without nystatin (above) and backfilled with the same solution that included 500 μg/ml of nystatin (0.3% DMSO).
Electrical recordings were made with an Axoclamp 2b (Axon Instruments, Foster City, CA) or a PC-ONE voltage-clamp amplifier (Dagan Corporation) and digitized at 10-20 KHz with the use of an ITC-16 interface (Instrutech, Great Neck, NY) connected to a Power Macintosh computer running custom software written with Igor Pro (Wavemetrics, Lake Oswego, OR).
Voltage-clamp recording
Whole-cell voltage-clamp recordings of Ih were obtained by taking the average of 20-25 hyperpolarizing voltage-steps from -50 mV or -40 to a command potential ranging from -50 to -130 mV, with at least a 1-second interval taken between traces. Currents were leak subtracted by the average of 20 depolarizing voltage steps (+5 mV). Conductances were calculated from tail currents using previously described methods with an Erev = -30 mV (Pape, 1996; Magee, 1998).
Membrane resonance calculation
Membrane impedance was determined using standard methods described elsewhere (Manuel et al., 2007; Narayanan and Johnston, 2008). Briefly, a varying subthreshold sinusoidal current was applied using a ZAP function (Hu et al., 2002) and the resulting membrane response was recorded. Impedance (Zr) was calculated by dividing the Fourier transforms of the membrane potential response and the current input. Peak resonance frequency was determined at the maximum impendence and the quality factor (Q-factor) was calculated by peak impedance normalized to the impendence produced at the lowest frequency. A Q-factor of 1 indicates no resonance.
Computer Modeling
All simulations were implemented using the NEURON simulation environment (v5.9, Hines and Carnevale, 1997). In some cases, simulations were carried out using the ParallelContext class of NEURON on IBM Linux clusters (34- or 1024-processors) under PVM or MPI. Three-dimensional digital reconstructions of rat CA3b pyramidal neurons were obtained from the public archive Neuromorpho.Org (Ascoli, 2006) or, where noted, were provided directly by Dr. Brenda Claiborne (U. New Mexico). Fits of current clamp data to computer simulations were obtained using the Multiple Run Fitter tool of NEURON.
Results
Near-rest hyperpolarizing response
The typical voltage-response of CA3b pyramidal neurons to hyperpolarizing and depolarizing current steps was exponential charging of the membrane for transients that remained within 10 mV of Vrest (Fig. 1A). At more hyperpolarized potentials, a prominent sag, indicative of the activation of Ih channels was observed in most cells. Bath application of cesium (5 mM) or ZD7288 (30 μM) blocked the sag and linearized the voltage-current response (Fig. 1B). The cesium- and ZD7288-sensitive component was observed only at potentials more hyperpolarized than -10 mV from Vrest.
Figure 1. Membrane response to somatic current injection around Vrest.

A: Voltage-responses to a series of hyperpolarizing and depolarizing current steps before (left) and after (right) bath application of cesium (5 mM). A plot of the steady-state voltage change is plotted below. Note that the effect of cesium becomes prominent below -15 mV of Vrest. B: Voltage “sag” in response to hyperpolarizing current injection resulted from activation of Ih; the sag was blocked either by external cesium (top) or the Ih blocker ZD 7288 (30 μm; bottom).
Variance of passive membrane properties
At voltage ranges where there was an absence of Ih activation membrane charging of CA3b pyramidal neurons was typically best fit by two exponentials (Fig. 2A). The mean slow time constant (τ0) was 61 ± 24 ms (n=36), consistent with previous observations (Spruston and Johnston, 1992; Major et al., 1994). We found that values of the slow membrane time constant (τm) varied over approximately a 5-fold range from 15-139 ms (Fig. 2B) with a coefficient of variation (CV) of 0.46. The slow component contributed 81.3 ± 3.3% of the total amplitude, but had a higher variability (CV = 1.01, n=27). Similarly, mean input resistance (RN) for the same cells varied from 47-264 MΩ CV = 0.39). In contrast, resting potential (Vrest) varied little across cells (CV=0.09), with a mean of -61 ± 1 mV (range -52 to -74 mV, n= 36). There was also no significant correlation between τm and Vrest (Fig. 2C; r2 = 0.1) suggesting that cell health or poor seal resistance did not contribute to variation in τm (Spruston and Johnston, 1992). Additional parameters of cell viability including spike threshold, amplitude, half-width were not correlated with τm (Hemond et al., 2008).
Figure 2. Passive properties of an average CA3b pyramidal neuron.

A: Voltage-response (thick grey line) fit by two exponentials (thin black line) under normal conditions. B: The distribution of input resistance (RN) and slowest membrane time constant (τm) are shown in the plots above and below, respectively. C: There was no significant correlation between τm and resting potential (Vrest;; r2 = 0.1). D: Reconstruction of a CA3 pyramidal neuron (provided by Dr. Brenda, U. New Mexico). E: The relationship between RN and τm for our data set (black filled circles) was linear and fit by linear regression (black solid line). A passive model using cell2zr (see Methods) was constructed with a specific membrane capacitance (Cm) of 1 μF/cm2 and an axial resistance (Ra) of 100 Ωcm. The linear relationship between RN and τm is plotted by the dashed line. A better fit (thick grey line) was generated by increasing Cm from 1 to 2.5 μF/cm2.
Although we lacked morphological data for each cell in the data set, we next explored whether the parameters obtained from this sample were appropriate for a set of prototypical morphologies of CA3b pyramidal neurons. First, we found from our experimental measurements that the relationship between RN and τm was well-correlated (r2 = 0.55; Fig. 2E). Using five different CA3b neuron reconstructions, we modeled the relationship between RN and τm to see if indeed a linear relationship should be expected and it too was well-fit by linear regression (r2=0.98). However, for 4 of the 5 morphologies an approximately three-fold increase in Cm (2.8 ± 0.6 μF/cm2) was required to provide a reasonable fit across cells. This suggests that the morphologies of the reconstructions lacked sufficient surface area and that the increase in Cm was needed, in part to account for dendritic spines (Wilson, 1988), and argues against differences due to cut dendrites.
To further assess how cut dendrites might affect the passive properties of the cell, we systematically removed portions of the apical dendrites in the simulations, assuming sealed ends. This resulted in an increase in the slope of the RN/τm relationship consistent with a loss of surface area and less dendritic load. However, only when dendrites were severed close to the soma, where a significant proportion (>75%) of the apical or basal dendritic tree was disconnected, were significant changes in RN observed. Thus, it is more likely that surface area due to dendritic spines is unaccounted for in the models, rather than a loss by cut dendrites.
Another possibility is that we recorded from a subset of cells that were in CA3c or were located close to this region and more resembled the morphology and properties of these smaller cells (Scharfman, 1993). This is unlikely for two reasons. First, dendritic surface area had to be increased in the model to match the data. CA3c cells have significantly less surface area (Krichmar et al., 2002) than neurons of CA3b. Second, because of the lower surface area, if these cells were part of our data set the relationship between τm and RN (Fig. 2E) would not have been linear (assuming τm co-varies with surface area) and in turn reducing the fit with the experimental data.
Heterogenity is not due to variations in Ih
RN and τm can be affected by voltage-gated channels active at rest, such as the Ih current (Spruston and Johnston, 1992; Fan et al., 2005; Narayanan and Johnston, 2007). To test the hypothesis that variations in apparent RN and τm described above result from variation in Ih, we examined these parameters before and after bath application of Ih antagonists. We first examined if Ih is active at rest, expecting blockade of these channels to hyperpolarize membrane potential. Application of either blocker of Ih, external cesium (5 mM; n=8) or ZD 7288 (30 μM; n=4), did not hyperpolarize membrane potential. Rather, a slight, but not significant, depolarization of membrane potential was observed. As there was no significant difference between the effect of either blocker, from pooled data of both groups mean Vrest under control conditions was -59 ± 1 mV which then depolarized to -56 ± 2 mV following addition of blockers (n=12).
We next tested how the blockers affected measured values of τm and RN. From the average response to 25-50 hyperpolarizing current steps (~20 mV of Vrest), we fitted the transients by a single exponential. From this fit, values for apparent τm and RN were determined before and after bath application of either cesium or ZD 7288, as described above. As shown in Figure 3A, overall blockade of Ih had no significant effect on either parameter; 6 of the 12 cells showed an increase in τm and RN, while in the remaining cells these parameters decreased. Moreover, the CV of τm and RN slightly increased in the presence of blockers, going from 0.13 to 0.14 and 0.07 to 0.09, respectively. If Ih was the source of the variation between cells we would expect CV to have gone down. Finally, when we compared the relationship between τm and RN (Fig. 3B) before and after blockers, again there was no significant effect on the slope of the relationship.
Figure 3. Variation in passive properties is not due to Ih.

A. There was no significant difference in τm (left) or RN (right) following external application of Ih blockers cesium or ZD 7288. Individual experiments are shown by the open circles and the means are plotted as filled circles. B. The relationship between RN and τm was not significantly different after bath application of Ih blockers. The slope of the relationship decreased from 0.9 (solid line) to 0.7 (dashed line) and the correlation coefficient decreased from 0.6 to 0.43 when blockers were present.
No significant membrane resonance
CA1 pyramidal neurons display a substantial impedance resonance that peaks near 5 Hz, at rest and at hyperpolarized by potentials due in part to Ih (Hu et al., 2002; Narayanan and Johnston, 2008). In contrast, we found that the subthreshold membrane response of CA3b neurons was not significantly resonant, even at potentials where Ih is active. Injection of a variable sinusoidal current ZAP function (Fig. 4A) was used to measure the impedance of CA3b pyramidal neurons over a range of frequencies (Hu et al., 2002) at a membrane potential near rest and -20 mV from rest. For most cells, low-pass filtering of the response (Fig. 4B), with no obvious resonance at any frequency, was observed. Summary data of the peak frequency and quality-factor (Q-factor) is shown in Figure 4C (n=6) illustrating the lack of resonant response.
Figure 4. CA3b pyramidal neurons show little membrane resonance at hyperpolarized potentials.

A: Example membrane response (top traces) at a holding potential of -60 and -80 mV to a ZAP current injection (bottom trace). B: Impedance plotted as a function of frequency at two different holding potentials. Note that for this cell no resonance was observed (i.e. peak impedance was at the lowest frequency). C: Summary data for the peak frequency (C1) and for Q-factor (C2), where a Q-factor of 1 indicates no resonance.
Lack of Ih plasticity
Ih in CA1 pyramidal neurons expresses an interesting form of use-dependent plasticity (Fan et al., 2005) in response to theta-burst synaptic stimulation (TBS); short (5 pulses) 100 Hz trains delivered at 200 ms intervals not only induces long-term potentiation (LTP), but also augments Ih resulting in a net inhibition of excitability (i.e. turning off Ih during membrane depolarization reduces net outward current). Similarly, a theta burst firing pattern (TBF) of firing alone in these cells triggers the same increase in Ih, generated by the influx of calcium through NMDA receptors activated by spontaneous transmitter release.
Since the density of Ih expression is low in CA3 pyramidal neurons (Santoro et al.; Vasilyev and Barish), we hypothesized that any increases in this conductance might have a profound effect on the excitability of the cell. To test this possibility, we measured the sag ratio, a measure of Ih effectiveness, in CA3b cells before and after delivering TBS (Fig. 5A) to commissural/associational fibers onto CA3b cells or triggering spikes in a TBF pattern by somatic current injection (Fig. 5D). Note that in these experiments, blockers of excitatory synaptic transmission were absent from the bathing medium. No difference in sag ratio (Fig. 5B, E, & F) or voltage-current relationship (Fig. 5C) was observed following either paradigm. In contrast, TBF of Schaffer-collateral synapses onto CA1 neurons resulted in an increase in sag and an apparent decrease in RN (Fig. 5E & F).
Figure 5. “Sag” produced by Ih in CA3 pyramidal neurons does not exhibit activity-dependent plasticity.
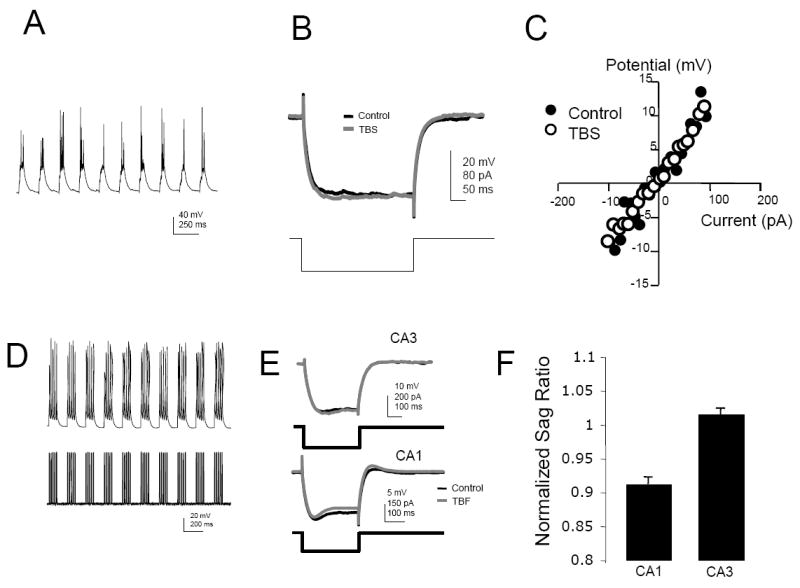
A: Theta-burst stimulation (TBS) of commissural/associational fibers onto a CA3b pyramidal neuron. B: No change in the membrane response following TBS. C: No change in the voltage-current relationship compiled from systematic variation in the amplitude of current injection applied to the soma. D: Theta-burst firing (TBF) evoked by trains of depolarizing current applied to the soma. E: TBF enhances “sag” and rebound depolarization in CA1 pyramidal neurons but not in CA3 pyramidal neurons. F: The sag ratio, measured from the steady-state amplitude of the voltage-response and the peak voltage response to hyperpolarizing current injection before and after TBF in CA1 (n=3) and CA3 (n=7) pyramidal neurons.
Modeling the active hyperpolarizing response
A subset of cells was recorded in both voltage- and current-clamp mode to study how the Ih current, as measured at the soma, contributed to the membrane response. A series of hyperpolarizing steps from a holding potential of -50 mV was applied at 1 second intervals revealing an inward current (Fig. 6A). Activation curves were generated from tail current measurements taken at ~5 milliseconds following the end of the voltage step and fitted with a Boltzman function (Fig. 6B). For all cells the mean half-maximal activation was -91.8 ± 1.6 mV with a mean slope of 5.4 ± 2.0 (n=8). As predicted by our current-clamp experiments, activation of Ih was undetectable at potentials near Vrest. We also attempted to record Ih currents at the soma in cell-attached mode, but no currents were detected (data not shown).
Figure 6. Activation of Ih is well below Vrest.

A: Currents (leak subtracted) produced by a series of hyperpolarizing voltage-steps (lower traces). B: Representative activation curve from a CA3b pyramidal neuron fitted by a Boltzman relationship (grey line).
Using pooled activation data the best-fit Boltzman curve to these points had a half-maximal activation of approximately -89 mV and a slope of 7.9 (Fig. 7A). The time-dependent activation of these currents was best fit by two time constants; a fast time constant of approximately 50-200 ms and a slower time constant of 500-1000 ms that, except for one cell, generally decreased with hyperpolarization (Fig. 7B). Note that in contrast to the voltage-dependence of the currents, their time-dependence varied considerably across cells.
Figure 7. Modeling the passive and active hyperpolarizing response.
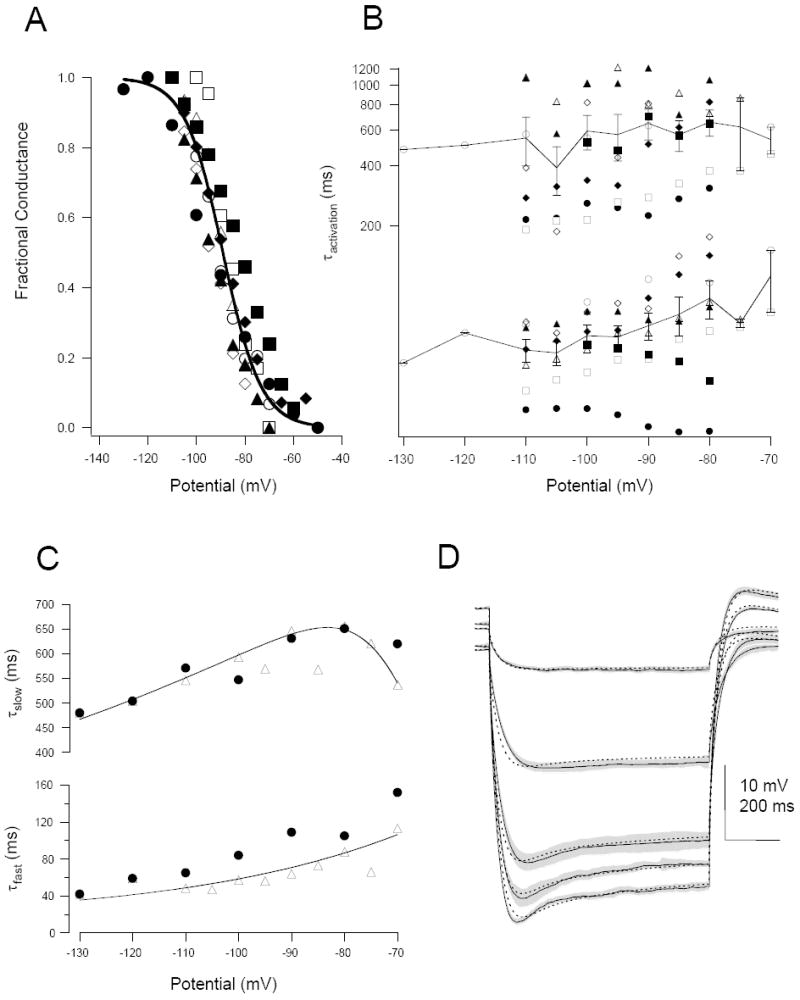
A: Boltzman relationship values determined from a pooled sample of eight cells where both current and voltage-clamp data were acquired. Half-maximal activation was -88.9 mV and the slope -7.9. B: Voltage-dependence of the fast (bottom) and slow (top) activation time constants for the same set of cells. Solid line is the mean (± SEM) for the pooled data set. C: Voltage-dependence of the activation time constants for cell 051206A (solid circles) compared to the average from the pooled data set (triangles). The solid curves are the fits obtained for the Hodgkin-Huxley equations. D: The membrane response to a family of experimentally-measured hyperpolarizing charging curves from a representative neuron (black trace; mean ± SD, grey trace) fit (see Methods) by the output of the computer model (dashed black trace).
To model the Ih conductance in the membrane, we used the activation and kinetic parameters from the pooled data set to calculate the activation time constants using Hodgkin-Huxley like equations (such as in the typical example of Figure 7C). The time constants calculated in this way were then used to carry out a simultaneous fit of 4-6 experimental traces for each cell, under different conditions of somatic current clamp (such as in the typical example of Fig. 7D). The density of the Ih conductance (gh) along the somatodendritic axis, as well as Rm, Cm and the current injected were chosen as free parameters. In addition, the distribution of Ih across the dendritic tree was allowed to be non-uniform, under the assumption that its density may increase linearly with distance from the soma (Santoro et al., 2004).
Table 1 presents the best-fit values for the passive and active properties of the model (constructed from a single prototypical morphology). The variance in Rm and Cm were consistent with that observed experimentally, described above. The large variance in gh suggests that the expression of these channels may differ significantly from cell to cell. Fits using the specific experimental values obtained for each cell, instead of the pooled data set, did not result in a significantly different error (not shown).
Table 1.
List of parameters obtained from the fit of the model, based on voltage-clamp measured Ih currents, with experimentally-measured current clamp voltage transients. Slope is the relative change in channel density compared to the soma. Error is the mean of the squared difference between the fit and experimental data.
| Cell | RN (MΩ) | τm (ms) | Rm (Ω·cm2) | Cm (μF/ cm2) | Ra (Ω·cm) | gh (nS/μm2) | Slope (μm-1) | Error (mV2) |
|---|---|---|---|---|---|---|---|---|
| 051206a | 136 | 40.6 | 35906 | 1.13 | 487 | 0.078 | 0.0075 | 1.70 |
| 051222a | 230 | 92.5 | 57808 | 1.6 | 1115 | 0.06 | 0.25 | 0.78 |
| 051229a | 160 | 93.6 | 43734 | 2.14 | 427 | 0.1 | 0.025 | 0.39 |
| 060109a | 122 | 34.3 | 30055 | 1.14 | 691 | 2.5 | 0.04 | 0.14 |
| 060112b | 92 | 42.1 | 20058 | 2.1 | 598 | 0.11 | 0.004 | 0.33 |
| 060117a | 44 | 13.3 | 10518 | 1.26 | 192 | 0.000035 | 1.16 | 0.29 |
| 060119a | 78 | 28.7 | 20777 | 1.38 | 170 | 0.013 | 0.86 | 0.88 |
| 060203a | 133 | 25.1 | 33132 | 0.76 | 460 | 0.0084 | 0.04 | 0.47 |
| Mean | 124 | 46 | 31498 | 1.44 | 517 | 0.36 | 0.30 | 0.62 |
| SD | 56 | 30 | 14890 | 0.48 | 301 | 0.87 | 0.45 | 0.50 |
Although the estimated somatodendritic distribution of Ih also had a large variance between cells, its values were not significantly different from zero, suggesting whether or not channel density significantly increases with distance from the soma (Santoro et al., 2004), it should have little if any effect on the general properties of the cell.
Ih shapes temporal summation
Given the large variance in the density of Ih across CA3 neurons, it is conceivable that in some cells synaptic integration might be affected by Ih in the dendrites. A well-described effect of the distal expression of Ih channels is the distance-dependent scaling of temporal summation (Magee, 1999; Fan et al., 2005). To study this response we compared a model with a large Ih density (1 pS/μm2) with another where Ih was blocked (representing the full range of Ih), measuring the magnitude of depolarization produced by varying frequencies of input at different distances from the soma. Note that the density of Ih was about 3-fold higher than the average somatic value found in the fittings but still 2.5 times lower than the highest value obtained (Table 1, cell 060112b), and about twice the value (at the soma) used to reproduce in a model the Ih effects in CA1 (Migliore et al., 2004). The effect of Ih shaping distal temporal summation is illustrated in Figure 8A where 100 Hz stimulation to a distal location (approximately 400 μm from the soma) temporally summates as measured at the soma. The density of the synaptic conductance was adjusted to achieve approximately a 0.5 mV response at the soma, consistent with experimental findings (German Barrionuevo, personal communication).
Figure 8. Distance-dependent equalization of temporal summation in a model CA3 neuron with a large Ih density.

A: Somatic response to a 100 Hz train of excitatory postsynaptic potentials (EPSPs) applied to the dendrites 365 μm from the soma with Ih channels included and not included in the model. Upper traces are to scale (single EPSPs for both conditions are shown as thin black and red lines) and the lower traces are normalized the amplitude of the first EPSP (arrow; thin lines represent single normalized EPSP for both conditions). B: Peak summation achieved by a distal input (top). Again, normalized summation is reported as the peak value relative to the amplitude of the first EPSP. Note the difference in the frequency-dependence of temporal summation when Ih was present in the model. At a single frequency (50 Hz), summation, again normalized to the first EPSP, in response to a 60 Hz train was affected by the presence of Ih in the model (bottom). Ih limited the effect of distance and thus equalizes the magnitude of temporal summation. C: Normalized temporal summation as a function of EPSP frequency and distance from the soma with (top) or without Ih (bottom) in the model.
Temporal summation was systematically studied by varying the frequency and location of the inputs (Fig. 8B). At distal locations the inhibitory effect of Ih channels was strongest at frequencies between 20-80 Hz. Using a frequency of 50 Hz, approximately the middle of the effective range, the location of the inputs was varied from the soma to the distal apical dendrites. In the model with Ih peak summation ranged from 1.6-2.0 (peak EPSP amplitude of the train normalized to the amplitude of the first EPSP), proximal to distal along the somatodendritic axis (slope = 0.5×10⁻³μm-1). In contrast, without Ih peak summation ranged from 2.1-3.1 and the slope of this relationship was more than doubled to 1.6×10⁻³μm-1. Thus the presence of Ih tends to equalize the amplitude of temporal summation when compared between distal and proximal inputs. This is further illustrated in Figure 8C where the normalized amplitude is plotted against both frequency and distance. When Ih channels are present the normalized amplitude runs nearly along the vertical axis (distance) between 20-80 Hz. In contrast, without Ih channels the normalized amplitudes run more diagonally within this frequency range.
Discussion
The primary finding of this study is that for pyramidal neurons in area CA3b the passive properties and Ih are expressed heterogeneously among cells. Additionally, since the activation of Ih occurs at potentials well below Vrest, little Ih conductance is active at rest. Moreover, its density is relatively low (a comparison with CA1 pyramidal cells is discussed below) and it is not enhanced in an activity-dependent manner, raising the possibility that it plays little role in dendritic synaptic integration. However, modeling of those cells with a relatively higher density of Ih suggests that these channels, if up-regulated, should be expected to affect temporal summation, in a manner similar to what is seen for CA1 pyramidal neurons. For example, if cyclic nucleotide levels are elevated (Wahl-Schott and Biel, 2008) in a cell-specific manner these channels could have a profound effect on dendritic integration.
The passive membrane properties of CA3b pyramidal neurons reported here were, on average, comparable to values measured in previous studies (Spruston and Johnston, 1992; Podlogar and Dietrich, 2006). However, parameters of RN and τm ranged nearly 5-fold among cells. Given the strong recurrent collateral system between CA3 pyramidal neurons, and when one considers inhibitory feedback circuits, it follows that these cells would generally need relatively higher membrane time constants to compensate for more intense synaptic bombardment (Destexhe and Pare, 1999). What is the advantage of heterogeneity among cells of the CA3 network? Although its generally thought that such variability introduces noise into a network decreasing performance, recent modeling studies, of other brain areas, suggest that it might be advantageous (Chelaru and Dragoi, 2008). Neuronal variability affecting the sensitivity of single neurons could impact the network as a whole (Shamir and Sompolinsky, 2006). In the hippocampus when theta oscillations of the field potential develop, a state that appears as synchronous network activity, pyramidal neurons exhibit distinct firing patterns suggesting that, individually, each neuron may be differentially tuned to network synaptic drive (Bland et al., 2005).
The subthreshold membrane response of these cells, in response to somatic current injection, was relatively linear at potentials ±10 mV of Vrest. It would be incorrect, however, to conclude that subthreshold synaptic integration should be linear as well. Indeed, Urban and Barrionuevo in two papers showed that EPSPs are shaped by the activation of subthreshold voltage-dependent Ca+, Na+, and transient K+ conductances (Urban and Barrionuevo, 1998; Urban et al., 1998). The easiest way to reconcile these observations with the linearity of the subthreshold response at the soma is that i) these channels are present at higher densities in the distal dendrites and ii) the local EPSP amplitude in the dendrites must be boosted by the local input impedance (Jaffe and Carnevale, 1999).
The lack or very minimal activation of Ih at rest, which in part contributes to the apparent linear response, is interesting especially when compared with CA1 pyramidal neurons. Immunohistochemical studies of HCN1 and HCN2 distribution in the hippocampus reveal that, compared to area CA1, the expression of these proteins in CA3 pyramidal neurons is significantly lower (Santoro et al., 2000; Shin and Chetkovich, 2007). This is consistent with our results as well as previous electrophysiological studies of Ih in CA3 pyramidal neurons where a significantly lower relative magnitude of “sag” and Ih has been reported (Major et al., 1994; Santoro et al., 2000; Vasilyev and Barish, 2002; Vasilyev and Barish, 2004). A prominent feature of Ih in area CA1 is its strong expression in the distal dendrites of pyramidal neurons (Santoro et al., 2000) that contributes to its distance-dependent effects, especially on temporal summation (Magee, 1999) and resonant dendrosomatic signal transfer (Narayanan and Johnston, 2007). It is not obvious from immunohistological analysis whether these channels also are expressed at a higher density in the distal dendrites of CA3 pyramidal cells (Lorincz et al., 2002; Notomi and Shigemoto, 2004; Santoro et al., 2004; Shin and Chetkovich, 2007). Our simulations suggest that because the density is so low, any contribution of a somatodendritic gradient of these channels would be minimal. Ih may still play a role under burst-firing or epileptiform conditions (Fisahn et al., 2002; Bender et al., 2005) when membrane potential could possibly swing below Vrest, due to the activation of slow Ca2+-activated K+ conductances.
In CA1 pyramidal neurons Ih channel expression is plastic and can be up-regulated in an activity-dependent manner (Fan et al., 2005; Brager and Johnston, 2007; Narayanan and Johnston, 2007; Shin and Chetkovich, 2007; Campanac and Debanne, 2008). Given that the density of Ih channels is generally low in CA3b pyramidal neurons we hypothesized that a small percentage increase in their density, triggered in an activity-dependent manner, might have a large effect on the membrane response. However, we found no such activity-dependent change in CA3b pyramidal neurons. It is possible that the mechanism that augments the density of Ih channels in CA1 cells also contributes to their plasticity, and that this same mechanism is lacking in CA3 pyramidal neurons. The density of Ih channels peaks approximately at postnatal day 5 in CA3 pyramidal neurons (Vasilyev and Barish, 2002) and during this developmental period Ih may be a more important factor with respect to network behavior (Agmon and Wells, 2003; Bender et al., 2005). In the adult, however, where the density is lower and the activation is shifted to more hyperpolarized potentials it appears that these channels would have less of an effect on network activity. Higher expression of Ih in the axons of CA3 pyramidal neurons and in CA3 inhibitory interneurons complicates dissecting out the role of these channels in adult neurons (Maccaferri and McBain, 1996; Soleng et al., 2004) and, in turn, their effect on the adult network.
In light of this complex scenario, it is the heterogeneity in the properties of cells within the network that is most intriguing; in particular, i) that the membrane time constant and input resistance vary by nearly 5-fold between cells and ii) Ih ranges from essentially zero to values close to those observed in the soma of CA1 pyramidal neurons (Migliore et al., 2004). We recently reported that different classes of firing properties expressed from cell-to-cell in CA3b pyramidal cells are not correlated with their passive properties, further adding to the complexity and intrinsic heterogeneity of the network (Hemond et al., 2008). Diversity within the nodes of a recurrent neural circuit generally works against its ability to synchronize (Wang and Buzsaki, 1996; White et al., 1998), but at the same time may enhance the number and variety of behaviors available to the network (Assisi et al., 2005).
Acknowledgments
This work was supported by CRCNS grant AG25633. We also thank the CINECA consortium (Bologna, Italy) for granting access to their parallel supercomputer systems.
List of Abbreviations
- aCSF
artificial cerebrospinal fluid
- RN
input resistance
- τm
membrane time constant
- Vrest
resting potential
- Rm
Specific membrane resistance
- Cm
Specific membrane capacitance
- TBS
theta-burst synaptic stimulation
- TBF
theta burst firing
Footnotes
Publisher's Disclaimer: This is a PDF file of an unedited manuscript that has been accepted for publication. As a service to our customers we are providing this early version of the manuscript. The manuscript will undergo copyediting, typesetting, and review of the resulting proof before it is published in its final citable form. Please note that during the production process errors may be discovered which could affect the content, and all legal disclaimers that apply to the journal pertain.
References
- Agmon A, Wells JE. The role of the hyperpolarization-activated cationic current I(h) in the timing of interictal bursts in the neonatal hippocampus. J Neurosci. 2003;23:3658–3668. doi: 10.1523/JNEUROSCI.23-09-03658.2003. [DOI] [PMC free article] [PubMed] [Google Scholar]
- Ascoli GA. Mobilizing the base of neuroscience data: the case of neuronal morphologies. Nat Rev Neurosci. 2006;7:318–324. doi: 10.1038/nrn1885. [DOI] [PubMed] [Google Scholar]
- Assisi CG, Jirsa VK, Kelso JA. Synchrony and clustering in heterogeneous networks with global coupling and parameter dispersion. Phys Rev Lett. 2005;94:018106. doi: 10.1103/PhysRevLett.94.018106. [DOI] [PubMed] [Google Scholar]
- Bender RA, Galindo R, Mameli M, Gonzalez-Vega R, Valenzuela CF, Baram TZ. Synchronized network activity in developing rat hippocampus involves regional hyperpolarization-activated cyclic nucleotide-gated (HCN) channel function. Eur J Neurosci. 2005;22:2669–2674. doi: 10.1111/j.1460-9568.2005.04407.x. [DOI] [PMC free article] [PubMed] [Google Scholar]
- Bland BH, Konopacki J, Dyck R. Heterogeneity among hippocampal pyramidal neurons revealed by their relation to theta-band oscillation and synchrony. Exp Neurol. 2005;195:458–474. doi: 10.1016/j.expneurol.2005.06.007. [DOI] [PubMed] [Google Scholar]
- Brager DH, Johnston D. Plasticity of intrinsic excitability during long-term depression is mediated through mGluR-dependent changes in I(h) in hippocampal CA1 pyramidal neurons. J Neurosci. 2007;27:13926–13937. doi: 10.1523/JNEUROSCI.3520-07.2007. [DOI] [PMC free article] [PubMed] [Google Scholar]
- Campanac E, Debanne D. Spike timing-dependent plasticity: a learning rule for dendritic integration in rat CA1 pyramidal neurons. J Physiol. 2008;586:779–793. doi: 10.1113/jphysiol.2007.147017. [DOI] [PMC free article] [PubMed] [Google Scholar]
- Chelaru MI, Dragoi V. Efficient coding in heterogeneous neuronal populations. Proc Natl Acad Sci U S A. 2008;105:16344–16349. doi: 10.1073/pnas.0807744105. [DOI] [PMC free article] [PubMed] [Google Scholar]
- Destexhe A, Pare D. Impact of network activity on the integrative properties of neocortical pyramidal neurons in vivo. J Neurophysiol. 1999;81:1531–1547. doi: 10.1152/jn.1999.81.4.1531. [DOI] [PubMed] [Google Scholar]
- Fan Y, Fricker D, Brager DH, Chen X, Lu HC, Chitwood RA, Johnston D. Activity-dependent decrease of excitability in rat hippocampal neurons through increases in I(h) Nat Neurosci. 2005;8:1542–1551. doi: 10.1038/nn1568. [DOI] [PubMed] [Google Scholar]
- Fisahn A, Yamada M, Duttaroy A, Gan JW, Deng CX, McBain CJ, Wess J. Muscarinic induction of hippocampal gamma oscillations requires coupling of the M1 receptor to two mixed cation currents. Neuron. 2002;33:615–624. doi: 10.1016/s0896-6273(02)00587-1. [DOI] [PubMed] [Google Scholar]
- Hausser M, Mel B. Dendrites: bug or feature? Curr Opin Neurobiol. 2003;13:372–383. doi: 10.1016/s0959-4388(03)00075-8. [DOI] [PubMed] [Google Scholar]
- Hemond P, Epstein D, Boley A, Migliore M, Ascoli GA, Jaffe DB. Distinct classes of pyramidal cells exhibit mutually exclusive firing patterns in hippocampal area CA3b. Hippocampus. 2008;18:411–424. doi: 10.1002/hipo.20404. [DOI] [PMC free article] [PubMed] [Google Scholar]
- Hines ML, Carnevale NT. The NEURON simulation environment. Neural Comput. 1997;9:1179–1209. doi: 10.1162/neco.1997.9.6.1179. [DOI] [PubMed] [Google Scholar]
- Hu H, Vervaeke K, Storm JF. Two forms of electrical resonance at theta frequencies, generated by M-current, h-current and persistent Na+ current in rat hippocampal pyramidal cells. J Physiol. 2002;545:783–805. doi: 10.1113/jphysiol.2002.029249. [DOI] [PMC free article] [PubMed] [Google Scholar]
- Jaffe DB, Carnevale NT. Passive normalization of synaptic integration influenced by dendritic architecture. J Neurophysiol. 1999;82:3268–3285. doi: 10.1152/jn.1999.82.6.3268. [DOI] [PubMed] [Google Scholar]
- Johnston D, Narayanan R. Active dendrites: colorful wings of the mysterious butterflies. Trends Neurosci. 2008;31:309–316. doi: 10.1016/j.tins.2008.03.004. [DOI] [PubMed] [Google Scholar]
- Krichmar JL, Nasuto SJ, Scorcioni R, Washington SD, Ascoli GA. Effects of dendritic morphology on CA3 pyramidal cell electrophysiology: a simulation study. Brain Res. 2002;941:11–28. doi: 10.1016/s0006-8993(02)02488-5. [DOI] [PubMed] [Google Scholar]
- Lorincz A, Notomi T, Tamas G, Shigemoto R, Nusser Z. Polarized and compartment-dependent distribution of HCN1 in pyramidal cell dendrites. Nat Neurosci. 2002;5:1185–1193. doi: 10.1038/nn962. [DOI] [PubMed] [Google Scholar]
- Maccaferri G, McBain CJ. The hyperpolarization-activated current (Ih) and its contribution to pacemaker activity in rat CA1 hippocampal stratum oriens-alveus interneurones. J Physiol. 1996;497(Pt 1):119–130. doi: 10.1113/jphysiol.1996.sp021754. [DOI] [PMC free article] [PubMed] [Google Scholar]
- Magee JC. Dendritic hyperpolarization-activated currents modify the integrative properties of hippocampal CA1 pyramidal neurons. J Neurosci. 1998;18:7613–7624. doi: 10.1523/JNEUROSCI.18-19-07613.1998. [DOI] [PMC free article] [PubMed] [Google Scholar]
- Magee JC. Dendritic lh normalizes temporal summation in hippocampal CA1 neurons. Nat Neurosci. 1999;2:508–514. doi: 10.1038/9158. [DOI] [PubMed] [Google Scholar]
- Major G, Larkman AU, Jonas P, Sakmann B, Jack JJ. Detailed passive cable models of whole-cell recorded CA3 pyramidal neurons in rat hippocampal slices. J Neurosci. 1994;14:4613–4638. doi: 10.1523/JNEUROSCI.14-08-04613.1994. [DOI] [PMC free article] [PubMed] [Google Scholar]
- Manuel M, Meunier C, Donnet M, Zytnicki D. Resonant or not, two amplification modes of proprioceptive inputs by persistent inward currents in spinal motoneurons. J Neurosci. 2007;27:12977–12988. doi: 10.1523/JNEUROSCI.3299-07.2007. [DOI] [PMC free article] [PubMed] [Google Scholar]
- Masukawa LM, Benardo LS, Prince DA. Variations in electrophysiological properties of hippocampal neurons in different subfields. Brain Res. 1982;242:341–344. doi: 10.1016/0006-8993(82)90320-1. [DOI] [PubMed] [Google Scholar]
- Migliore M, Messineo L, Ferrante M. Dendritic Ih selectively blocks temporal summation of unsynchronized sistal inputs in CA1 pyramidal neurons. J Comput Neurosci. 2004;16:5–13. doi: 10.1023/b:jcns.0000004837.81595.b0. [DOI] [PubMed] [Google Scholar]
- Narayanan R, Johnston D. Long-term potentiation in rat hippocampal neurons is accompanied by spatially widespread changes in intrinsic oscillatory dynamics and excitability. Neuron. 2007;56:1061–1075. doi: 10.1016/j.neuron.2007.10.033. [DOI] [PMC free article] [PubMed] [Google Scholar]
- Narayanan R, Johnston D. The h channel mediates location dependence and plasticity of intrinsic phase response in rat hippocampal neurons. J Neurosci. 2008;28:5846–5850. doi: 10.1523/JNEUROSCI.0835-08.2008. [DOI] [PMC free article] [PubMed] [Google Scholar]
- Notomi T, Shigemoto R. Immunohistochemical localization of Ih channel subunits, HCN1-4, in the rat brain. J Comp Neurol. 2004;471:241–276. doi: 10.1002/cne.11039. [DOI] [PubMed] [Google Scholar]
- Pape HC. Queer current and pacemaker: the hyperpolarization-activated cation current in neurons. Annu Rev Physiol. 1996;58:299–327. doi: 10.1146/annurev.ph.58.030196.001503. [DOI] [PubMed] [Google Scholar]
- Podlogar M, Dietrich D. Firing pattern of rat hippocampal neurons: a perforated patch clamp study. Brain Res. 2006;1085:95–101. doi: 10.1016/j.brainres.2006.02.050. [DOI] [PubMed] [Google Scholar]
- Santoro B, Chen S, Luthi A, Pavlidis P, Shumyatsky GP, Tibbs GR, Siegelbaum SA. Molecular and functional heterogeneity of hyperpolarization-activated pacemaker channels in the mouse CNS. J Neurosci. 2000;20:5264–5275. doi: 10.1523/JNEUROSCI.20-14-05264.2000. [DOI] [PMC free article] [PubMed] [Google Scholar]
- Santoro B, Wainger BJ, Siegelbaum SA. Regulation of HCN channel surface expression by a novel C-terminal protein-protein interaction. J Neurosci. 2004;24:10750–10762. doi: 10.1523/JNEUROSCI.3300-04.2004. [DOI] [PMC free article] [PubMed] [Google Scholar]
- Scharfman HE. Spiny neurons of area CA3c in rat hippocampal slices have similar electrophysiological characteristics and synaptic responses despite morphological variation. Hippocampus. 1993;3:9–28. doi: 10.1002/hipo.450030103. [DOI] [PubMed] [Google Scholar]
- Shamir M, Sompolinsky H. Implications of neuronal diversity on population coding. Neural Comput. 2006;18:1951–1986. doi: 10.1162/neco.2006.18.8.1951. [DOI] [PubMed] [Google Scholar]
- Shin M, Chetkovich DM. Activity-dependent regulation of h channel distribution in hippocampal CA1 pyramidal neurons. J Biol Chem. 2007;282:33168–33180. doi: 10.1074/jbc.M703736200. [DOI] [PMC free article] [PubMed] [Google Scholar]
- Soleng AF, Baginskas A, Andersen P, Raastad M. Activity-dependent excitability changes in hippocampal CA3 cell Schaffer axons. J Physiol. 2004;560:491–503. doi: 10.1113/jphysiol.2004.071225. [DOI] [PMC free article] [PubMed] [Google Scholar]
- Spruston N, Johnston D. Perforated patch-clamp analysis of the passive membrane properties of three classes of hippocampal neurons. J Neurophysiol. 1992;67:508–529. doi: 10.1152/jn.1992.67.3.508. [DOI] [PubMed] [Google Scholar]
- Urban NN, Barrionuevo G. Active summation of excitatory postsynaptic potentials in hippocampal CA3 pyramidal neurons. Proc Natl Acad Sci U S A. 1998;95:11450–11455. doi: 10.1073/pnas.95.19.11450. [DOI] [PMC free article] [PubMed] [Google Scholar]
- Urban NN, Henze DA, Barrionuevo G. Amplification of perforant-path EPSPs in CA3 pyramidal cells by LVA calcium and sodium channels. J Neurophysiol. 1998;80:1558–1561. doi: 10.1152/jn.1998.80.3.1558. [DOI] [PubMed] [Google Scholar]
- Vasilyev DV, Barish ME. Postnatal development of the hyperpolarization-activated excitatory current Ih in mouse hippocampal pyramidal neurons. J Neurosci. 2002;22:8992–9004. doi: 10.1523/JNEUROSCI.22-20-08992.2002. [DOI] [PMC free article] [PubMed] [Google Scholar]
- Vasilyev DV, Barish ME. Regulation of the hyperpolarization-activated cationic current Ih in mouse hippocampal pyramidal neurones by vitronectin, a component of extracellular matrix. J Physiol. 2004;560:659–675. doi: 10.1113/jphysiol.2004.069104. [DOI] [PMC free article] [PubMed] [Google Scholar]
- Wahl-Schott C, Biel M. HCN channels: Structure, cellular regulation and physiological function. Cell Mol Life Sci. 2008 doi: 10.1007/s00018-008-8525-0. [DOI] [PMC free article] [PubMed] [Google Scholar]
- Wang XJ, Buzsaki G. Gamma oscillation by synaptic inhibition in a hippocampal interneuronal network model. J Neurosci. 1996;16:6402–6413. doi: 10.1523/JNEUROSCI.16-20-06402.1996. [DOI] [PMC free article] [PubMed] [Google Scholar]
- White JA, Chow CC, Ritt J, Soto-Trevino C, Kopell N. Synchronization and oscillatory dynamics in heterogeneous, mutually inhibited neurons. J Comput Neurosci. 1998;5:5–16. doi: 10.1023/a:1008841325921. [DOI] [PubMed] [Google Scholar]
- Williams SR, Stuart GJ. Role of dendritic synapse location in the control of action potential output. Trends Neurosci. 2003;26:147–154. doi: 10.1016/S0166-2236(03)00035-3. [DOI] [PubMed] [Google Scholar]
- Wilson CJ. Cellular mechanisms controlling the strength of synapses. J Electron Microsc Tech. 1988;10:293–313. doi: 10.1002/jemt.1060100307. [DOI] [PubMed] [Google Scholar]