Abstract
Myocardial edema can arise in several disease states. MRI contrast agent can accumulate in edematous tissue, which complicates differential diagnosis with contrast-enhanced (CE)-MRI and might lead to overestimation of infarct size. Sodium Chemical Shift Imaging (23Na-CSI) may provide an alternative for edema imaging. We have developed a non-infarct, isolated rat heart model with two levels of edema, which was studied with 23Na-CSI and CE-MRI. In edematous, but viable tissue the extracellular sodium (Na+e) signal is hypothesized to increase, but not the intracellular sodium (Na+i) signal. Isolated hearts were perfused at 60 (n = 6) and 140 mmHg (n = 5). Dimethyl methylphosphonate (DMMP) and phenylphosphonate (PPA) were used to follow edema formation by 31P-MR Spectroscopy. In separate groups, Thulium(III)1,4,7,10 tetraazacyclododecane-N,N′,N″,N′′′-tetra(methylenephosphonate) (TmDOTP5−) and Gadovist were used for 23Na-CSI (n = 8) and CE-MRI (n = 6), respectively. PPA normalized signal intensity (SI) was higher at 140 versus 60 mmHg, with a ratio of 1.27 ± 0.12 (p < 0.05). The (DMMP-PPA)/dry weight ratio, as a marker of intracellular volume, remained unchanged. The mid-heart cross sectional area (CSA) of the left ventricle (LV) was significantly increased at 140 mmHg. In addition, at 140 mmHg, the LV Na+e SI increased with a 140 mmHg/60 mmHg ratio of 1.24 ± 0.18 (p < 0.05). Na+i SI remained essentially unchanged. With CE-MRI, a subendocardially enhanced CSA was identified, increasing from 0.20 ± 0.02 cm2 at 60 mmHg to 0.31 ± 0.02 cm2 at 140 mmHg (p < 0.05). Edema shows up in both CE-MRI and Na+e. High perfusion pressure causes more edema subendocardially than subepicardially. 23Na-CSI is an attractive alternative for imaging of edema and is a promising tool to discriminate between edema, acute and chronic MI.
Keywords: Myocardial edema, Hypertension, 23Na CSI, CE MRI, Endocardial enhancement
Introduction
Myocardial interstitial edema can arise in several disease states or following clinical interventions, including myocardial ischemia and infarction [1–11], arterial [12] and pulmonary hypertension [13], myocarditis [14], cardio-pulmonary bypass and cardioplegic arrest [15] and cardiac transplantation [16]. The causes of edema may vary: in patients with hypertension, differences in hydrostatic pressure may dominate, whereas in patients with coronary artery disease, differences in osmotic pressure and microvascular permeability are probably more important [17]. 1H-based MRI methods such as contrast-enhanced (CE)-MRI and T2-weighted MRI are valuable tools to assess injured myocardium. Indeed, CE-MRI has become the gold standard to delineate chronic myocardial infarction [18, 19]. However, the accuracy of CE-MRI to delineate acute myocardial infarction has been questioned because of the accumulation of contrast agent in the expanded extracellular compartment of both infarct and peri-infarct regions [1–4, 14]. Apparently, in this phase CE-MRI much resembles T2-weighted MRI, which has shown great promise to delineate the area at risk (AAR) and to quantify myocardial salvage in patients with acute coronary syndromes after events related to the formation of edema [5–11]. However, both these methods depend on relative regional differences in myocardial signal intensity and are perhaps less suitable to identify globally edematous tissue associated with any of the other disease states mentioned above, such as hypertension or myocarditis.
An alternative approach to assess myocardial edema is imaging of myocardial sodium with 23Na-MRI, since we expect the extracellular sodium (Na+e) signal to increase with increasing interstitial edema because of the expansion of the extracellular space. In a number of studies an elevated total sodium (Na+t) signal has been observed after myocardial infarction, both in humans and animals [19–22] Particularly, imaging intra- (Na+i) and extra- (Na+e) cellular sodium separately can provide more precise information to assess the sodium gradient and cell membrane integrity [23]. This can be achieved with chemical shift imaging (23Na-CSI) in combination with a paramagnetic chemical shift agent to separate Na+i from Na+e signals [23, 24].
We hypothesize that, in viable tissue with cell membranes still intact but with a high level of extracellular edema, Na+i signal intensity is normal because viable cells should be able to maintain a normal Na+ gradient and a normal intracellular volume, whereas Na+e and CE-MRI signal intensities will be increased because of the larger extracellular space. To characterize edema independent from ischemia, this study consisted of two parts. First, using phosphorus-31 magnetic resonance spectroscopy (31P MRS), we developed an isolated heart model with two levels of extracellular edema based on crystalloid perfusion at different pressures. Secondly, we aimed to characterize edema in non-ischemic myocardial tissue with CE-MRI and 23Na-CSI.
Methods
Animal and heart preparation
Male Wistar rats (n = 25, body weight = 300–350 g) were anesthetized with isoflurane inhalation and given heparin (500 IU/Kg i.v.). Subsequently, the hearts were rapidly excised and placed in modified, ice-cold Krebs-Henseleit (KH) buffer. After cannulation of the aorta, perfusion was initiated according to Langendorff at a constant pressure (60 mmHg) with KH at 37 °C. To further prepare the heart, a drain was inserted through the apex via the mitral valve to remove Thebesian flow. A latex balloon was inserted into the left ventricle through the mitral valve and filled with water to reach a left ventricular end-diastolic pressure (LVEDP) of 7.5 mmHg. Two pressure transducers (MP-15, Micron Instruments) were used to monitor perfusion pressure and to measure the isovolumic contractile pressure of the left ventricle via the inserted balloon. Left ventricular developed pressure (LVPD) was determined as the difference between left ventricular systolic pressure (LVSP) and LVEDP. To maintain a heart rate of 300 beats/min, the outflow tract of the right ventricle was connected with two copper-wire electrodes to a (4–7 V, 0.5 ms) stimulator (model S88, Grass Instruments, Quincey, MA, USA). Heart rate was determined from the pressure curve. Coronary flow was measured with a flow probe (Skalar instruments, Delft, The Netherlands). The data were recorded with a PowerLab Data Acquisition System (ADI Instruments, Australia). Hearts were placed in a 20-mm-diameter NMR tube and positioned inside the MR scanner. The experimental protocol was in accordance with the guidelines of the Committee for Animal Experiments of the University Medical Center Utrecht, The Netherlands.
Perfusion solutions
The modified KH buffer contained (in mmol/L): 119.0 NaCl, 4.7 KCl, 1.0 MgCl2, 24.0 NaHCO3, 1.3 CaCl2, 11.0 glucose, and 5.0 Na-pyruvate. Before perfusion, the KH buffer was filtered through 8 μm (Millipore, Bedford, MA) filters. The solution was equilibrated with 95 % O2 and 5 % CO2, resulting in a pH of 7.4 at 37 °C, prior to the addition of the CaCl2. For 31P-MRS, we included in the buffer 10 mM dimethyl methylphosphonate (DMMP), which distributes evenly in intra- and extracellular spaces, as a marker of total water space and 10 mM phenylphosphonate (PPA), which is non-permeant, as an extracellular space marker [25]. In the 31P spectra, the DMMP and PPA signals can be easily discriminated from endogenous phosphate signals. The difference between DMMP and PPA signals was calculated to determine the intracellular space. After preparations, hearts were allowed to stabilize at 60 mmHg. For 23Na-CSI, Thulium(III)1,4,7,10 tetraazacyclododecane-N,N′,N″,N′′′-tetra(methylenephosphonate) (TmDOTP5−, 3.5 mM) [26] was included in the buffer as a shift reagent (SR), to separate intra and extra-cellular Na+ signals. TmDOTP5− is also non-permeant and therefore only interacts with Na+e, causing a shift in resonance frequency and leaving the Na+i resonance at its original frequency.
To correct for Ca2+ binding by the shift reagent, the total Ca2+ added to the buffer was increased to 3.42 mM, which resulted in a free [Ca2+] of 0.85 mmol/L as measured by a HI 4004-51 Ca2+ Ion Selective Electrode (ISE) connected to a pH/ISE meter (HI 3221, Hanna instruments). For CE-MRI scans, 1.3 mM Gadobutrol (Gadovist, Bayer Schering Pharma AG, Berlin, Germany) was included in the buffer.
Modification of Langendorff set up
Usually, we aspirate the effluent from a level above the heart to keep the hearts submerged for better magnetic susceptibility matching. However, the effluent generates unwanted extra-cardiac 23Na and 31P signals. Two approaches were used to reduce these unwanted signals. For the 31P-MRS study, the effluent was removed from the bottom of the NMR tube, sacrificing the susceptibility matching. For the 23Na-CSI study, an additional perfusion line ending at the bottom of the tube was used to flush the tube at a rate of 30 ml/min with a buffer in which Na+ was replaced by Li+. In this case, the hearts were kept submerged.
MRS and MRI protocols
A vertical 9.4 T, 89 mm diameter bore scanner was used, equipped with a 1,500 mT/m gradient system, which was interfaced with an AVANCE 400 DRX spectrometer (Bruker, Germany). All heart preparation including coil tuning and matching and optimization of magnetic field homogeneity was performed at a perfusion pressure of 60 mmHg and took 30–34 min as indicated in Fig. 1.
Fig. 1.
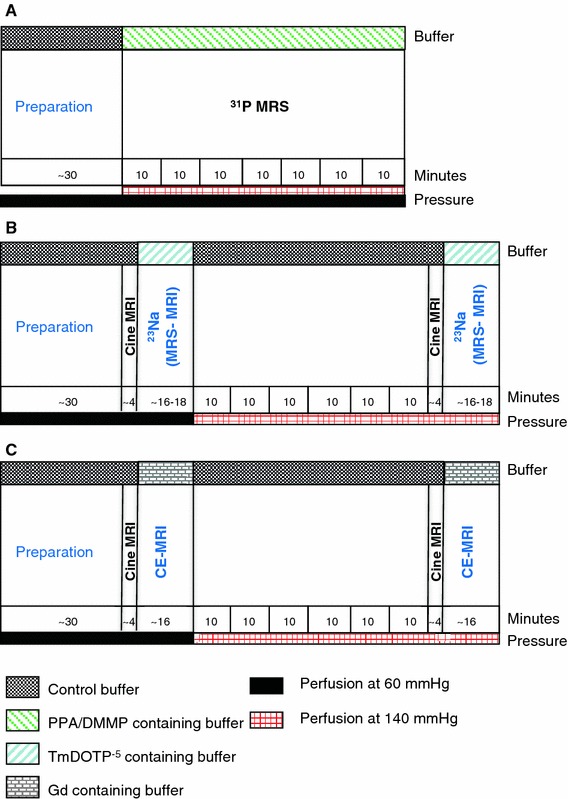
Schematic representation of experimental protocols. a 31P-MRS, b 23Na-chemical shift imaging (23Na-CSI), c contrast-enhanced MRI (CE-MRI)
31P-MRS
Phosphorus spectroscopy was performed with a 20 mm multi-nuclear probehead (Bruker, Germany). 31P spectra were acquired for 10 min by accumulation of 32 consecutive free induction decays (FIDs) following 90° pulses, using 2,048 data points and 12.9 kHz spectral width (SW). Pulse repetition time was 18.75 s to achieve a fully T1 relaxed signal.
CE-MRI and 23Na-CSI
The imaging protocol consisted of the following steps. First, 2- and 4-chamber view scout scans were obtained with a 1H 20-mm-diameter birdcage coil (Bruker, Germany) to plan a single mid-ventricular short-axis slice. Next, cine imaging was performed with a self-gated gradient-echo sequence (TE = 1.9 ms, TR = 5.2 ms, number of movie frames = 15, slice thickness = 2.5 mm, matrix = 256 × 256, field of view (FOV) = 2 × 2 cm2). Gated CE-MRI scans were performed with T1-weighted short-axis multi-slice FLASH sequence, with the following parameters: TR = 63 ms, TE = 2.8 ms, FA = 75°, NA = 8, 6 slices of 2.5 mm, matrix = 256 × 256, FOV = 2 × 2 cm2. To monitor the arrival of Gd containing buffer, eight serial CE-MRI scans were performed. The last scan in this series was used for edema analysis.
For 23Na-CSI, the 1H birdcage coil was replaced with a 23Na 20-mm-diameter birdcage coil (Bruker, Germany). To verify the heart position, scout images were obtained and subsequently a 5 mm mid-axial ventricular slice was acquired as a reference image with a 23Na self-gated FLASH sequence (TE = 2.4 ms, TR = 25 ms and 128 repetitions, 50° FA and SW = 7,714 Hz, matrix = 32 × 32 and FOV = 2 × 2 cm2). To monitor the shift of Na+e after switching to the TmDOTP containing buffer, 23Na MR spectra were acquired with a 75° pulse, SW = 5.5 kHz, TR = 105 ms, and 512 data points. Subsequently, acquisition weighted 2D-23Na CSI was performed with the following parameters: 10,000 acquisitions, number of averages (NA) in center of k-space = 55, TR = 30 ms, 90° 0.5 ms sinc pulse, BW = 12,420 Hz, FOV = 2 × 2 cm2, matrix = 16 × 16 and reconstruction matrix = 32 × 32. FIDs were collected with 128 complex data points and 100.8 μs dwell time resulting in an acquisition time of 25.8 ms/FID. Gradient switching resulted in an acquisition delay of 0.91 ms.
Experimental protocol
Two studies were performed. First, we used 31P-MRS to monitor the formation of edema in 2 groups of isolated hearts. Secondly, edema was characterized with CE-MRI and 23Na-CSI. Schematic diagrams of the experimental protocols for the 2 studies are shown in Fig. 1.
31P-MRS group
After preparing the heart at 60 mmHg perfusion pressure, hearts were continuously perfused with PPA/DMMP-containing buffer for 70 min (Fig. 1a) either at 60 mmHg, n = 6 or at 140 mmHg, n = 5, to induce different levels of edema. As depicted in Fig. 1a, 31P MR spectra were acquired as an average over 10 min to track the change of PPA and DMPP signals and to measure the extent of extra-cellular edema during these 70 min of perfusion.
23Na-CSI group
Hearts (n = 8) were perfused at 60 mmHg and subsequently at 140 mmHg for 60 min (Fig. 1b). After stabilization of the isolated hearts at 60 mmHg, 1H scout images were acquired followed by 2- and 4-chamber cine MRI. Thereafter, a cine scan was acquired for a mid-axial slice. Subsequently, the hearts were perfused with buffer containing SR and 23Na spectra were acquired to monitor the arrival of buffer containing SR. 23Na scout images were obtained to verify the anatomical position of the heart. Then a reference image of a mid-axial slice was acquired, followed by CSI of the same slice. The same scan protocol was repeated after 60 min of perfusion at 140 mmHg.
CE-MRI group
Hearts (n = 6) were perfused at 60 mmHg (Fig. 1c) and subsequently at 140 mmHg for 60 min. After stabilization of the isolated hearts at 60 mmHg, 1H scout images were acquired, followed by 2-chamber and 4-chamber cine MRI. Next, a cine scan was acquired for a mid axial slice. Subsequently, the hearts were perfused with buffer containing Gadovist. Eight serial CE-MR scans were acquired every 2 min at 60 mmHg to monitor the arrival of Gadovist containing buffer. The same MR scan protocol was repeated after 60 min of perfusion at 140 mmHg.
Data analysis
For 31P-MRS, all spectra were analyzed with jMRUI 4.0 software. After a polynomial baseline correction, the spectra were fitted with AMARES, a time-domain based fitting algorithm. The 23Na-CSI data were zero-filled in both the spatial and spectral domain resulting in a 256 × 64 × 64 reconstruction size. To optimize peak separation a Lorentzian-Gaussian multiplication was applied. Epi- and endocardial contours of the left ventricle were manually drawn on end-diastolic 1H images to calculate the left ventricular cross sectional area (CSA). Subsequently, these contours were copied to the 23Na-CSI images, to determine the Na+e and Na+i average signal intensities of the entire left ventricle. For CE-MRI, Epi- and endo-cardial LV contours were drawn on the 1H axial cine images and then copied to CE-MR images. Subsequently, the CSA of the hyperenhanced areas were delineated manually. The CSA and the signal intensities of both the entire LV myocardium and the hyperenhanced areas were determined with Bruker Paravision 4 software.
Tissue water content
At the end of the MRI measurements, the hearts were cut open and blotted dry with a soft tissue. The hearts were then weighed to determine their wet weights. Subsequently, the dry weights of the hearts were measured after desiccation in an oven at 50 °C for 48 h. The wet/dry (W/D) weights of the isolated rat hearts were then determined.
Statistical analysis
Results were expressed as mean ± standard error of the mean for each group of animals. A paired t test was performed to compare mean values for each time point post perfusion. Results were considered significantly different for a two-tailed p value of less than 0.05. The correlation test of PPA values against W/D ratios was performed using a Pearson correlation with two-tailed p values.
Results
31P-MRS
The addition of PPA and DMMP to the perfusate and the non-submerged state of the heart did not affect the stability of the heart, in terms of steady heart rate and coronary flow. The “dry” setup reduced the shimming quality as expected. The coronary flow was 24.0 ± 0.5 ml/min for the 140 mmHg group and 9.9 ± 0.4 ml/min for the 60 mmHg group.
Figure 2 shows examples of 31P MR spectra of an isolated rat heart (Fig. 2a) still submerged in the NMR tube and (Fig. 2b) after the effluent was removed from the bottom of the tube, both during perfusion with perfusate containing PPA and DMMP. Figure 3a summarizes the PPA signal intensities normalized by heart dry weight (PPA/dry weight), whereas Fig. 3b depicts the difference between DMMP and PPA signal intensities normalized by heart dry weight [(DMMP-PPA)/dry weight], both as function of time for the 60 and 140 mmHg groups. Ten minutes after switching to the phosphonates-containing buffer, PPA/dry weight was 30.6 ± 3.2 and 34.7 ± 2.7 for 60 and 140 mmHg, respectively. From 50 min onward, PPA/dry weight differences between the 60 and 140 mmHg group were significant (p < 0.05). After 70 min PPA/dry weight was 51.5 ± 4.5 at 140 mmHg versus 40.6 ± 1.4 at 60 mmHg, with a 140 mmHg/60 mmHg ratio of 1.27 ± 0.12. The calculated (DMMP-PPA)/dry weight, as a marker for the intracellular space, remained at approximately baseline values (29.9 ± 2.1) during the entire perfusion period for both groups.
Fig. 2.
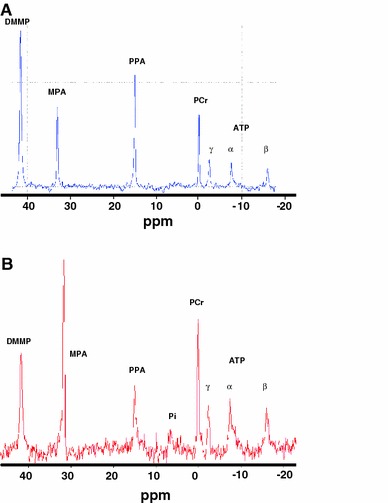
Typical examples of 31P-MRS spectra of an isolated rat heart, a while the heart is submerged in buffer and b after removing the effluent. The signal of the three phosphate groups of ATP, phosphocreatine (PCr), phenylphosphonate (PPA) as extracellular space marker, methylphosphonate (MPA), a solution in a small glass capillary as a reference, and dimethyl methylphosphonate (DMMP) as a marker of total water space are pointed out. MPA reference volume in (b) was different from that in (a)
Fig. 3.
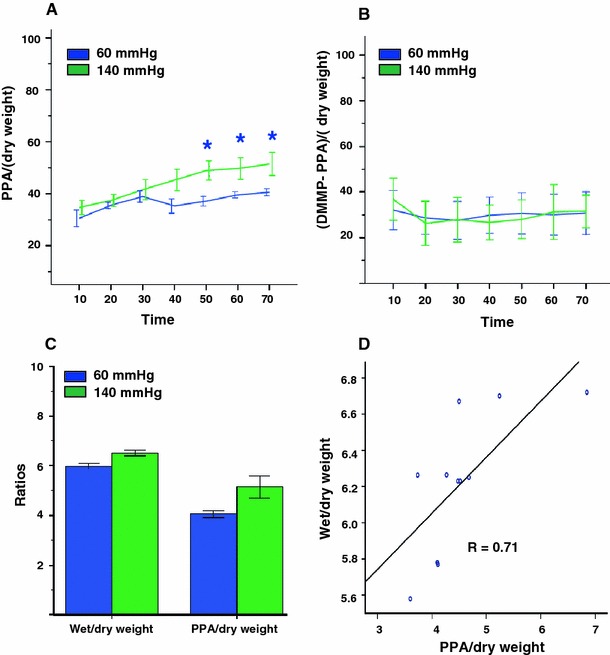
31P-MRS data on extra- and intracellular space markers and heart wet/dry weights from isolated rat hearts perfused at 60 and 140 mmHg. a PPA/heart dry weight as a function of time. b (DMMP-PPA)/heart dry weight as a function of time. c Normalized heart wet/dry and PPA/heart dry weight ratios 70 min after switching to the phosphonates containing buffer. d Heart wet/dry weight ratio versus PPA/heart dry weight ratio
The higher level of edema, deduced from a larger PPA signal at 140 mmHg, was corroborated by an increase in heart wet/dry weight ratio (W/D) of the 140 mmHg group in comparison to the 60 mmHg group (Fig. 3c, 6.5 ± 0.1 vs. 6.0 ± 0.1, respectively, p = 0.05). Moreover, a positive, significant correlation was found between W/D and PPA/dry weight (Fig. 3d, Pearson correlation coefficient 0.71, p = 0.02).
23Na-CSI
Baseline cine MRI and 23Na-MRI were performed at 60 mmHg perfusion pressure, after which the perfusion pressure was increased to 140 mmHg (Fig. 1b). The hearts remained stable during perfusion with SR (TmDOTP). However, immediately after switching to SR-containing buffer, the hearts left ventricular developed pressure (LVDP) dropped from 60.0 ± 4.0 mmHg to 34.0 ± 4.3 (p < 0.05) at 60 mmHg and from 99.4 ± 6.5 to 48.0 ± 4.3 mmHg (p < 0.05) at 140 mmHg as a result of the reduction of the free Ca2+ concentration due to the affinity of the shift reagent to Ca2+ [26]. During perfusion with SR-containing buffer, two 23Na peaks were observed in the acquired spectra (Fig. 4). A large peak downshifted by 2.2 ± 0.2 ppm corresponding to Na+e and mainly representing signal from the vasculature and interstitium, and the Na+i intracellular sodium peak at 0 ppm. Similar Na+i and Na+e peaks were seen in the localized spectra of the CSI data.
Fig. 4.
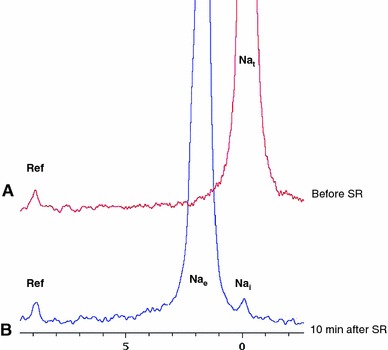
23Na-NMR spectra acquired with control buffer (a) and with shift reagent (SR) TmDOTP containing buffer. In the absence of TmDOTP (control buffer, a), the on-resonance was seen at 0 ppm. After 10 min of continuous perfusion with TmDOTP, Na+e peak was separated from Na+i peak. Reference: a small glass capillary, which contained a known amount of TmDOTP
Figure 5 shows 1H longitudinal and axial views of an isolated rat heart and corresponding Na+e and Na+i images at 60 and 140 mmHg. The balloon in the left ventricle was filled with Na+-free solution and therefore appeared dark in 23Na-CSI images. The right ventricular cavity had very high signal intensity, because it was filled with Na+-containing effluent. The Na+i images were of considerable lower intensity than the Na+e images because of the lower Na+i concentrations in the myocardium. As can be readily seen in the cine 1H MR images (and in the 23Na images), the CSA of the mid-axial LV myocardium showed a considerable increase at 140 mmHg, going from 0.66 ± 0.03 cm2 at 60 mmHg to 0.91 ± 0.03 cm2 at 140 mmHg (p < 0.05) with a 140 mmHg/60 mmHg ratio of 1.40 ± 0.08, in good agreement with the PPA data.
Fig. 5.
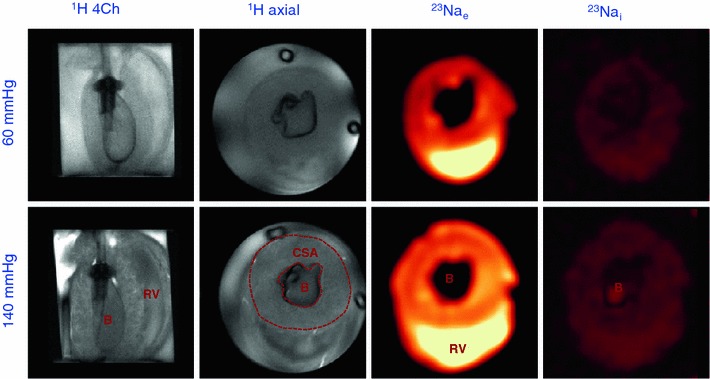
Representative MR images of an isolated rat heart perfused at 60 and 140 mmHg. Single frame 1H-cine MRI and extracellular and intracellular 23Na-CSI. B balloon, CSA cross sectional area of the LV, RV right ventricular lumen
In addition to the increase of the LV CSA, also an increase of LV Na+e relative signal intensity was observed, going from 17.4 ± 1.7 at 60 mmHg to 21.6 ± 2.2 at 140 mmHg (p < 0.05), with a 140 mmHg/60 mmHg ratio of 1.24 ± 0.18 (p < 0.05), in good agreement with CSA and PPA data. We also found an increase in LV Na+i relative signal intensity, going from 1.8 ± 0.2 at 60 mmHg to 2.0 ± 0.2 at 140 mmHg (p < 0.05), with a 140 mmHg/60 mmHg ratio of 1.11 ± 0.17. However, the shift reagent resulted in a clear but not complete separation between Na+e and Na+i CSI signals. The Na+e signal is at least an order of magnitude larger than the Na+i signal, and spectral deconvolution shows that the increase in the Na+i signal can be explained for >80 % by the overlap with the increased Na+e signal. Therefore, the corrected LV Na+i signal shows no change when going from 60 to 140 mmHg.
CE-MRI
After switching to the buffer with Gadovist, heart function remained stable. Baseline cine MRI and CE-MRI were performed at 60 mmHg, after which the perfusion pressure was increased to 140 mmHg. Figure 6 shows a series of T1 weighted MR images every 2 min after switching to Gd-containing buffer at 60 and 140 mmHg. The Gd started to appear in both groups after 4 min. In addition, CE-MR images showed an increased subendocardial enhanced area compared to the rest of the myocardium at 60 mmHg and even more so at 140 mmHg. From 10 min onwards the signal intensity of this hyper-enhanced area, delineated with a red dashed line, remained constant.
Fig. 6.
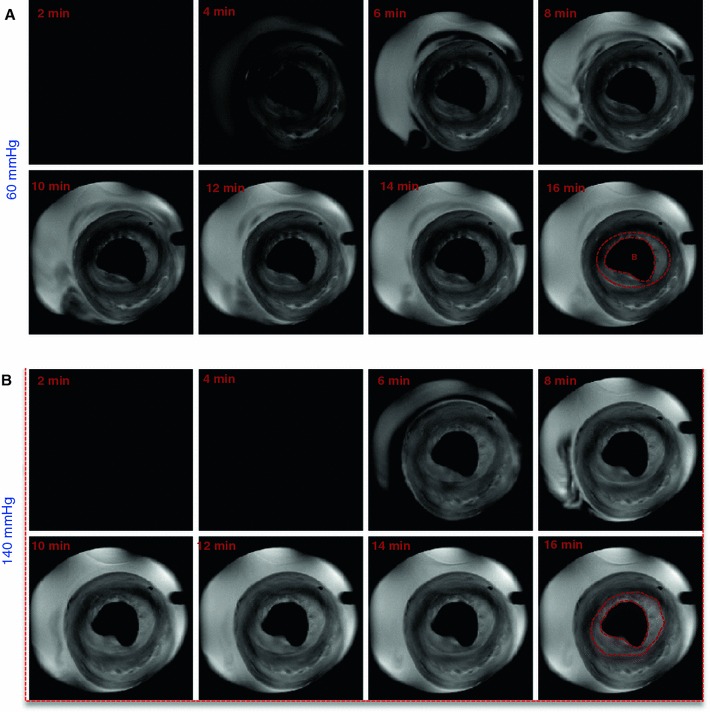
Representative T1-weighted MR images at 60 and 140 mmHg of a mid-axial slice of an isolated rat heart. Scans were acquired every 2 min after switching to Gadovist containing buffer. B balloon
Figure 7 shows typical CE-MR images at the beginning of the 60 mmHg perfusion and later at 140 mmHg and corresponding signal profiles across the images. As can be readily seen in the CE-MR image, the CSA of the hearts during perfusion at 140 mmHg was increased. From the cine images, the CSA of the mid-axial slice of the LV myocardium was significantly (p = 0.03) increased from 0.74 ± 0.04 cm2 at 60 mmHg to 0.90 ± 0.03 cm2 at 140 mmHg, with a 140 mmHg/60 mmHg ratio of 1.22 ± 0.08.
Fig. 7.
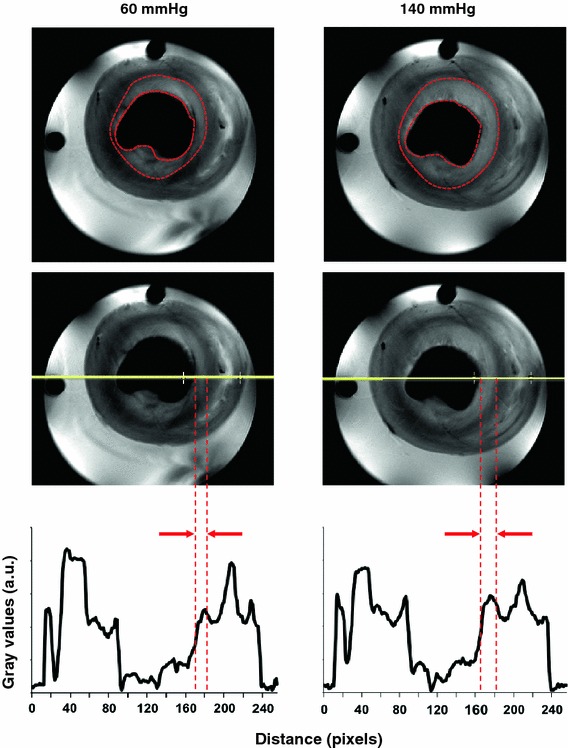
Representative CE-MR images for the same mid-axial slice of an isolated rat heart perfused a at 60 mmHg and b at 140 mmHg. c The signal profiles corresponding to the red lines across the images. The enhanced subendocardial area (marked with red dashed line) at 140 mmHg was larger than at 60 mmHg (p = 0.01), which can also be appreciated from the signal profile (c). The signal intensity of the subendocardial area was higher than the epicardial area both at 60 and 140 mmHg (p < 0.03)
The enhanced subendocardial area (Fig. 7, region outlined by the red dashed line) at 140 mmHg was significantly larger than at 60 mmHg (0.20 ± 0.02 cm2 vs. 0.31 ± 0.02 cm2, p = 0.01), with a ratio of 1.55 ± 0.07. Relative signal intensities in these enhanced areas were 15.1 ± 0.7 at 60 mmHg and 16.3 ± 1.0 at 140 mmHg (p > 0.05), with a ratio of 1.08 ± 0.05. The relative signal intensities between the subendocardial area and the subepicardial area were significantly different at both 60 mmHg (subendocardial 15.1 ± 0.7 vs. subepicardial 13.4 ± 0.6, p < 0.03, ratio 1.13 ± 0.01) and 140 mmHg (subendocardial 16.3 ± 1.0 vs. 14.3 ± 0.9, p < 0.03, ratio 1.14 ± 0.01).
Discussion
Using 31P-MRS we have developed a non-infarct model of extracellular edema in isolated rat hearts. With this model, we have demonstrated that CE-MRI can identify edematous myocardial tissue, most likely as a result of an increased distribution volume of Gd. Surprisingly, we found more edema in the subendocadial area than in the subepicardial area. We have demonstrated in this same edema model that the Na+e signal increases with increasing edema, confirming that Na+e is a useful endogenous marker of extracellular volume. Interestingly, a similar transmural distribution of signal intensities as observed in the contrast-enhanced images was also observed in the Na+e images. Na+i essentially remained unchanged in edema.
Using 31P-MRS we have shown that perfusion of hearts for an hour with crystalline buffers at high perfusion pressures leads to formation of interstitial edema, as evidenced by an increased distribution volume for PPA (Fig. 3). In addition, we observed a significant correlation between the increased PPA signal and the heart wet/dry weight ratio at the end of experiment. The increased PPA signal and the heart wet/dry ratio in our experiment are in line with findings by Li et al. [27]. The intracellular space remained unchanged, as evidenced by the stability of the difference between DMMP and PPA signals. This is in contrast to the results of Li et al., who observed intracellular edema as well, but in addition to simultaneous arterial/venous perfusion, they have used a hyperkalemic buffer, which may have contributed to the intracellular edema.
The presence of edema could also be confirmed by cine 1H-MRI. The CSA in both 23Na-CSI (Fig. 5) and CE-MRI (Fig. 7) groups showed a significant increase at 140 mmHg compared to 60 mmHg perfusion pressure, indicating an expanded volume of the extracellular compartment caused by myocardial interstitial edema. The expanded extracellular compartment is in line with the increased PPA signal and the heart wet/dry weight ratio of the 31P-MRS study.
In parallel to the increased CSA, the LV Na+e signal intensity increased at 140 mmHg, corroborating an increased level of interstitial edema. The absence of intracellular edema in the used model, as found with the 31P-MRS intracellular space measurements, was corroborated by the essentially unchanged LV Na+i signal, after correction for spectral overlap. Previously, we have used 23Na-CSI to study myocardial ischemia and found increases in Na+i signal of 200–300 %, where overlap with the Na+e signal had negligible effects on Na+i signal intensity [23, 28].
With CE-MRI at 60 and 140 mmHg (Fig. 6), the myocardium appeared dark in the T1 weighted image prior to Gd perfusion, whereas it appeared brighter after Gd perfusion, confirming the arrival of Gd in the myocardium. In addition, higher signal intensities of the mid-axial slice of the LV myocardium and the hyperenhanced-subendocardial area (Fig. 7) were observed at 140 mmHg compared to perfusion at 60 mmHg. One might assume a similar increase in extracellular Gd content as observed for Na+e. However, Gd affects both intra- and extracellular water, and therefore the effects of the increased extracellular Gd content are diluted compared to Na+e. Furthermore, the relationship between [Gd] and signal intensity is complex and non-linear.
We consistently observed transmural heterogeneous enhancement of the LV myocardium (Figs. 6, 7) after perfusion with Gd. The subendocardial area showed higher signal intensity, suggesting more edema in the subendocardial area than in the subepicardial area. This is most likely related to the intramyocardial pressure gradient, with this pressure being higher in the subendocardial area. In the model used, hydrostatic pressure difference is the most important, if not the only, source of edema, whereas in vivo differences in microvascular permeability and osmotic pressure may also contribute to the formation of edema [17]. The subendocardial area with higher signal intensity was significantly larger in hearts perfused at 140 mmHg than at 60 mmHg, confirming more edema at higher perfusion pressure. This finding might provide an explanation for observed late enhancement in patients with arterial hypertension in the absence of myocardial infarction [29]. Interestingly, a similar transmural distribution of signal intensities as observed in the CE-MR images can also be seen in the Na+e images (Fig. 5). However, since these hearts belong to different groups and, in addition, differences in spatial resolution, slice thickness and cardiac gating exist between CE-MRI and 23Na-CSI groups, direct correlation of these patterns is not possible.
Whether 23Na-CSI is indeed better capable than CE-MRI to distinguish between normal, edematous and infarcted tissue, in acute and chronic myocardial infarction, requires further experiments in an infarct model.
Methodological considerations
In addition to intracellular and interstitial contributions, the signals from the total water space marker DMMP and the extracellular space marker PPA include also contributions from vasculature, ventricular cavities, and perfusion and suction tubing adjacent to the rat heart. Nevertheless, our results clearly suggest a significant increase of the myocardial extracellular space within an hour of perfusion at higher pressure.
In biological tissue, 23Na (in Na+ ions) is present in a much lower concentration than 1H in H2O. This explains, together with the lower MR sensitivity of 23Na, the low spatial and temporal resolution of our 23Na-images compared to the 1H-MR images. To increase the SNR, we have chosen a thicker slice and bigger voxel size, and we have used k-space weighted acquisition to avoid Gibbs ringing. Moreover, the fact that 23Na has short relaxation times enabled us to use short repetition times. To partially overcome the low spatial resolution in the 23Na-images, we have used 1H-MR images as anatomical reference.
In this model, myocardial interstitial edema might already be present at 60 mmHg, resulting in a larger extracellular space than observed in vivo. However, the observed increase of Na+e at 140 mmHg clearly suggests a further expansion of the extracellular compartment, which was corroborated by 31P- and 1H-MR data.
Na+e mostly shows mono-exponential T2 relaxation (T2 = 38.7 ms, Van Emous et al. [24]) whereas Na+i shows bi-exponential T2 relaxation with usually 60 % of the signal fast relaxing (T2f = 2.3 ms [24]) and 40 % slow relaxing (T2s = 18.9 ms [24]). The CSI method requires an acquisition delay (0.91 ms), which is in the range of the T2f component, causing a non-negligible loss of Na+i signal. However, although Van Emous et al. have observed changes in T2 relaxation during ischemia and reperfusion, no such changes have been observed during normal perfusion such as used in the current experiments. Therefore, no correction was applied. Similar arguments apply with respect to T1 relaxation.
It is important to mention that our CE-MRI protocol is different from that used clinically to assess infarct size. We have used continuous perfusion of contrast agent, whereas in the clinic a bolus of contrast agent is administered. Due to the absence of an infarct and due to time constraints caused by the high rat heart rate, nulling of ‘remote’ myocardium is not possible in our model.
Clinical implications
With a non-infarct model of edema, we have demonstrated that tissue edema shows up in CE-MRI. This suggests that CE-MRI might lead to wrongful diagnosis of infarction in other cardiac disease states exhibiting edema or to overestimation of infarct size [1, 2]. 23Na-CSI might be an attractive tool to resolve these issues. We have shown that viable—but edematous myocardium—is characterized by increased Na+e and normal Na+i signals. Previously, we have shown that during global low flow and complete regional ischemia, Na+i signals increase several-fold, with partial recovery upon reperfusion [23]. Furthermore, we have previously observed in a model of chronic infarction after coronary artery ligation, a substantial increase of the Na+e signal and a complete absence of Na+i signal in the infarct area [30, 31]. These characteristics make 23Na-CSI a promising tool to discriminate between edema, acute and chronic MI. So far, only total Na+-MRI has been used clinically. However, to make 23Na-CSI a clinically feasible, high field (7 T) MRI scanners are recommended and a shift reagent safe for human use is required, which is not yet available, but could be developed, since MR contrast agents and MR shift reagents are chemically rather similar. Alternatively, the use of multiple quantum filtered MR methods [32, 33] or ultrashort-echo time (UTE) sequences [34] could be investigated.
Acknowledgments
We thank Steven S. A. Chamuleau MD, PhD (UMC, Utrecht, the Netherlands) for useful discussions and Thomas Oerther PhD (Bruker BioSpin GmbH, Germany) for technical assistance with MR imaging. Funding was supplied by ICIN and the Netherlands Heart Foundation (NHS) grant 2006B066 (CvE), and NHS grant 2010T001 (FA), the Dutch Technology Foundation STW, Applied Science Division of NWO and the Technology Program of the Ministry of Economic Affairs grant 07952 (GS).
Conflict of interest
None.
Open Access
This article is distributed under the terms of the Creative Commons Attribution License which permits any use, distribution, and reproduction in any medium, provided the original author(s) and the source are credited.
Contributor Information
Eissa N. E. Aguor, Email: e.n.e.aguor@umcutrecht.nl
Cees W. A. van de Kolk, Email: C.W.A.vandeKolk@umcutrecht.nl
Fatih Arslan, Email: f.arslan@umcutrecht.nl.
Marcel G. J. Nederhoff, Email: M.G.J.Nederhoff@umcutrecht.nl
Pieter A. F. M. Doevendans, Email: p.doevendans@umcutrecht.nl
Gerard Pasterkamp, Email: g.pasterkamp@umcutrecht.nl.
Gustav J. Strijkers, Email: g.j.strijkers@tue.nl
Cees J. A. van Echteld, Email: c.j.a.vanechteld@bluewin.ch
References
- 1.Abdel-Aty H, Zagrosek A, Schulz-Menger J, Taylor AJ, Messroghli D, Kumar A, Gross M, Dietz R, Friedrich MG. Delayed enhancement and T2-weighted cardiovascular magnetic resonance imaging differentiate acute from chronic myocardial infarction. Circulation. 2004;109:2411–2416. doi: 10.1161/01.CIR.0000127428.10985.C6. [DOI] [PubMed] [Google Scholar]
- 2.Berry C, Kellman P, Mancini C, Chen MY, Bandettini WP, Lowrey T, Hsu LY, Aletras AH, Arai AE. Magnetic resonance imaging delineates the ischemic area at risk and myocardial salvage in patients with acute myocardial infarction. Circ Cardiovas Imag. 2010;3:527–535. doi: 10.1161/CIRCIMAGING.109.900761. [DOI] [PMC free article] [PubMed] [Google Scholar]
- 3.Giri S, Chung YC, Merchant A, Mihai G, Rajagopalan S, Raman SV, Simonetti OP. T2 quantification for improved detection of myocardial edema. J Cardiovasc Magn Reson. 2009;11:56. doi: 10.1186/1532-429X-11-56. [DOI] [PMC free article] [PubMed] [Google Scholar]
- 4.Schaefer S, Malloy CR, Katz J, Parkey RW, Buja LM, Willerson JT, Peshock RM. Gadolinium-Dtpa-enhanced nuclear magnetic-resonance imaging of reperfused myocardium—identification of the myocardial bed at risk. J Am Coll Cardiol. 1988;12:1064–1072. doi: 10.1016/0735-1097(88)90477-9. [DOI] [PubMed] [Google Scholar]
- 5.Aletras AH, Tilak GS, Natanzon A, Hsu LY, Gonzalez FM, Hoyt RF, Arai AE. Retrospective determination of the area at risk for reperfused acute myocardial infarction with T2-weighted cardiac magnetic resonance imaging—histopathological and displacement encoding with stimulated echoes (DENSE) functional validations. Circulation. 2006;113:1865–1870. doi: 10.1161/CIRCULATIONAHA.105.576025. [DOI] [PubMed] [Google Scholar]
- 6.Edwards NC, Routledge H, Steeds RP. T2-weighted magnetic resonance imaging to assess myocardial oedema in ischaemic heart disease. Heart. 2009;95:1357–1361. doi: 10.1136/hrt.2009.169961. [DOI] [PubMed] [Google Scholar]
- 7.Eitel I, Friedrich MG. T2-weighted cardiovascular magnetic resonance in acute cardiac disease. J Cardiovasc Magn Reson. 2011;13:13. doi: 10.1186/1532-429X-13-13. [DOI] [PMC free article] [PubMed] [Google Scholar]
- 8.Raman SV, Simonetti OP, Winner MW, Dickerson JA, He X, Mazzaferri EL, Ambrosio G. Cardiac magnetic resonance with edema imaging identifies myocardium at risk and predicts worse outcome in patients with non-ST-segment elevation acute coronary syndrome. J Am Coll Cardiol. 2010;55:2480–2488. doi: 10.1016/j.jacc.2010.01.047. [DOI] [PMC free article] [PubMed] [Google Scholar]
- 9.Ubachs JFA, Engblom H, Erlinge D, Jovinge S, Hedstrom E, Carlsson M, Arheden H. Cardiovascular magnetic resonance of the myocardium at risk in acute reperfused myocardial infarction: comparison of T2-weighted imaging versus the circumferential endocardial extent of late gadolinium enhancement with transmural projection. J Cardiovasc Magn Reson. 2010;12:18. doi: 10.1186/1532-429X-12-18. [DOI] [PMC free article] [PubMed] [Google Scholar]
- 10.Wince WB, Kim RJ. Molecular imaging: T2-weighted CMR of the area at risk–a risky business? Nat Rev Cardiol. 2010;7:547–549. doi: 10.1038/nrcardio.2010.124. [DOI] [PubMed] [Google Scholar]
- 11.Wright J, Adriaenssens T, Dymarkowski S, Desmet W, Bogaert J. Quantification of myocardial area at risk with T2-weighted CMR comparison with contrast-enhanced CMR and coronary angiography. Jacc Cardiovas Imag. 2009;2:825–831. doi: 10.1016/j.jcmg.2009.02.011. [DOI] [PubMed] [Google Scholar]
- 12.Mehlhorn U, Davis KL, Laine GA, Geissler HJ, Allen SJ. Myocardial fluid balance in acute hypertension. Microcirculation. 1996;3:371–378. doi: 10.3109/10739689609148309. [DOI] [PubMed] [Google Scholar]
- 13.Davis KL, Mehlhorn U, Laine GA, Allen SJ. Myocardial edema, left ventricular function, and pulmonary hypertension. J Appl Physiol. 1995;78:132–137. doi: 10.1063/1.360663. [DOI] [PubMed] [Google Scholar]
- 14.Korkusuz H, Esters P, Naguib N, Eldin NEN, Lindemayr S, Huebner F, Koujan A, Bug R, Ackermann H, Vogl TJ. Acute myocarditis in a rat model: late gadolinium enhancement with histopathological correlation. Eur Radiol. 2009;19:2672–2678. doi: 10.1007/s00330-009-1454-y. [DOI] [PubMed] [Google Scholar]
- 15.Mehlhorn U, Davis KL, Burke EJ, Adams D, Laine GA, Allen SJ. Impact of cardiopulmonary bypass and cardioplegic arrest on myocardial lymphatic function. Am J Physiol. 1995;268:H178–H183. doi: 10.1152/ajpheart.1995.268.1.H178. [DOI] [PubMed] [Google Scholar]
- 16.Kong XQ, Wang LX, Kong DG. Cardiac lymphatic interruption is a major cause for allograft failure after cardiac transplantation. Lymphat Res Biol. 2007;5:45–47. doi: 10.1089/lrb.2007.5108. [DOI] [PubMed] [Google Scholar]
- 17.Levick JR, Michel CC. Microvascular fluid exchange and the revised Starling principle. Cardiovasc Res. 2010;87:198–210. doi: 10.1093/cvr/cvq062. [DOI] [PubMed] [Google Scholar]
- 18.Mahrholdt H, Wagner A, Holly TA, Elliott MD, Bonow RO, Kim RJ, Judd RM. Reproducibility of chronic infarct size measurement by contrast-enhanced magnetic resonance imaging. Circulation. 2002;106:2322–2327. doi: 10.1161/01.CIR.0000036368.63317.1C. [DOI] [PubMed] [Google Scholar]
- 19.Kim RJ, Judd RM, Chen EL, Fieno DS, Parrish TB, Lima JA. Relationship of elevated 23Na magnetic resonance image intensity to infarct size after acute reperfused myocardial infarction. Circulation. 1999;100:185–192. doi: 10.1161/01.CIR.100.2.185. [DOI] [PubMed] [Google Scholar]
- 20.Constantinides CD, Kraitchman DL, O’Brien KO, Boada FE, Gillen J, Bottomley PA. Noninvasive quantification of total sodium concentrations in acute reperfused myocardial infarction using 23Na MRI. Magn Reson Med. 2001;46:1144–1151. doi: 10.1002/mrm.1311. [DOI] [PubMed] [Google Scholar]
- 21.Kim RJ, Lima JA, Chen EL, Reeder SB, Klocke FJ, Zerhouni EA, Judd RM. Fast 23Na magnetic resonance imaging of acute reperfused myocardial infarction. Potential to assess myocardial viability. Circulation. 1997;95:1877–1885. doi: 10.1161/01.CIR.95.7.1877. [DOI] [PubMed] [Google Scholar]
- 22.Ouwerkerk R, Bottomley PA, Solaiyappan M, Spooner AE, Tomaselli GF, Wu KC, Weiss RG. Tissue sodium concentration in myocardial infarction in humans: a quantitative Na-23 MR imaging study. Radiology. 2008;248:88–96. doi: 10.1148/radiol.2481071027. [DOI] [PMC free article] [PubMed] [Google Scholar]
- 23.Jansen MA, Van Emous JG, Nederhoff MG, van Echteld CJA. Assessment of myocardial viability by intracellular 23Na magnetic resonance imaging. Circulation. 2004;110:3457–3464. doi: 10.1161/01.CIR.0000148132.15105.0E. [DOI] [PubMed] [Google Scholar]
- 24.Van Emous JG, Van Echteld GJA. Changes of intracellular sodium T-2 relaxation times during ischemia and reperfusion in isolated rat hearts. Magn Reson Med. 1998;40:679–683. doi: 10.1002/mrm.1910400505. [DOI] [PubMed] [Google Scholar]
- 25.Clarke K, Anderson RE, Nedelec JF, Foster DO, Ally A. Intracellular and extracellular spaces and the direct quantification of molar intracellular concentrations of phosphorus metabolites in the isolated rat heart using 31P NMR spectroscopy and phosphonate markers. Magn Reson Med. 1994;32:181–188. doi: 10.1002/mrm.1910320206. [DOI] [PubMed] [Google Scholar]
- 26.Buster DC, Castro MMCA, Geraldes CFGC, Malloy CR, Sherry AD, Siemers TC. Tm(Dotp)5—a 23Na+ Shift Agent for Perfused Rat Hearts. Magn Reson Med. 1990;15:25–32. doi: 10.1002/mrm.1910150104. [DOI] [PubMed] [Google Scholar]
- 27.Li G, Xiang B, Dai GP, Shaw A, Liu HY, Yang BF, Jackson M, Deslauriers R, Tian GH. Tissue edema does not change gadolinium-diethylenetriamine pentaacetic acid (Gd-DTPA)-enhanced T-1 relaxation times of viable myocardium. J Magn Reson Imaging. 2005;21:744–751. doi: 10.1002/jmri.20330. [DOI] [PubMed] [Google Scholar]
- 28.Van Emous JG, Nederhoff MGJ, Ruigrok TJC, van Echteld CJA. The role of the Na+ channel in the accumulation of intracellular Na+ during myocardial ischemia: consequences for post-ischemic recovery. J Mol Cell Cardiol. 1997;29:85–96. doi: 10.1006/jmcc.1996.0254. [DOI] [PubMed] [Google Scholar]
- 29.Yang EH, Lerman A. Angina pectoris with a normal coronary angiogram. Herz. 2005;30:17–25. doi: 10.1007/s00059-005-2641-5. [DOI] [PubMed] [Google Scholar]
- 30.Jansen MA, Nederhoff MG, van Echteld CJA (2003) Intracellular sodium imaging after coronary artery ligation in rats. ISMRM 11th scientific meeting & exhibition. international society for magnetic resonance in medicine, vol 188. 7 Dec 2003 (ref type: conference proceeding)
- 31.Jansen MA, Nederhoff MG, van Echteld CJA (2004) Intracellular sodium MRI in chronic myocardial infarction. J Cardiovas Mag Reson 6(1):318 (ref type: abstract)
- 32.Navon G, Werrmann JG, Maron R, Cohen SM. 31P NMR and triple quantum filtered 23Na NMR studies of the effects of inhibition of Na+/H+ exchange on intracellular sodium and pH in working and ischemic hearts. Magn Reson Med. 1994;32:556–564. doi: 10.1002/mrm.1910320503. [DOI] [PubMed] [Google Scholar]
- 33.Dizon JM, Tauskela JS, Wise D, Burkhoff D, Cannon PJ, Katz J. Evaluation of triple-quantum-filtered 23Na NMR in monitoring of Intracellular Na content in the perfused rat heart: comparison of intra- and extracellular transverse relaxation and spectral amplitudes. Magn Reson Med. 1996;35:336–345. doi: 10.1002/mrm.1910350311. [DOI] [PubMed] [Google Scholar]
- 34.de Jong S, Zwanenburg JJ, Visser F, van der Nagel R, van Rijen HV, Vos MA, de Bakker JM, Luijten PR. Direct detection of myocardial fibrosis by MRI. J Mol Cell Cardiol. 2011;51:974–979. doi: 10.1016/j.yjmcc.2011.08.024. [DOI] [PubMed] [Google Scholar]


