Abstract
The significance of flow cytometry indicating myelodysplasia without proof of myelodysplasia by cytomorphology remains to be clarified. We evaluated follow-up analyses in 142 patients analyzed in parallel by flow cytometry, cytomorphology and cytogenetics for suspected myelodysplasia without proof of myelodysplasia by cytomorphology. At initial assessment, flow cytometry indicated myelodysplasia in 64 of 142 (45.1%) patients. In 9 of 142 (6.3%) patients, cytogenetics revealed aberrant karyotypes at first evaluation that were found in 5 of 64 (7.8%) patients rated with myelodysplasia by flow cytometry. The remaining 133 patients without proof of myelodysplasia by cytomorphology and with normal karyotype underwent follow-up analyses that confirmed myelodysplasia by cytomorphology, cytogenetics or molecular genetics in 47 (35.3%) after a median interval of nine months (range 1-53 months). As far as initial flow cytometry results are concerned, this applied to 30 of 59 (50.1%) with myelodysplasia, 10 of 42 (23.8%) with “possible myelodysplasia” (minor antigen aberrancies only) and 7 of 32 (21.9%) without myelodysplasia (P=0.004). Notably, in these latter 7 patients, flow cytometry results changed at follow up to “possible myelodysplasia” (n=4) and “myelodysplasia” (n=2). These data argue in favor of including flow cytometry along with cytomorphology, cytogenetics and molecular genetics to diagnose myelodysplasia, and suggest a closer monitoring of patients with myelodysplasia-typical aberrant antigen expression found by flow cytometry.
Introduction
Myelodysplastic syndromes (MDS) comprise a heterogeneous group of clonal diseases affecting bone marrow and peripheral blood cells resulting from malignant transformation of bone marrow stem cells.1 MDS have been diagnosed on the basis of cytomorphological assessment of bone marrow and peripheral blood together with cytochemistry and cytogenetics, and classified according to FAB and WHO criteria.2-4 Since current classification schemes are heavily weighted on cytomorphological findings with some patients presenting only with minimal dysplasia not sufficient for a definitive diagnosis of MDS,5 and only half of the patients showing karyotype abnormalities,6 additional diagnostic approaches are needed to adequately diagnose or rule out MDS in patients with peripheral blood cytopenias of unknown cause.
Multiparameter flow cytometry (MFC) is increasingly considered an important additive tool in the diagnostic workup of patients with suspected MDS.5 It has been shown to be capable of detecting aberrant antigen expression related to MDS in a variety of studies.7-10 Multi-center co-operative efforts are being made to standardize and validate flow cytometric procedures in order to establish MFC as a diagnostic standard for MDS.11 In addition to the diagnostic value of MFC, this method may provide independent prognostic information, as has been demonstrated both during conventional or supportive therapy9,10 and following allogeneic stem cell transplantation.8
However, a major task in the evaluation of MFC as a diagnostic tool for MDS remains the proper determination of its sensitivity and specificity given that published studies consistently show high degrees of concordance between MFC results and the diagnostic gold standard in MDS, i.e. cytomorphology, but also report significant proportions of cases both with MDS by cytomorphology in which MFC does not reveal dysplastic features and with no MDS by cytomorphology in which MFC findings are in agreement with MDS. The clinical consequences in the latter cases are still unclear although in a subset of them cytogenetic aberrations confirm the diagnosis of MDS.
The present analysis was, therefore, performed in order to determine the significance of flow cytometric findings in agreement with MDS in the absence of a clear-cut cytomorphological diagnosis of MDS based on patients with suspected MDS serially analyzed in parallel by cytomorphology, MFC and cytogenetics, and in part also by molecular genetics.
Design and Methods
Patients
Patients analyzed at the MLL Munich Leukemia Laboratory from August 2005 to July 2011 for suspected MDS were identified in whom bone marrow cytomorphology (CM) did not unequivocally reveal MDS. Median age of patients was 68 years (range 18-87 years); 87 were male and 55 female (male:female ratio 1.58). Median WBC count was 4.2×10⁹/L (range 0.9-21.7×10⁹/L), median hemoglobin level 118 g/L (range 46-163 g/L), and thrombocyte count 109×109/L (6-704×109/L). Four patients had received prior chemotherapy for pre-existing malignancies. None of the patients had received therapy for MDS before either first or follow-up diagnostic evaluation. Out of these, cases were selected in which MFC and cytogenetics (CG) were performed in addition and in parallel to CM, and for which at least one additional evaluation during follow up with CM and MFC in parallel was available. A total of 142 such patients were identified. CM and MFC analyses were performed independently of each other in each case. In a subset of 38 out of these 142 patients molecular genetic analyses have also been performed.
Suspicion of MDS was raised by the physician sending the sample and was based on peripheral blood counts and differential as well as clinical criteria. Cases with hematologic malignancies other than MDS were excluded after the respective diagnosis was confirmed. Thus, in the present cohort all cases had in common an initial suspicion of MDS. The median number of assessments amounted to 2 per patient (range 2-6). The median interval between first and last assessment was nine months (range 1-53 months).
The present cohort differs from a previous publication of our group on this topic10 in that cases with cytomorphological confirmation of MDS at first assessment were not included and patients had to be diagnostically assessed at least two times. The end point of the present study has been the relation of MFC findings at first assessment to the findings of CM, CG and molecular genetics at follow-up assessment rather than the comparison of all methods at the first assessment.
All patients had given informed consent for the diagnostic analyses and for further workup and research procedures. The study was performed in accordance with the Declaration of Helsinki and was approved by the institutional review board of the MLL Munich Leukemia Laboratory.
Cytomorphology, cytogenetics, molecular genetics
Cytomorphological assessment was based on May-Grünwald-Giemsa stains, myeloperoxidase reaction, non-specific esterase using alpha-naphtyl-acetate and iron staining,12,13 and applied for diagnosis FAB2 and, in particular, WHO3,4 criteria. Cytogenetic analyses were performed according to standard protocols. Classification was according to ISCN nomenclature.14-16 Complex aberrant karyotype was defined by 3 or more clonal chromosome aberrations.4,17 Fluorescence in situ hybridization (FISH) was used following standard procedures6 to clarify all problematic cases. Molecular genetic (MG) analyses were performed for the detection of mutations in RUNX1,18NRAS19 and NPM120 as well as of FLT3-ITD21 and MLL-PTD,22 as described previously.
Multiparameter flow cytometry
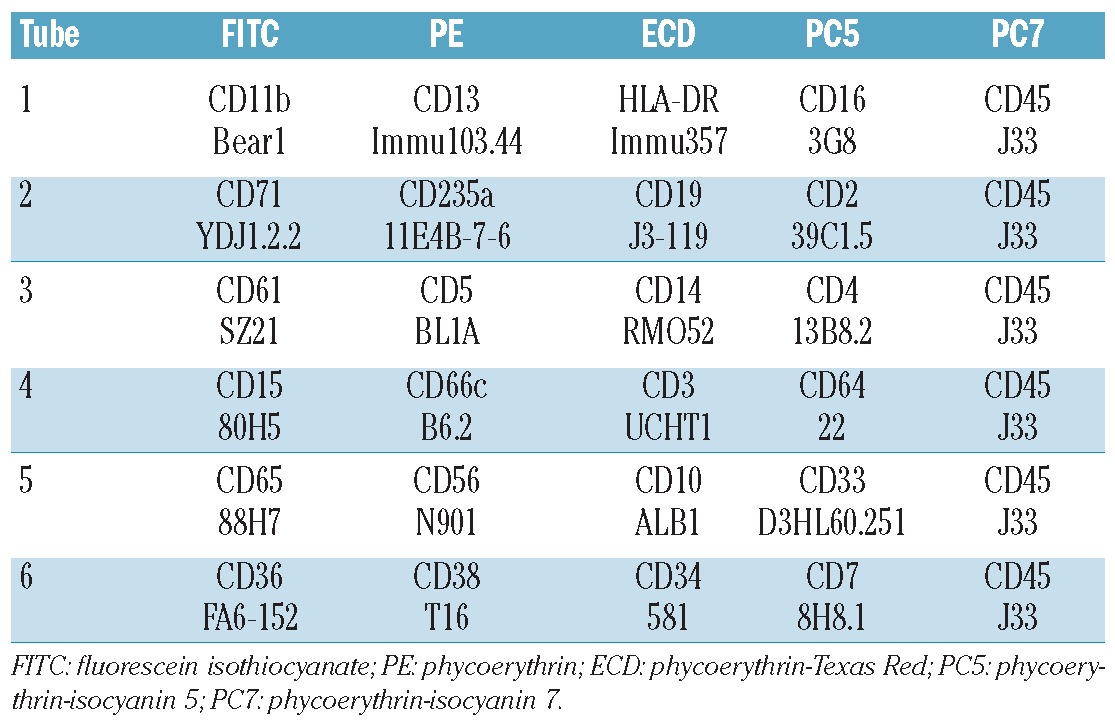
MFC was performed and evaluated as described previously10 applying 5-fold stainings and using the antibodies outlined in Table 1 for the analysis of bone marrow samples. Antibodies were purchased from Immunotech (Marseilles, France) except for CD66c (Becton Dickinson, Heidelberg, Germany). Antibody combinations were added to 106 cells (volume 100 mL) and incubated for 10 min. After addition of 2 mL ammonium chloride-based erythrocyte lysing solution samples were incubated for an additional 10 min and then washed twice in phosphate-buffered saline (PBS) and resuspended in 0.5 mL PBS. FC500 and Navios flow cytometers were used (Beckman Coulter, Miami, FL, USA); 50,000 events were acquired. Cytomics CXP and Navios software packages (Beckman Coulter) were used for data analysis.
Table 1.
Antibody panel used by MFC to diagnose MDS.
Criteria for rating MFC findings as MDS
Based on a previous study,10 we considered MFC findings in agreement with MDS if at least two cell compartments (out of myeloid progenitor cells, granulocytes, monocytes, erythroid cells) showed a total of at least 3 aberrancies in antigen expression. A significantly reduced side scatter (SSC) signal in granulocytes was counted as equivalent to one aberrantly expressed antigen. A count of myeloid progenitor cells of over 7% was sufficient by itself to diagnose MDS by MFC, even in the absence of aberrant antigen expression. Cases without aberrant antigen expression and a count of myeloid progenitor cells of 5% or less were rated as no MDS. Cases not fulfilling either of the before mentioned criteria: 1) patients with one or 2 aberrantly expressed antigens; 2) patients with aberrantly expressed antigens restricted to one cell compartment; and 3) patients with a count of myeloid progenitor cells of 6% or 7%, were rated as “possible MDS by MFC”.
The following antigens were analyzed for aberrant expression in the respective cell compartments as previously published.10
Granulocytes: reduced SSC signal, abnormal CD13/CD16 and CD11b/CD16 expression patterns (Figures 1 and 2, gating procedures demonstrated in Online Supplementary Videos 1 and 2), CD56 co-expression, CD33 negativity, CD64 negativity.
Figure 1.
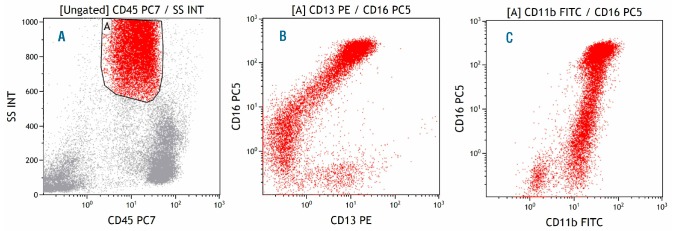
Normal bone marrow, granulocytes. (A) Gate A identifies granulocytes in the CD45-SSC plot. (B) CD13 and CD16 expression in granulocytes following a C-shaped maturation pattern from CD13+CD16– to CD13–CD16+ and CD13+CD16++. (C) CD11b and CD16 expression in granulocytes following a giraffe-type maturation pattern from CD11b–CD16– to CD11b+CD16– and CD11b++CD16++.
Figure 2.
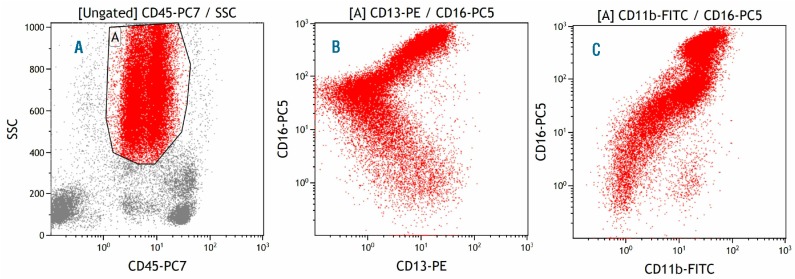
Myelodysplastic bone marrow, granulocytes. (A) Gate A identifies granulocytes in the CD45-SSC plot. (B) CD13 and CD16 expression in granulocytes deviating from the C-shaped maturation pattern observed in normal bone marrow with an earlier increase in CD16 expression. (C) CD11b and CD16 expression in granulocytes deviating from the giraffe-type maturation pattern observed in normal bone marrow with an earlier increase in CD16 expression.
Monocytes: CD11b negativity, HLA-DR negativity, CD13 negativity (Figures 3 and 4, gating procedures demonstrated in Online Supplementary Videos 3 and 4), CD16 co-expression, CD56 co-expression, aberrant CD2 co-expression.
Figure 3.
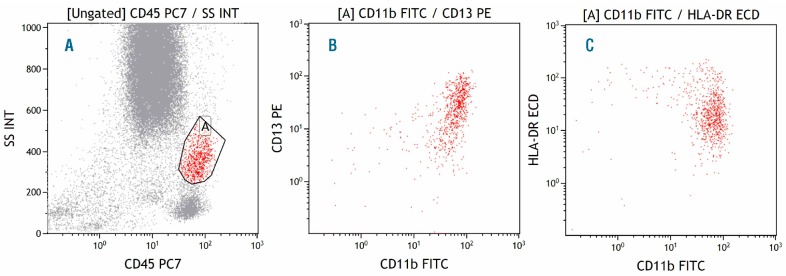
Normal bone marrow, monocytes. (A) Gate A identifies monocytes in the CD45-SSC plot. (B) Strong expression of both CD11b and CD13 in monocytes. (C) Strong expression of both CD11b and HLA-DR in monocytes.
Figure 4.
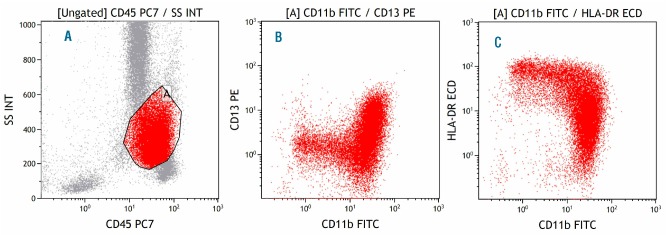
Myelodysplastic bone marrow, monocytes. (A) Gate A identifies monocytes in the CD45-SSC plot. (B) Reduced expression of both CD11b and CD13 in monocytes. (C) Reduced expression of both CD11b and HLA-DR in monocytes.
Myeloid blasts: percentage of BM myeloid blasts, co-expression of CD11b, CD5, CD56, CD7, CD15, and CD64 negativity, HLA-DR negativity.
Erythroid cells: homogeneously strong CD71 expression, CD71 negativity.
Statistical analysis
Dichotomous variables were compared using the χ2 test and Fisher's exact test, and continuous variables by Student's t-test. All calculations were performed using SPSS software 14.0.1 (IBM Corporation, Armonk, NY, USA). Reported P values are two-sided.
Results
Diagnostic results at first assessment
At the first assessment, MFC results indicated “MDS” in 64 of 142 (45.1%) patients and revealed “no sign of MDS” in 33 of 142 (23.2%) patients. In the remaining 45 of 142 (31.7%) patients, only minor aberrancies of antigen expression were observed by MFC; these were not sufficient to indicate MDS (“possible MDS by MFC” group of patients).
In 77 of 142 (54.2%) patients, CM revealed “possible MDS by CM”, i.e. although cytomorphological dysplastic features were present, they were not sufficient for diagnosing MDS. In the remaining 65 of 142 (45.8%) patients, there was no cytomorphological indication of MDS. Possible MDS by CM was found in 38 of 64 (59.4%) patients with MDS by MFC, in 27 of 45 (60%) with possible MDS by MFC, and in 12 of 33 (36.4%) patients with no MDS by MFC (P=0.063, Table 2).
Table 2.
Diagnostic results at first assessment in 142 patients with suspected MDS.

In 9 of 142 (6.3%) patients, CG revealed an aberrant karyotype compatible with the diagnosis of MDS and thereby confirmed MDS at the initial assessment (Table 2). This applied to 5 of 64 (7.8%) with MDS by MFC, 3 of 45 (6.7%) patients with possible MDS by MFC, and one of 33 (3.0%) patients with no MDS by MFC (P=not significant, n.s.). In detail, karyotype abnormalities included complex karyotype (n=3), trisomy 8 (n=1), trisomy 21 (n=1), and others (n=4). These proven MDS patients were excluded from further analyses of follow-up samples that were, therefore, based on 133 patients.
Diagnostic results at follow-up assessment by non-MFC methods
During follow-up assessments, MDS was confirmed by at least one non-MFC method (CM, CG or MG) in 47 of 133 (35.3%) patients. The rate of MDS confirmation was significantly higher in cases with a diagnosis of MDS by MFC at first assessment (30 of 59, 50.1%) as compared to cases with possible MDS by MFC at initial assessment (10 of 42, 23.8%) and with no MDS by MFC at initial assessment (7 of 32, 21.9%; P=0.004, Table 3 and Figure 5). There were no markers of marker combinations associated with a higher probability of MDS or high-risk MDS at follow-up assessment. The following numbers of cases were confirmed as MDS during follow-up assessment by the respective non-MFC methods: n=42 by CM, n=8 by CG, and n=5 by MG, respectively. Regarding the 8 cases with MDS confirmed by CG, the median portion of aberrant metaphases was 7 of 20 (range 2 of 20-20 of 20). In 7 of 8 of these cases with aberrations assessable by FISH, the median percentage of aberrant nuclei was 22% (range 2-88%). Thus there is no indication of the presence of “early MDS” in these cases.
Table 3.
Diagnostic results at follow-up assessments in 133 patients not diagnosed as MDS at first assessment by non-MFC methods.
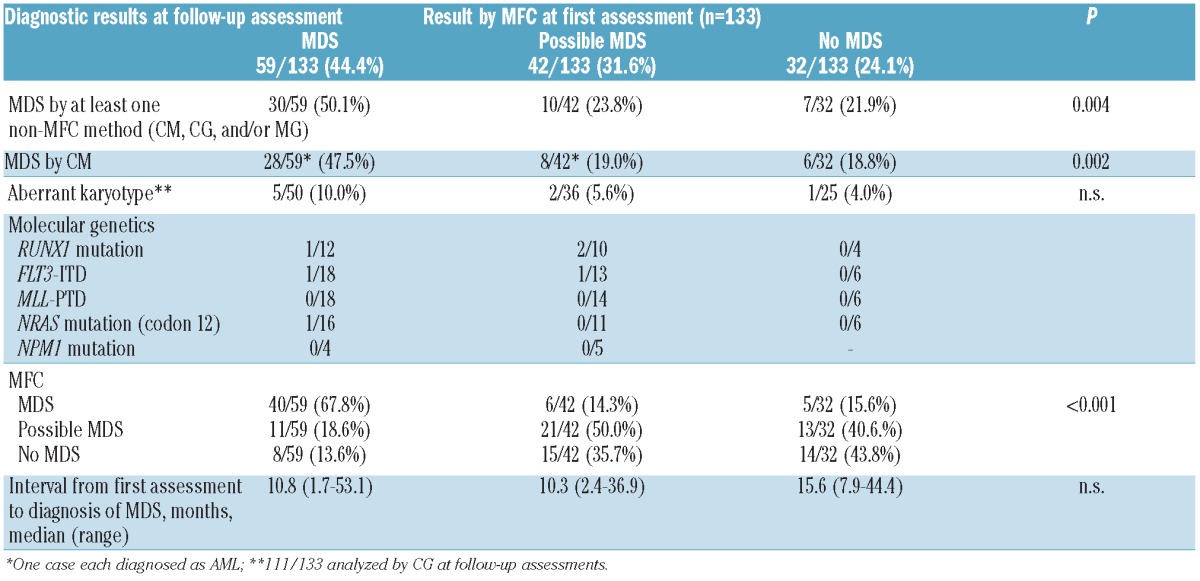
Figure 5.
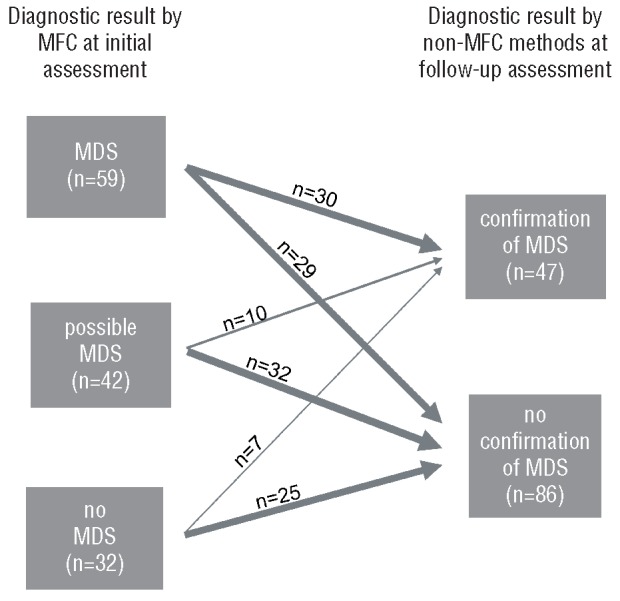
Relation between diagnosis by MFC at initial assessment and non-MFC diagnosis during follow-up assessment. (Left) The three categories (“MDS”, “possible MDS” and “no MDS”) as diagnosed by MFC. (Right) The two categories (“confirmation of MDS” and “no confirmation of MDS”) as diagnosed by non-MFC methods. Arrows indicate the respective numbers of cases from the MFC-categories at initial assessment either confirmed or not confirmed by non-MFC methods at follow-up assessment.
CM confirmed MDS at follow-up assessment in a total of 42 of 133 (31.6%) cases. According to the overall results, the rate of MDS confirmation by CM was significantly higher in cases with a diagnosis of MDS by MFC at first assessment (28 of 59, 47.5%) as compared to those with MFC at first assessment revealing possible MDS (8 of 42, 19.0%) or no MDS (6 of 32, 18.8%; P=0.002, Table 3). In 2 of these confirmatory cases, CM revealed AML at follow-up assessment while in the remaining 40 cases the cytomorphological diagnoses at follow-up assessment were RA (n=1), RCMD (n=11), RAEB-1 (n=12), RAEB-2 (n=5), CMML (n=7), and MDS/MPN unclassifiable (n=4).
CG confirmed MDS at follow-up assessments by newly detectable cytogenetic changes in a total of 8 of 111 (7.2%) cases. Again, this rate of MDS confirmation by CG was highest in cases with MDS by MFC at first assessment (5 of 50, 10.0%) as compared to cases with MFC at first assessment revealing possible MDS (2 of 36, 5.6%) or no MDS (1 of 25, 4.0%; P=n.s.; Table 3).
Aberrant karyotypes encountered during follow-up assessment included one case each with del(5q), del(11q), del(20q), trisomy 8, and complex karyotype and 3 cases with other abnormalities. All these cases were retrospectively re-evaluated for these aberrations at first assessment and were again found with normal karyotype at the earlier time point.
MG confirmed MDS at follow-up assessments in 5 cases by the detection of acquired molecular mutations (i.e. FLT3-ITD and mutations in RUNX1 and NRAS). None of them was diagnosed as “no MDS” by MFC at first assessment. More details on the markers tested and those found positive by MG are provided in Table 3.
Diagnostic results at follow-up assessment by MFC
Regarding findings by MFC at follow-up assessments, the highest rate of MDS was found in cases diagnosed as MDS by MFC already at first assessment (40 of 59, 67.8%) with lower rates in cases rated by MFC at first assessment as possible MDS (6 of 42, 14.3%) or no MDS (5 of 32, 15.6%; P<0.001, Table 3). Cases were rated as possible MDS by MFC at follow-up assessment most frequently in the group already initially rated as possible MDS by MFC (21 of 42, 50.0%) and less frequently in those initially rated as no MDS (13 of 32, 40.6.%) or as MDS (11 of 59, 18.6%) by MFC.
Notably, in the 7 patients with no MDS by MFC at the initial assessment, in whom follow-up assessments revealed MDS by non-MFC methods, changes in MFC results between initial and follow-up assessments to possible MDS (n=4) and MDS (n=2) were observed with only one patient still being diagnosed as “no MDS” by MFC criteria (Table 4). Out of the 10 patients with “possible MDS” by MFC at initial assessment, who were confirmed MDS by non-MFC methods during follow-up assessments, the MFC result at follow-up assessment turned to MDS in 4 patients and was still “possible MDS” in 5 patients. In one patient no MDS was found by MFC.
Table 4.
Diagnostic results at follow-up assessment by MFC in 17 patients in whom MFC at first assessment revealed no MDS or possible MDS and in whom MDS was diagnosed at follow-up assessment by non-MFC methods.

Time to confirmation of MDS
The interval between initial assessment and confirmation of MDS by a non-MFC method was slightly shorter in cases initially diagnosed as MDS by MFC (median 10.8 months, range 1.7-53.1 months) and in those diagnosed possible MDS by MFC (median 10.3 months, range 2.4-36.9 months) as compared to cases with no MDS by MFC at initial assessment (median 15.6 months, range 7.9-44.4 months; n.s.).
Discussion
The diagnostic criteria for MDS have been clearly defined in the WHO classification4 and are based on cytomorphology in addition to cytochemistry and cytogenetics. Nonetheless, there remain a significant number of patients with cytopenias and suspected MDS in whom bone marrow evaluation reveals limited dysplastic features not sufficient to diagnose MDS based on WHO criteria. In general, it is recommended to perform repeat evaluations in these patients in order to document an increase in dysplastic features or blasts sufficient to diagnose MDS or to identify a non-MDS cause for the cytopenia which was not evident at the initial evaluation.5 Given the increased incidence of MDS observed during recent years, as well as an additional significant number of patients with potentially under-diagnosed MDS on the one hand,23 and the increase in therapeutic capabilities gained beyond supportive approaches and allogeneic transplantation procedures24-26 on the other, there is a clear need to improve diagnostic procedures in patients in whom, at present, MDS is diagnosed only during follow-up evaluations.
The flow cytometric assessment of aberrant antigen expression related to MDS is increasingly used in the diagnostic setting of MDS as various studies have shown its diagnostic and even prognostic power.7-10 However, an issue that still remains to be resolved is the diagnostic finding of MDS by MFC in the absence of a diagnosis of MDS by standard procedures, i.e. by CM and CG. This has been found to occur in a subset of patients in virtually all of the above mentioned studies7-10 and a priori has been discussed as incomplete specificity of MFC in diagnosing MDS. Taking into consideration MDS-specific cytogenetic aberrancies found in a proportion of these patients,10 it becomes clear that MDS may be present and detected by MFC in the absence of dysplastic features by CM.
In the present study, we aimed to further clarify the significance of MFC findings resulting in the diagnosis of MDS but in the absence of MDS confirmation by CM. In a series of 142 patients with suspected MDS, 9 patients (6.3%) were found to carry cytogenetic aberrancies and were thereby confirmed MDS in the absence of an MDS diagnosis by CM at the initial assessment. Furthermore, our present data confirm earlier observations10 of a higher proportion of at least slight dysplastic features by CM in cases with MDS or possible MDS by MFC (59.6%) as compared to cases with no MDS by MFC (36.4%). These findings suggest that CM based on the present WHO criteria4 is not capable of diagnosing each case with MDS, that minor dysplastic features as identified by CM indeed may be indicative of MDS, and that findings by MFC which are in agreement with MDS are related to CM findings even in these latter cases.
The 133 patients in the present series in whom at initial assessment CM did not reveal MDS and CG did not reveal karyotype abnormalities were re-evaluated at follow-up assessments at intervals of between 1.7 and 53.1 months. Strikingly, in cases with an MDS by MFC at first assessment, we found a rate of 50.1% confirmation of MDS at later time points by CM, CG or even MG. This was significantly higher compared to the respective rate in patients with possible MDS (23.8%) and no MDS (21.9%) as assessed by MFC. These data clearly argue in favor of the significance of diagnostic findings of MDS by MFC even in the absence of respective findings by the present standard methods, i.e. CM and CG. In detail, the largest proportion of patients with confirmation of MDS at follow-up assessment was confirmed by CM (47.5%) and a clearly lower proportion was confirmed by CG (10.0%). However, similar to the findings at initial assessment, there were some cases still not diagnosed as MDS by CM at follow-up assessments in whom the acquisition of karyotype abnormalities were found, leading to confirmation of MDS. In addition, in single cases of those analyzed, mutations were found by molecular genetics at follow-up assessment. Since these analyses were only performed in a small subset of the present series, it is not possible to judge the real frequency of these findings since presumably additional cases with molecular mutations would have been identified if the complete cohort had been analyzed for this. However, taking into account additional mutations that have been recently reported,27-30 it is anticipated that molecular genetic analyses will significantly gain importance in the diagnostic work-up of patients with suspected MDS.
We report here for the first time follow-up assessments in MDS by MFC accompanied by other diagnostic techniques. This differs from previous reports on the analysis of MFC as a diagnostic tool for MDS. All other studies published so far found large agreements between diagnostic results of MFC and CM while in subsets of analyzed cases discordant diagnostic results occurred which could not be clarified by repeat evaluations at follow up.7-10 The present data, therefore, strongly support the recommendation to repeat the evaluation of patients with suspected but not confirmed MDS.5 Taking into account the interval between initial assessment and confirmation of MDS amounting to a median of less than one year in cases with a finding of MDS by only MFC at initial assessment, the recommended repeat evaluations should be confirmed at shorter intervals, e.g. after 6-9 month periods, if clinical symptoms still make the diagnosis of MDS most probable.
In conclusion, the data of the present study indicate that the evaluation by MFC for aberrant antigen expression related to MDS may significantly improve diagnostic procedures in patients with suspected MDS. Given the lack of complete concordance of diagnostic findings revealed by the different available methods, the approach of diagnosing MDS should consider a combination of CM with CG and MFC. Future studies including follow-up evaluations should further substantiate these findings and also define the role of the respective methods including molecular genetics for improving diagnosis of MDS in the near future. However, given an expected median survival of around five years for low-risk MDS (the category most patients in the present report would fall into) and of 20 years in a general population aged 60 to 70 years, follow-up over many years is needed.
Footnotes
The online version of this article has a Supplementary Appendix.
Authorship and Disclosures: Information on authorship, contributions, and financial & other disclosures was provided by the authors and is available with the online version of this article at www.haematologica.org.
References
- 1.Cazzola M, Malcovati L. Myelodysplastic syndromes--coping with ineffective hematopoiesis. N Engl J Med. 2005;352(6):536-8 [DOI] [PubMed] [Google Scholar]
- 2.Bennett JM, Catovsky D, Daniel MT, Flandrin G, Galton DA, Gralnick HR, et al. Proposals for the classification of the myelodysplastic syndromes. Br J Haematol. 1982;51(2):189-99 [PubMed] [Google Scholar]
- 3.WHO Classification of Tumours. Pathology and Genetics of Tumours of Haematopoietic and Lymphoid Tissues, 3rd ed. Lyon: IARC Press, 2001 [Google Scholar]
- 4.WHO Classification of Tumours of Haematopoietic and Lymphoid Tissues, 4th ed. Lyon: International Agency for Research on Cancer. (IARC), 2008 [Google Scholar]
- 5.Valent P, Horny HP, Bennett JM, Fonatsch C, Germing U, Greenberg P, et al. Definitions and standards in the diagnosis and treatment of the myelodysplastic syndromes: Consensus statements and report from a working conference. Leuk Res. 2007;31(6):727-36 [DOI] [PubMed] [Google Scholar]
- 6.Haferlach C, Rieder H, Lillington DM, Dastugue N, Hagemeijer A, Harbott J, et al. Proposals for standardized protocols for cytogenetic analyses of acute leukemias, chronic lymphocytic leukemia, chronic myeloid leukemia, chronic myeloproliferative disorders, and myelodysplastic syndromes. Genes Chromosomes Cancer. 2007;46(5):494-9 [DOI] [PubMed] [Google Scholar]
- 7.Stetler-Stevenson M, Arthur DC, Jabbour N, Xie XY, Molldrem J, Barrett AJ, et al. Diagnostic utility of flow cytometric immunophenotyping in myelodysplastic syndrome. Blood. 2001;98(4):979-87 [DOI] [PubMed] [Google Scholar]
- 8.Wells DA, Benesch M, Loken MR, Vallejo C, Myerson D, Leisenring WM, et al. Myeloid and monocytic dyspoiesis as determined by flow cytometric scoring in myelodysplastic syndrome correlates with the IPSS and with outcome after hematopoietic stem cell transplantation. Blood. 2003;102(1):394-403 [DOI] [PubMed] [Google Scholar]
- 9.van de Loosdrecht AA, Westers TM, Westra AH, Drager AM, van der Velden VH, Ossenkoppele GJ. Identification of distinct prognostic subgroups in low- and intermediate-1-risk myelodysplastic syndromes by flow cytometry. Blood. 2008;111(3):1067-77 [DOI] [PubMed] [Google Scholar]
- 10.Kern W, Haferlach C, Schnittger S, Haferlach T. Clinical utility of multiparameter flow cytometry in the diagnosis of 1013 patients with suspected myelodysplastic syndrome: correlation to cytomorphology, cytogenetics, and clinical data. Cancer. 2010;116(19):4549-63 [DOI] [PubMed] [Google Scholar]
- 11.van de Loosdrecht AA, Alhan C, Bene MC, la Porta MG, Drager AM, Feuillard J, et al. Standardization of flow cytometry in myelodysplastic syndromes: report from the first European LeukemiaNet working con-ference on flow cytometry in myelodysplas-tic syndromes. Haematologica. 2009;94(8):1124-34 [DOI] [PMC free article] [PubMed] [Google Scholar]
- 12.Haferlach T, Schoch C, Loffler H, Gassmann W, Kern W, Schnittger S, et al. Morphologic dysplasia in de novo acute myeloid leukemia (AML) is related to unfavorable cytogenetics but has no independent prog-nostic relevance under the conditions of intensive induction therapy: results of a mul-tiparameter analysis from the German AML Cooperative Group studies. J Clin Oncol. 2003;21(2):256-65 [DOI] [PubMed] [Google Scholar]
- 13.Bacher U, Haferlach C, Alpermann T, Kern W, Schnittger S, Haferlach T. Comparison of genetic and clinical aspects in patients with acute myeloid leukemia and myelodysplas-tic syndromes all with more than 50% of bone marrow erythropoietic cells. Haematologica. 2011;96(9):1284-92 [DOI] [PMC free article] [PubMed] [Google Scholar]
- 14.Schoch C, Haferlach T, Bursch S, Gerstner D, Schnittger S, Dugas M, et al. Loss of genetic material is more common than gain in acute myeloid leukemia with complex aberrant karyotype: a detailed analysis of 125 cases using conventional chromosome analysis and fluorescence in situ hybridization including 24-color FISH. Genes Chromosomes Cancer. 2002;35(1):20-9 [DOI] [PubMed] [Google Scholar]
- 15.Schoch C, Kern W, Krawitz P, Dugas M, Schnittger S, Haferlach T, et al. Dependence of age-specific incidence of acute myeloid leukemia on karyotype. Blood. 2001;98(12):3500. [DOI] [PubMed] [Google Scholar]
- 16.Schoch C, Haferlach T, Haase D, Fonatsch C, Loffler H, Schlegelberger B, et al. Patients with de novo acute myeloid leukaemia and complex karyotype aberrations show a poor prognosis despite intensive treatment: a study of 90 patients. Br J Haematol. 2001;112(1):118-26 [DOI] [PubMed] [Google Scholar]
- 17.Schoch C, Kern W, Kohlmann A, Hiddemann W, Schnittger S, Haferlach T. Acute myeloid leukemia with a complex aberrant karyotype is a distinct biological entity characterized by genomic imbalances and a specific gene expression profile. Genes Chromosomes Cancer. 2005;43(3):227-38 [DOI] [PubMed] [Google Scholar]
- 18.Schnittger S, Dicker F, Kern W, Wendland N, Sundermann J, Alpermann T, et al. RUNX1 mutations are frequent in de novo AML with noncomplex karyotype and confer an unfavorable prognosis. Blood. 2011;117(8):2348-57 [DOI] [PubMed] [Google Scholar]
- 19.Bacher U, Haferlach T, Schoch C, Kern W, Schnittger S. Implications of NRAS mutations in AML: a study of 2502 patients. Blood. 2006;107(10):3847-53 [DOI] [PubMed] [Google Scholar]
- 20.Schnittger S, Schoch C, Kern W, Mecucci C, Tschulik C, Martelli MF, et al. Nucleophosmin gene mutations are predic-tors of favorable prognosis in acute myel-ogenous leukemia with a normal karyotype. Blood. 2005;106(12):3733-9 [DOI] [PubMed] [Google Scholar]
- 21.Schnittger S, Schoch C, Dugas M, Kern W, Staib P, Wuchter C, et al. Analysis of FLT3 length mutations in 1003 patients with acute myeloid leukemia: correlation to cytogenetics, FAB subtype, and prognosis in the AMLCG study and usefulness as a marker for the detection of minimal residual disease. Blood. 2002;100(1):59-66 [DOI] [PubMed] [Google Scholar]
- 22.Schnittger S, Wormann B, Hiddemann W, Griesinger F. Partial tandem duplications of the MLL gene are detectable in peripheral blood and bone marrow of nearly all healthy donors. Blood. 1998;921728-34 [PubMed] [Google Scholar]
- 23.Cogle CR, Craig BM, Rollison DE, List A F.Incidence of the myelodysplastic syndromes using a novel claims-based algorithm: high number of uncaptured cases by cancer registries. Blood. 2011;117(26):7121-5 [DOI] [PMC free article] [PubMed] [Google Scholar]
- 24.Komrokji RS, List AF. Role of lenalidomide in the treatment of myelodysplastic syndromes. Semin Oncol. 2011;38(5):648-57 [DOI] [PubMed] [Google Scholar]
- 25.Garcia-Manero G. Integrating care for patients with lower risk myelodysplastic syndrome. Semin Oncol. 2011;38(5):658-66 [DOI] [PubMed] [Google Scholar]
- 26.Garcia-Manero G. Treatment of higher-risk myelodysplastic syndrome. Semin Oncol. 2011;38(5):673-81 [DOI] [PubMed] [Google Scholar]
- 27.Graubert TA, Shen D, Ding L, Okeyo-Owuor T, Lunn CL, Shao J, et al. Recurrent mutations in the U2AF1 splicing factor in myelodysplastic syndromes. Nat Genet. 2011;44(1):53-7 [DOI] [PMC free article] [PubMed] [Google Scholar]
- 28.Papaemmanuil E, Cazzola M, Boultwood J, Malcovati L, Vyas P, Bowen D, et al. Somatic SF3B1 mutation in myelodysplasia with ring sideroblasts. N Engl J Med. 2011;365(15):1384-95 [DOI] [PMC free article] [PubMed] [Google Scholar]
- 29.Bejar R, Stevenson K, Abdel-Wahab O, Galili N, Nilsson B, Garcia-Manero G, et al. Clinical effect of point mutations in myelodysplastic syndromes. N Engl J Med. 2011;364(26):2496-506 [DOI] [PMC free article] [PubMed] [Google Scholar]
- 30.Walter MJ, Shen D, Ding L, Shao J, Koboldt DC, Chen K, et al. Clonal Architecture of Secondary Acute Myeloid Leukemia. N Engl J Med. 2012;366(12):1090-8 [DOI] [PMC free article] [PubMed] [Google Scholar]


