

Abstract
Sub-diffraction-limit imaging can be achieved by sequential localization of photoactivatable fluorophores, where the image resolution depends on the number of photons detected per localization. Here, we report a strategy for fluorophore caging that creates photoactivatable probes with high photon yields. Upon photoactivation, these probes can provide 104–106 photons per localization and allow imaging of fixed samples with resolutions of several nanometers. This strategy can be applied to many fluorophores across the visible spectrum.
Recent years have witnessed rapid development of super-resolution fluorescence imaging methods which substantially surpass the diffraction limit1,2. These include methods based on patterned illumination, such as stimulated emission depletion (STED and related RESOLFT) microscopy1,3 and saturated structured illumination microscopy (SSIM)4, as well as methods based on single-molecule switching and localization, such as stochastic optical reconstruction microscopy (STORM)5 and (fluorescence) photoactivated localization microscopy ((F)PALM)6,7. Resolutions of 10–100 nm have been achieved when imaging biological samples using these methods, allowing otherwise hidden details of subcellular organelles or structures to be revealed. However, given that most protein molecules are only a few nanometers in size, considerably higher resolutions will be required to directly resolve molecular interactions in cells.
STORM and (F)PALM achieve sub-diffraction-limit resolution by sequentially switching on and localizing individual fluorophores in order to build up a high-resolution map of the probes that decorate an imaging target. An important requirement of the method is that the probes can be prepared in a dark state with only a controllably small fraction switched on at any time. Since the localization precision scales approximately as the inverse square root of the number of photons detected from the activated probe, the image resolution depends critically on the number of photons detected per switching event for the probe. A variety of photoswitchable/photoactivatable fluorescent probes have been previously used, including organic dyes8–10, fluorescent proteins11, and quantum dots12. These probes typically give on the order of 103 detected photons per switching event. Although the best fluorescent dyes can emit ~106 detected photons contiguously and provide a localization precision of ~1 nm13,14, this potential has not yet been realized in super-resolution imaging due in part to the inability to prepare these fluorophores in an activatable dark state.
Here, we report a procedure to chemically convert fluorophores to a stable dark state that can be subsequently photoactivated to the fluorescent state in a buffer optimized for high photon emission. The procedure entails treatment of fluorescent dyes with a reducing agent (sodium borohydride, NaBH4), which converts the dyes to a long-lived reduced, or caged, form (Fig. 1a). Conveniently, the procedure may be carried out in situ, after staining the sample. Because the absorption spectra of the reduced dyes are strongly blue-shifted, the dyes are effectively converted to a dark state. Reduced cyanine dyes have been previously used as sensors for detecting electron beams15 or reactive oxygen16. Here, we demonstrate that reduced dyes are excellent photoactivatable fluorophores that yield orders of magnitude more photons than currently existing ones and can be used as probes for super-resolution imaging. The reduced dyes may be considered as “caged” because they contain a new covalent bond formed by addition of a hydride anion to the fluorophores (unpublished data) and because they may be photoactivated to return the dyes to their bright, fluorescent form.
Figure 1.

Bright photoactivatable dyes created by reductive caging. (a) Left panel, initial fluorescence signal of a fixed cell immunolabeled for microtubules with Cy3B. Middle panel, fluorescence signal after reduction with NaBH4. Right panel, fluorescence signal after illumination with UV light, showing approximately 40% recovery of the initial fluorescence. The image contrast in the middle and right panels is multiplied by 2.5 compared to the left panel. Scale bar, 5 μm. (b) Fluorescence trace of a single Cy3B molecule recovering to a bright state after reduction and subsequent photoactivation (blue box). (c) Mean number of photons detected from individual Atto488, Cy3, Cy3B, Alexa 647, and Cy5.5 molecules after photoactivation. (d) Mean localization precision (left axis) and potentially obtainable resolution (right axis) determined from at least 100 molecules for each dye. Here, each molecule was tracked for many consecutive camera frames and a distribution of localizations from individual frames were constructed. The standard error of the mean (SEM) of the localization distribution for each molecule’s trajectory corresponds to the localization precision of each molecule when all photons detected from the molecule were used for a single localization. The potentially obtainable resolution, i.e. the minimum distance required to resolve two molecules, is determined as 2.35 times the localization precision assuming a Gaussian distribution.
Photoactivation of the reduced dyes can be facilitated by illumination with ultraviolet (UV) or violet light. To demonstrate the effectiveness of the NaBH4-induced caging and subsequent photo-uncaging processes, we immunolabeled microtubules in fixed cells with a bright, fluorescent dye, Cy3B. Incubation with NaBH4 quenched the initial fluorescence (under 561 nm excitation; Fig. 1a, left) to a nearly undetectable level (Fig. 1a, middle). After illumination with UV or violet light, the molecules became fluorescent again when excited with 561 nm light (Fig. 1a, right). The recovery yield was 40%, i.e. 40% of the reduced dye molecules were photoactivatable. The incomplete recovery could be due to photobleaching of the dye molecules by the activation light or the formation of some non-recoverable reduced products.
We identified several commercially available dyes across the visible spectrum which can be reduced and subsequently photoactivated in this manner. The recovery fraction was 66% for the blue dye Atto 488, 35–40% for the yellow dyes Cy3 and Cy3B, and 12–17% for the red dyes Alexa 647 and Cy5.5 (Supplementary Fig. 1). The relatively low recovery yield of the red dyes can be compensated for in super-resolution imaging by labeling individual proteins of interest with multiple dye molecules, although this type of labeling may not be achievable for all proteins.
We characterized the number of photons per switching event and the localization precision of individual dye molecules after activation. An example fluorescence time trace of a single Cy3B molecule before and after photoactivation is shown in Figure 1b. On average, we detected 270,000 photons over 10 s from each Cy3B molecule after photoactivation and prior to photobleaching or switching off using a low intensity of 0.11 kW/cm2 561 nm excitation (Fig. 1c). By tracking the center positions of the images of individual Cy3B molecules over multiple frames, we measured the localization uncertainty for each molecule per switching event (Supplementary Fig. 2). The average localization precision was determined to be 1.6 nm (Fig. 1d), which corresponds to a potentially obtainable resolution of 3.7 nm (= 2.35 × localization precision assuming a Gaussian distribution). Similarly, another yellow dye, Cy3, gave 220,000 detected photons over 10 s at 0.11 kW/cm2 561-nm excitation, with a 1.8 nm localization precision and 4.4 nm potentially obtainable resolution (Fig. 1c, d and Supplementary Fig. 2). The two red dyes, Alexa 647 and Cy5.5, emitted more photons per activation event, providing 1.7 and 1.1 million detected photons over 120 s at 0.08 kW/cm2 657-nm excitation, respectively (Fig. 1c and Supplementary Fig. 2). The measured localization precisions of these two red dyes, 0.7 nm and 0.8 nm, correspond to potentially obtainable resolutions of 1.7 nm and 2 nm, respectively (Fig. 1d and Supplementary Fig. 2). The blue dye Atto 488 emitted fewer photons (11,000 photons detected) over 0.8 s and gave a poorer localization precision (4.7 nm) and obtainable resolution (11 nm) at 0.5 kW/cm2 488-nm excitation (Fig. 1c, d and Supplementary Fig. 2). Nonetheless, it still emitted substantially more photons than previously reported blue photoswitchable/activatable dyes10. Notably, although the fluorophores could be switched off more rapidly with higher excitation intensities, the photon yields of these dyes decreases with increasing excitation intensities (Supplementary Fig. 3). Thus, there is a trade-off between image resolution and acquisition speed. Additional properties relevant to super-resolution imaging, including the off-switching rate and on-off duty cycle (defined as the fraction of time that the molecule spends in the on state10) at different excitation powers, are provided in Supplementary Fig. 3.
We note that a different method to utilize reduced dyes, namely mixing suitable concentrations of NaBH4 and an oxidant to obtain on-off equilibrium switching of cyanine dyes, has been proposed for super-resolution imaging17.
To demonstrate that the reductive caging and photoactivation procedure indeed allows for super-resolution imaging, we performed STORM imaging of cells immunostained for tubulin using antibodies labeled with multiple dye molecules to help compensate for low dye recovery yields. The immunostained samples were reduced in situ using NaBH4. Weak 405 nm light was then used to activate only a small fraction of the dyes at a time, allowing for high-precision localization of individual molecules. The activation, imaging, and localization procedure was iterated over 40–80 min until a sufficiently high density of localizations was acquired to allow the reconstruction of a super-resolution image. Figure 2 shows the STORM images obtained for the representative blue, yellow, and red dyes, Atto 488, Cy3B, and Cy5.5. Cy3 and Alexa 647 gave images of similar quality to that obtained with Cy3B and Cy5.5, respectively (data not shown).
Figure 2.
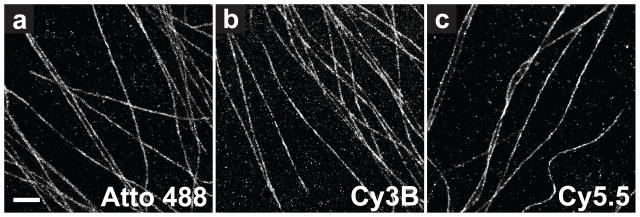
STORM images of microtubules in cells stained by indirect immunofluorescence with (a) Atto 488, (b) Cy3B, and (c) Cy5.5. Samples were reduced in situ with NaBH4, washed, and then imaged with 488 nm, 561 nm, and 647 nm excitation light in a buffer designed to reduce blinking and photobleaching. Illumination with 405 nm light allowed control over the activation rate. Scale bar, 1 μm.
To avoid antibody-induced broadening effects and to illustrate higher image resolution obtainable with these bright probes, we prepared samples of known structures that were directly labeled with dye. Figure 3a shows an image of microtubules which were polymerized in vitro and labeled directly with Cy3B. Cy3B was chosen here since it offered the best tradeoff between photon yield, recovery fraction, and imaging speed. Highly uniform labeling was achieved, with an average distance of 5 nm between neighboring localizations. To image these densely labeled samples, we used higher illumination intensity (0.6–1.2 kW/cm2) to increase imaging speed and improve the on-off contrast ratio, and hence fewer photons (on average ~100,000) were detected per activation event (Supplementary Fig. 3). Accordingly, the obtainable resolution was decreased from 3.7 nm to 6 nm and the total imaging time was 80 min. Brightfield fiducial markers were used to correct for drift, resulting in residual drift errors of <1 nm from frame to frame, and <2 nm over 1–2 hours.
Figure 3.

STORM image of microtubules polymerized and labeled in vitro with Cy3B. (a) A STORM image of microtubules (green) with several magnified zoom-in images shown in insets. A portion of the corresponding conventional fluorescence image (magenta) is overlaid on the STORM image. (b) Transverse cross-sectional profiles of the boxed microtubule segments (i)–(iii). Segments (i) and (ii) show hollow microtubule profiles with 16–18 nm inner diameter. The red curves are nonlinear least-squares fits of the distribution to two Gaussian functions. Segment (iii) shows a segment of microtubules that are less well-resolved, which gives a top-hat profile with an overall width of 26.6 nm. Scale bars, 1 μm in the main image and 100 nm in all image insets.
Zoom-in images of segments of microtubules and transverse profiles of these segments showed the hollow tubular structure of the microtubule, with higher localization densities near the edges and two peaks separated by 16–18 nm (Fig. 3a insets and Fig. 3b). Analysis of the transverse profiles of ten double-peaked microtubule segments from eight different microtubules gave a mean peak-to-peak separation of 16.4 ± 1.1 nm s.d., which is in quantitative agreement with the known 17 nm inner diameter of microtubules (Supplementary Fig. 4). In comparison, previous super-resolution images of microtubules recorded with dimmer fluorophores have either failed to resolve the hollow tubular structure or have shown a substantially broadened tubular structure with diameter of ~37 nm due to antibody labeling10,18. We note that not all microtubules show the hollow tubular structure (Fig. 3c). The transverse profiles of these microtubules have a mean width of 26.8 ± 0.8 nm s.d. (ten microtubule segments from eight different microtubules). One possible reason that these microtubules were less well resolved could be due to inadequate fixation or immobilization.
Using the reductively caged Cy3B, we also imaged a thinner object, filamentous bacteriophage M13 virus. Transverse profiles of M13 particles showed ~9 nm widths (Supplementary Fig. 5), again in good agreement with the known ~7 nm diameter of the virus particle.
The concentrations and incubation times of sodium borohydride used here for STORM imaging did not significantly perturb the structure of either microtubules or M13 bacteriophage as revealed by electron microscopy images, though longer incubations or higher concentrations of NaBH4 can degrade the microtubule samples (Supplementary Figs. 6, 7).
It should be noted that at the level of molecular-scale resolution other factors may limit the overall resolution in addition to the photon number. One such factor is the dipole orientation effect if the fluorophore orientation is fixed or substantially constrained during imaging. Such fixed-dipole effects are most prominent for molecules out of focus19, though small errors also exist for in-focus samples20. The fluorophores studied here do not exhibit substantially hindered rotation (Supplementary Fig. 8). The localization errors for molecules within 100 nm of the focal plane were estimated to be <5 nm for the red dyes and <6 nm the orange dyes (Supplementary Fig. 9). For the well-focused 25 nm wide microtubules and 7 nm wide virus particles studied here, the dipole-induced error is minimal. However, to obtain a molecular-scale (1–2 nm) resolution for thick samples, the fixed-dipole effect can become a substantial limiting factor, and labeling methods to promote freely rotating dyes or analysis approaches to correct for fixed-dipole effects will be required (see also Supplementary Note).
A second limiting factor to consider is the labeling strategy and density of fluorescent labels, since the overall obtainable image resolution may also be compromised by an insufficient density of labels. Here, we used direct protein labeling to achieve a relatively high labeling density without considerable broadening of the structure under study. In order to take advantage of the high resolution affordable by these fluorophores for cellular samples, other labeling strategies may be required, such as site-specific labeling using genetically fused peptide tags and enzymes or the use of small drug/ligand molecules or small immunolabels, such as nanobodies18.
The high photon yield of the photoactivatable probes developed in this work was achieved at a cost of the long time it takes to switch off or bleach each fluorophore. Accordingly, the acquisition time of the STORM images obtained here was relatively long (tens of minutes), but is compatible with ultrastructural imaging of fixed samples. Because the photon number detected per activation event increases with decreasing illumination intensity, the obtainable resolution could be further increased compared to those observed in Fig. 3, when lower excitation laser intensities are used (Supplementary Fig. 3), but the imaging speed would be slower. As another tradeoff, the on-off duty cycle also increases when the excitation intensity is decreased, reducing the number of molecules that can be localized in the diffraction-limited area. The high photon yields of these reductively caged probes potentially allow sufficiently high resolution to determine molecular organizations within individual protein complexes. The relatively low number of molecules that would need to be localized in this type of application should both allow substantially faster imaging and alleviate the constraint on localization density imposed by the on-off duty cycle, but may require improvements in the recovery yield of the dyes and the use of high-efficiency labeling strategies.
Beyond our demonstration here, there are also several other potential benefits of the high-photon yields of these photoactivatable probes. First, they should allow improved axial resolution for 3D superresolution imaging in addition to improved transverse resolution. Second, they should allow the use of microscope components that confer advantages to specific experiments but which are typically avoided in super-resolution imaging due to lower collection/detection efficiencies. For example, water-immersion objective lenses, which have lower collection efficiencies and larger point-spread functions than high numerical aperture (NA) oil-immersion lenses, could be used to image deeper into aqueous samples without incurring severe spherical aberrations (as high NA oil-immersion lenses do). The high-photon yield of these fluorophores should allow the use of water-immersion objective lenses while maintaining a very high image resolution. Third, fluorophore emission could be divided amongst several detection planes (multiplane detection) to allow extension of the focal range achievable with superresolution imaging.
ONLINE METHODS
Dyes and other materials
Monofunctional, amine-reactive dyes (succinimidyl ester) were obtained from Atto-tec (Atto 488), Invitrogen (Alexa 647, DiI), and GE Healthcare (Cy3, Cy3B, Cy5.5). Unless otherwise indicated, all other reagents were obtained from Sigma-Aldrich.
Experimental Setups
Single-molecule and STORM measurements on Cy3, Cy3B, Alexa 647, and Cy5.5 were performed on an Olympus IX-71 microscope equipped with an Olympus UPlanSApo 100x, 1.4 NA oil immersion objective lens. Cy3 and Cy3B were excited with a 561 nm laser (Sapphire 561-200; Coherent), while Cy5.5 and Alexa 647 were excited with a 657 nm laser (RCL-300-656; Crystalaser). A 405 nm laser (Cube 405-50C; Coherent) was used for activation of dark-state molecules. Laser lines were reflected by a custom polychroic mirror (z405/561/657rpc; Chroma).
Fluorescence for Cy3, Cy3B, Alexa 647, and Cy5.5 was recorded with an Andor iXon 897, cooled electron-multiplying charge-coupled device camera, in parallel with bright field images of fiducial markers for tracking lateral drift of the sample. A dual-channel imaging module (DV-CC Dual-view; Photometrics) was inserted in the emission path, which splits the image into two spectral bands using a 630 nm longpass dichroic (630dcxr; Chroma) and projects the two spectral bands to different regions of the camera. The short-wavelength spectral band was configured with a bandpass emission filter suitable for detecting fluorescence from the yellow dyes Cy3 and Cy3B (FF01-607/70-25; Semrock), while the long-wavelength spectral band was configured with a bandpass emission filter suitable for detecting fluorescence from the red dyes Alexa 647 and Cy5.5 (ET705/72; Chroma). When imaging the yellow dyes, the bright field reference object images were collected by inserting a 736/128 bandpass filter (FF01-736/128-25; Semrock) in the microscope condenser arm such that the bright field images would only be detected in the long-wavelength spectral band. When imaging red dyes, a 570/80 bandpass filter (HQ570/80; Chroma) was inserted in the microscope condenser arm such that the bright field images would only be detected in the short-wavelength spectral band. A double notch filter (NF01-568/647; Semrock) was also inserted into the detection path prior to the dual-channel imaging module in order to reduce detection of reflected or scattered 561 nm or 657 nm excitation laser light.
A home-built focus lock system was used to compensate for focal drift during the acquisition and was slightly modified compared to earlier implementations21,22. In this case, the focus lock system uses total internal reflection of an 830 nm diode laser (LPS-830-FC; Thorlabs) at the glass-water interface of the sample in combination with a quadrant photodiode that detects lateral shifts of the reflected beam. A piezoelectric objective lens positioner (Nano-F100; MadCity Labs) corrects for focal shift displacements based on the lateral shift of the reflected beam.
Experiments on the blue dye Atto 488 were performed on a different, but essentially identical, microscope system which is configured with a 488 nm laser line from a mixed-gas argon-krypton laser (Innova 70C; Coherent). A 495 nm longpass dichroic mirror (T495LP; Chroma) was used to reflect the 488 nm laser line, and the emission was filtered with a bandpass filter (ET525/50m; Chroma).
Immunostained Samples
BS-C-1 cells (American Type Culture Collection)were cultured with Eagle’s Minimum Essential Medium fortified with 10% fetal bovine serum with penicillin and streptomycin, and incubated at 37 C with 5% CO2. Approximately 24,000 cells per well were seeded into LabTek 8-well coverglass chambers one day prior to fixation. Microtubules were immunostained using the following procedure: washing in PBS (phosphate-buffered saline); fixation in a mixture of 3% formaldehyde (Electron Microscopy Sciences) and 0.1% glutaraldehyde (Electron Microscopy Sciences) in PBS for 10 min; reduction with ~10 mM NaBH4 for 5 min; washing with PBS; blocking and permeabilization with 3% w/v bovine serum albumin (Jackson ImmunoResearch Laboratories) and 0.25% v/v Triton X-100 in PBS for 30 min; staining for 40 min with rat anti-tubulin primary antibodies (ab6160; Abcam, clone YL1/2) diluted to 10 μg/mL in blocking buffer; washing with PBS; staining for 40 min with custom-labeled donkey anti-rat secondary antibodies diluted to ~2.5 μg/mL in blocking buffer; washing with PBS; post-fixation in a mixture of 3% formaldehyde and 0.1% glutaraldehyde in PBS for 10 min; and washing in PBS.
Donkey anti-rat secondary antibodies for immunofluorescence were labeled with varying numbers of dyes per antibody molecule according to the manufacturers’ protocols. For Atto 488 and Cy3B, secondary antibodies were labeled with 2–4 dye molecules per antibody molecule, while for Cy5.5, antibodies were labeled with 7 dye molecules per antibody in order to compensate for its lower recovery yield. Imaging of immunostained samples was performed at a frame rate of 10 Hz with movie durations of 25,000–50,000 frames. Bright field images of intracellular vesicles, recorded in parallel with fluorescence, were used as fiducial markers for correction of drift in samples stained with Cy3B and Cy5.5. Drift correction for STORM movies obtained with Atto 488 (Fig. 2a) was not performed using fiducial markers but using correlations between segments of the STORM movie, as described previously23.
Photoactivation Recovery Yield Estimates
BS-C-1 cells immunostained for microtubules with Atto 488, Cy3, Cy3B, and Cy5.5 were reduced with freshly prepared NaBH4 solutions in PBS, washed with PBS, and then photoactivated by illumination with ultraviolet light. The entire process was conducted on the microscope stage such that the same cell could be imaged before reduction, after reduction, and after photoactivation. The reported recovery yield is the ratio of the post-photoactivation fluorescence to the pre-reduction fluorescence. Cy3B was photoactivated with ultraviolet light alone. Atto 488, Cy3, Alexa 647, and Cy5.5 were photoactivated with ultraviolet light in the presence of riboflavin, a known source of photogenerated reactive oxygen species24. Since riboflavin itself is fluorescent when excited with blue light, fresh buffer lacking riboflavin was used when recording the post-photoactivation recovery. Similarly, when performing STORM imaging with the blue dye Atto 488, we also omitted riboflavin.
Single-Molecule Photon Yield and Localization Precision Characterization
Donkey anti-rat or donkey anti-mouse secondary antibodies (Jackson ImmunoResearch) were labeled with 0.2–0.5 dye/IgG using the manufacturers’ protocols. The low labeling ratio ensured that most antibody molecules would be labeled with no more than 1 dye per antibody molecule. Dye-labeled antibody molecules and 1 μm nonfluorescent beads (C37483; Invitrogen) were adsorbed to LabTek 8-well coverglass chambers (154534; Nunc) that had been cleaned by sonication for 20 min in 1 M aqueous potassium hydroxide and then silanized by incubation with 1% N-(2-aminoethyl)-3-aminopropyl trimethoxysilane, 5% acetic acid, and 94% methanol for 20 min to facilitate sticking. The nonfluorescent beads were used as fiducial markers for experiments on Cy3, Cy3B, Alexa 647, and Cy5.5, as described below.
After adsorption, the dye-labeled antibodies were reduced with ~10 mM NaBH4 for 5–10 min, washed with PBS, and imaged as the dye molecules recovered to a bright form upon illumination. Initially, most molecules existed in a dark state. Any molecules that were initially bright were bleached by illumination with the excitation laser prior to the start of the measurement. During the measurement, individual molecules which recovered to a bright state from the dark, reduced form, were imaged until they became dark again, most likely due to photobleaching. In the case of Cy3, Cy3B, Alexa 647, and Cy5.5, molecules were activated by illumination with a 405 nm pulse (~20 W/cm2) followed by imaging with illumination at 561 nm or 657 nm (0.11 kW/cm2 for 561 nm, 0.08 kW/cm2 for 657 nm). Epifluorescence illumination with oblique incidence angle (smaller than the critical angle for total internal reflection) or total-internal reflection illumination was used for all single-molecule characterization measurements. Due to the apparent low sensitivity of reduced Atto 488 to activation by 405 nm light, reduced Atto 488 samples were illuminated with 488 nm light only (~1.1 kW/cm2) as molecules recovered to a bright form. Fluorescence images were recorded at frame rates of 4 Hz (Cy3, Cy3B, Alexa 647, and Cy5.5) and 10 Hz (Atto 488). Activated molecules were detected and analyzed according to the methods described below.
Data Analysis
Molecules which appeared bright at the beginning of an imaging period were identified and tracked by fitting single-molecule images with 2D Gaussians. Drift was determined by recording bright field images of nonfluorescent beads (typically 4–10 per movie) in parallel with fluorescence images from single molecules. The mean displacement of the nonfluorescent beads was subtracted from the tracked positions of single molecules to create drift-corrected single-molecule traces. At least 100 fluorescent molecules were tracked for each dye. The position trajectory and fluorescence time trace of each molecule was individually evaluated to ensure that they in fact represented single fluorescent molecules — a minor fraction of trajectories which contained excessive intensity fluctuations, more than one position cluster during the on-time, or more than one photobleaching step, likely represented more than one molecule, and were discarded. In the case of Atto 488, molecules spontaneously recovered to a bright form during 488 nm illumination, and were tracked from their initial appearance until they became dark. Drift correction was not used for Atto 488 measurements due to the relatively short on-times of the fluorophore.
Characterization of Additional Switching Properties
Power dependence of photons per localization and off-switching rates
A low density (~0.1/μm2) of dye-labeled antibodies was adsorbed to coverglass and imaged under epifluorescence illumination with various intensities (0.08–5 kW/cm2) until nearly all molecules within the field had bleached. The distribution of photons per localization emitted by single molecules was fit with a single-exponential function to determine the number of emitted photons. The off-rate was determined from a single-exponential fit to the on-time distribution.
On-off duty cycle
Because the light used for imaging can also activate the caged molecules, albeit with a lower efficiency than the violet or UV light, the total number of molecules that can be localized in the diffraction limited area is limited. When the molecule density is too high, there will be more than one molecule activated in the diffraction limited area at any time due to the imaging light, making it difficult to localize the molecules precisely. A quantitative measure of this switching property that directly relates to the number of molecules localizable per diffraction-limited area is the on-off duty cycle of the fluorophore, which is defined as the fraction of time that the molecule spends in the on state under illumination. For a molecule that is initially dark, and is then photoactivated and finally switched off, this value is equal to (the dwell time of the initial off state)/(the dwell time of the initial off state + the dwell time of the on state before switching off). When the imaging light is applied to an ensemble of molecules initially in the dark state, a steady state will be reached with a fraction of molecules in the on state that is equal to the duty cycle value.
To measure this quantity, dye-labeled antibodies were adsorbed to coverglass at high density, creating a near-uniform fluorescent layer as viewed by conventional fluorescence imaging. The sample was first reduced with sodium borohydride, washed with PBS, and then imaged with epifluorescence illumination at various intensities (0.08–2 kW/cm2). Under the imaging light, the fluorescence signal from the ensemble of molecules reached the steady state, observed as fluorescence reaching a plateau. This plateau level was then compared to the fluorescence level achieved after 405 nm light was used to activate the remaining dark fluorophores to the fluorescent state, and the duty cycle was determined by taking the ratio of the former and the latter. For each intensity, a separate movie was recorded under identical conditions for a reference sample lacking adsorbed dye-labeled antibodies in order to determine background signal levels. The background signal levels were then subtracted from the images of the dye samples.
In Vitro Microtubule Sample
M13 Sample
10 μL of M13KE bacteriophage (1013 plaque forming units/mL, N0316S; New England Biolabs) was incubated with 5 mM Cy3B-NHS for 100 min at room temperature. Labeled virus was separated from free dye by gel filtration using Nap-5 columns (GE Healthcare, 17-0853-01). Labeled M13 was adsorbed at a dilution of 1:500 in PBS for 10 min on LabTek 8-well chambers, followed by washing with PBS and adsorption of 1 μm nonfluorescent beads, as described for in vitro microtubule samples. Prior to imaging by STORM, the M13 samples were reduced with freshly prepared ~30 mM NaBH4 for ~5 min, and then washed with PBS.
STORM Imaging
The STORM movies were 20,000–30,000 frames in duration, except for the STORM image in Fig. 2c which was reconstructed from a 50,000 frame movie. All movies were recorded at 10 Hz, except Fig. 3a, which was recorded at 4 Hz. Figure 2a utilized ~1.1 kW/cm2 excitation intensity at 488 nm, while Figure 2b–c utilized ~4–5 kW/cm2 excitation intensity at 561 nm for Cy3B and 657 nm for Cy5.5. The excitation intensities for Fig. 3 and Supplementary Fig. 5 were 0.4–0.8 kW/cm2 and 0.8–1.6 kW/cm2, respectively, at 561 nm. Oblique incidence or total internal reflection (TIR) illumination geometry was used in order to minimize background fluorescence. Photoactivation by 405 nm illumination was typically initiated at ~5,000 frames, and the 405 nm intensity was then ramped to ~50 W/cm2 by the end of the movie in order to compensate for photobleaching and thereby maintain a reasonable density of activated fluorescent molecules during the movie. Any initially bright (unreduced) fluorophores were pre-bleached by illumination with the excitation laser prior to start of the STORM movie.
STORM movies were analyzed and rendered as described previously21–23. In this case, however, drift trajectories determined from bright field images were used to correct for sample drift during acquisition, except for the Atto 488 STORM image, where correlations within the STORM movie itself were used for drift correction23.
Buffers for STORM Imaging and Single-Molecule Measurements
All single-molecule and STORM imaging measurements utilized an aqueous imaging buffer designed to suppress blinking and reduce photobleaching rates. The buffer consisted of 100 mM tris at pH 8.0, 1 mM ascorbic acid with 1 mM methyl viologen (AAMV)25, and an enzymatic oxygen scavenging system. Use of 1 mM trolox26 instead of ascorbic acid and methyl viologen achieved similar results. All experiments on Alexa 647 and Cy5.5 utilized an oxygen scavenging system consisting of 5 mM protocatechuic acid (PCA), and 8.3 nanokatal/mL protocatechuate dioxygenase (PCD)27. Experiments on Atto 488, Cy3, and Cy3B instead utilized an oxygen scavenging system consisting of 0.5 mg/mL glucose oxidase (GLOX), 40 μg/mL catalase, and 5% (w/v) glucose. While Atto 488, Cy3, and Cy3B performed comparably well when using either of the oxygen scavenging systems, Alexa 647 and Cy5.5 gave lower photon yields with the GLOX system compared to the PCD/PCA system. The buffer used for obtaining superresolution images with Cy5.5 was supplemented with the photosensitizer riboflavin (20 μM) in order to boost the rate of activation of molecules from the reduced form upon illumination with 405 nm light.
Electron Microscopy
Stock solutions of microtubules and M13 bacteriophage were prepared as follows. Microtubules were polymerized according to the procedure described above and were then diluted ~100 fold into PEM-P buffer. (100 mM PIPES, 1 mM EGTA, 1 mM MgCl2, with 20 μM paclitaxel). M13 bacteriophage particles were diluted 100 fold into PBS. Microtubules or M13 bacteriophage particles, from their respective stock solutions, were adsorbed for 20 sec onto glow-discharge-treated carbon- and formvar-coated copper electron microscopy grids, fixed for 15 min with 1% glutaraldehyde in PEM-P buffer and washed with water (M13 samples were not fixed), treated with a freshly prepared aqueous sodium borohydride solution at the specified concentration/duration, washed with water, and stained for 30 sec with a 0.75% solution of uranyl formate. Because microtubule samples tend to be fragile, prior to staining with uranyl formate, samples were transferred between solutions for successive incubations without blotting the liquid off the sample since dragging the meniscus across the sample appeared to sometimes damage the microtubules. Imaging was performed on a Tecnai G2 Spirit BioTWIN electron microscope.
Supplementary Material
Acknowledgments
We thank T. Mitchison (Harvard Medical School), M. Ericsson (Harvard Medical School), and W. Wang (Harvard University) for help during this project. This work is supported in part by the National Institutes of Health and a Collaborative Innovation Award from Howard Hughes Medical Institute (to X.Z.). J.C.V. is supported in part by a Burroughs-Wellcome Career Award at the Scientific Interface. X.Z. is a Howard Hughes Medical Institute investigator.
Footnotes
AUTHOR CONTRIBUTIONS
J.C.V. is primarily responsible for experimental design. J.C.V. and S.J. performed experiments and analysis. X.Z. supervised and guided the project. J.C.V. and X.Z. wrote the manuscript.
COMPETING FINANCIAL INTERESTS
The authors declare no competing financial interests.
References
- 1.Hell SW. Science. 2007;316:1153–1158. doi: 10.1126/science.1137395. [DOI] [PubMed] [Google Scholar]
- 2.Huang B, Babcock H, Zhuang X. Cell. 2010;143:1047–1058. doi: 10.1016/j.cell.2010.12.002. [DOI] [PMC free article] [PubMed] [Google Scholar]
- 3.Klar TA, Hell SW. Opt Lett. 1999;24:954–956. doi: 10.1364/ol.24.000954. [DOI] [PubMed] [Google Scholar]
- 4.Gustafsson MGL. Proc Natl Acad Sci USA. 2005;102:13081–13086. doi: 10.1073/pnas.0406877102. [DOI] [PMC free article] [PubMed] [Google Scholar]
- 5.Rust MJ, Bates M, Zhuang X. Nat Methods. 2006;3:793–796. doi: 10.1038/nmeth929. [DOI] [PMC free article] [PubMed] [Google Scholar]
- 6.Betzig E, et al. Science. 2006;313:1642–1645. doi: 10.1126/science.1127344. [DOI] [PubMed] [Google Scholar]
- 7.Hess ST, Girirajan TPK, Mason MD. Biophys J. 2006;91:4258–4272. doi: 10.1529/biophysj.106.091116. [DOI] [PMC free article] [PubMed] [Google Scholar]
- 8.Folling J, et al. Nat Methods. 2008;5:943–945. doi: 10.1038/nmeth.1257. [DOI] [PubMed] [Google Scholar]
- 9.Heilemann M, van de Linde S, Mukherjee A, Sauer M. Angew Chem Int Ed Engl. 2009;48:6903–6908. doi: 10.1002/anie.200902073. [DOI] [PubMed] [Google Scholar]
- 10.Dempsey GT, Vaughan JC, Chen KH, Bates M, Zhuang XW. Nat Methods. 2011;8:1027. doi: 10.1038/nmeth.1768. [DOI] [PMC free article] [PubMed] [Google Scholar]
- 11.Patterson G, Davidson M, Manley S, Lippincott-Schwartz J. Annu Rev Phys Chem. 2010;61:345–367. doi: 10.1146/annurev.physchem.012809.103444. [DOI] [PMC free article] [PubMed] [Google Scholar]
- 12.Hoyer P, Staudt T, Engelhardt J, Hell SW. Nano Lett. 2011;11:245–250. doi: 10.1021/nl103639f. [DOI] [PubMed] [Google Scholar]
- 13.Yildiz A, et al. Science. 2003;300:2061–2065. doi: 10.1126/science.1084398. [DOI] [PubMed] [Google Scholar]
- 14.Pertsinidis A, Zhang Y, Chu S. Nature. 2010;466:647–651. doi: 10.1038/nature09163. [DOI] [PubMed] [Google Scholar]
- 15.Tiers GVD, Wiese JA. 3,916,069. USA Patent No. 1975
- 16.Kundu K, et al. Angew Chem Int Ed Engl. 2009;48:299–303. doi: 10.1002/anie.200804851. [DOI] [PMC free article] [PubMed] [Google Scholar]
- 17.Vogelsang J, et al. Chemphyschem. 2010;11:2475–2490. doi: 10.1002/cphc.201000189. [DOI] [PubMed] [Google Scholar]
- 18.Ries J, Kaplan C, Platonova E, Eghlidi H, Ewers H. Nat Methods. 2012;9:582. doi: 10.1038/nmeth.1991. [DOI] [PubMed] [Google Scholar]
- 19.Engelhardt J, et al. Nano Lett. 2011;11:209–213. doi: 10.1021/nl103472b. [DOI] [PubMed] [Google Scholar]
- 20.Enderlein J, Toprak E, Selvin PR. Optics Express. 2006;14:8111–8120. doi: 10.1364/oe.14.008111. [DOI] [PubMed] [Google Scholar]
- 21.Huang B, Jones SA, Brandenburg B, Zhuang X. Nat Methods. 2008;5:1047–1052. doi: 10.1038/nmeth.1274. [DOI] [PMC free article] [PubMed] [Google Scholar]
- 22.Huang B, Wang W, Bates M, Zhuang X. Science. 2008;319:810–813. doi: 10.1126/science.1153529. [DOI] [PMC free article] [PubMed] [Google Scholar]
- 23.Bates M, Huang B, Dempsey GT, Zhuang X. Science. 2007;317:1749–1753. doi: 10.1126/science.1146598. [DOI] [PMC free article] [PubMed] [Google Scholar]
- 24.Galston AW. Proc Natl Acad Sci U S A. 1949;35:10–17. [PubMed] [Google Scholar]
- 25.Vogelsang J, et al. Angew Chem Int Ed Engl. 2008;47:5465–5469. doi: 10.1002/anie.200801518. [DOI] [PubMed] [Google Scholar]
- 26.Rasnik I, McKinney SA, Ha T. Nat Mathods. 2006;3:891–893. doi: 10.1038/nmeth934. [DOI] [PubMed] [Google Scholar]
- 27.Patil PV, Ballou DP. Anal Biochem. 2000;286:187–192. doi: 10.1006/abio.2000.4802. [DOI] [PubMed] [Google Scholar]
Associated Data
This section collects any data citations, data availability statements, or supplementary materials included in this article.