Abstract
Techniques for measuring cerebral perfusion require accurate longitudinal relaxation (T1) of blood, a MRI parameter that is field dependent. T1 of arterial and venous human blood was measured at 7T using three different sources – pathology laboratory, blood bank and in vivo. The T1 of venous blood was measured from sealed samples from a pathology lab and in vivo. Samples from a blood bank were oxygenated and mixed to obtain different physiological concentrations of hematocrit and oxygenation. T1 relaxation times were estimated using a three-point fit to a simple inversion recovery equation. At 37° C, the T1 of blood at arterial pO2was 2.29 ± 0.1 s and 2.07 ± 0.12 at venous pO2. The in vivo T1 of venous blood, in three subjects, was slightly longer at 2.45 ± 0.11s. T1 of arterial and venous blood at 7T was measured and found to be significantly different. The T1 values were longer in vivo than in vitro. While the exact cause for the discrepancy is unknown, the additives in the blood samples, degradation during experiment, oxygenation differences, and the non-stagnant nature of blood in vivo could be potential contributors to the lower values of T1 in the venous samples.
Keywords: blood, T1, inversion recovery, oxygenation, 7T, human
INTRODUCTION
The spin-lattice relaxation time, T1, of blood is an important MR parameter for several quantitative MRI methods such as Arterial Spin Labeling (1), Vascular Space Occupancy (VASO) (2,3) and inflow VASO (iVASO) (3). T1 values vary with field strength (4-10), and measurements of T1 of blood in vivo are not simple. The T1 measurement is confounded by blood flow, and also is dependent on the oxyhemoglobin and hematocrit concentration in the blood. Most previous studies have been conducted, using venous bovine blood to measure the T1 of blood at 3T, 4.7T and 7 T (11,12) while recently T1 of venous blood was measured in vivo at 1.5T (5), and in the jugular vein at 3T(13). While Rooney et al. (6), estimated the T1 of human venous blood (1.385B 0.3400) ~ 2.6 s, recent work by Dobre et al. (11), has measured the longitudinal relaxation in bovine blood to be about 2.2s at 7T. In this work, we report T1 values for arterial and venous human blood from three different sources at 7T and we quantify the effects of temperature, oxygenation, hematocrit volume, and pH on T1 values of human blood.
MATERIAL AND METHODS
T1 measurements were conducted on blood samples obtained from 3 different sources of human blood as approved by the Institutional Review Board at the University Medical Center. De-identified, packed whole blood was obtained from the blood bank and transported in a temperature-controlled box. These venous samples (sO2 = 60 ~ 67%) were centrifuged at 2500 rpm, 4°C for 13 minutes, and plasma and hematocrit were mixed together to range from 30 - 44% hematocrit by volume. A customized aerator was used to bubble pure oxygen gas into the venous samples to obtain arterial blood (sO2 = 94 – 99 %). Oxygen gas was bubbled for about 10 minutes through a sealed cylinder containing venous blood. The samples (n=7) were transferred to vacutainer tubes and imaged in a Philips® Achieva 7T scanner at 25°C. Some samples were heated to 34°C (n=2) and to body temperature (37°C, n = 5) using a water bath for the complete duration of the scan. A thermo-chromic thermometer (Apothecary Products Inc., Minneapolis, MN) was pasted on the samples to measure temperature of the samples inside the magnet. De-identified, sealed samples (n = 4) of venous whole blood, collected from patients in the clinic, were also imaged using the same protocol. Unlike the whole blood obtained from the blood bank, the composition of these blood samples was intact and had only heparin as an additive. T1 was also measured in the blood in sagittal sinus in 3 subjects in vivo, using the same inversion recovery protocol as that of the samples.
Imaging Protocol
Imaging data was acquired immediately after sample preparation. Voxel size = 2×2×3 mm3 (in vivo, 1 slice), 2.5×2.5×3 mm3 (samples, 5 slices), TR/TE = 7000/5.3ms, TI = 300, 500 700, 900,1100, 1500, 1900, 2100, 2300 and 3400 ms. Temperature was maintained at 37°C using a water bath. An adiabatic non-selective inversion pulse was used in this protocol. Data at very long TI were not acquired due to the long acquisition time of this experiment, sedimentation of the red blood cells and deterioration of the sample over time. However, we believe that this does not affect the calculated T1 value significantly. The imaging slice was chosen in the middle of the samples to minimize the effect of sedimentation at the top and bottom of the tubes. The samples were inspected visually for obvious sedimentation effects.
Analysis
25-40 voxels in the center of each test-tube were selected. T1 values were obtained using a 3-parameter model to fit the absolute signal intensities, using MATLAB (Mathworks, Natick, MA), for an inversion recovery sequence using the following inversion recovery equation:
| (1) |
S0 is the steady state signal intensity. S is the signal intensity at the inversion time, TI. θ is the inversion angle. Fitting for the three parameters, S0, T1 and θ allow to correct for any inconsistencies due to imperfect inversion pulses. Relaxivity values (1/T1) for arterial (A), venous (V) and venous samples obtained from the clinic (VP) were compared at three different temperatures settings. Correlation of R1 values to oxygenation (sO2), hematocrit concentration (Hct), and pH was assessed.
RESULTS
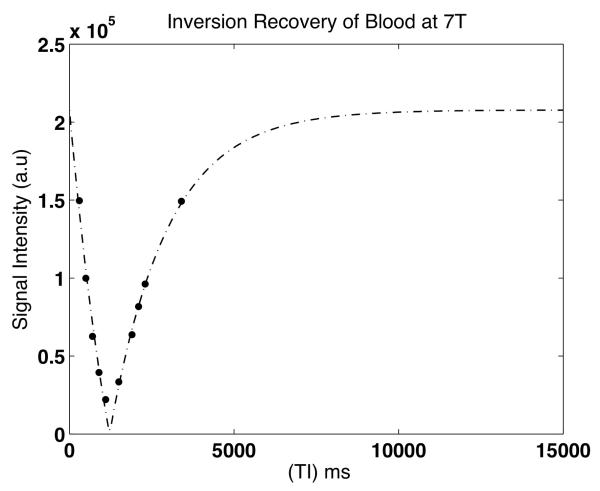
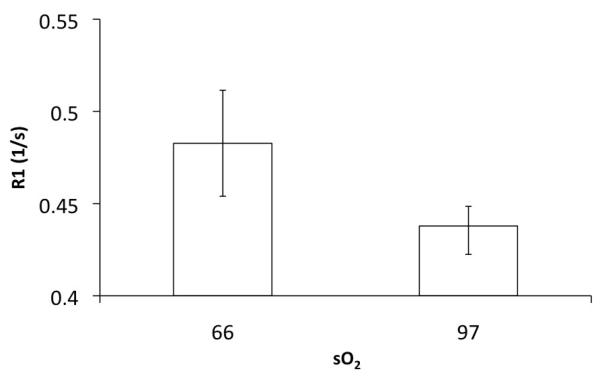
The longitudinal relaxation of human arterial blood obtained from the blood bank at 7T was 2.29 ± 0.1 s while that of venous blood was 2.09 ± 0.12 s at 37° C, significantly different from arterial blood (P = 0.03). Figure 1 depicts a representative inversion recovery curve for one of the samples used in this study. Fig 1b explores the dependence of blood oxygen saturation on the relaxation rate (1/T1) of blood. Venous blood was obtained at a sO2 of ~ 66%. Upon oxygenation, the recorded sO2 values ranged from 95.6 – 99.1 for the arterial blood. R1a (relaxation rate of arterial blood) values were averaged over this range. R1a was significantly reduced (p = 0.03) when compared to R1v (relaxation rate of venous blood). The heparinized venous samples from the clinic (VP) had a T1 of 2.16 ± 0.1 s but did not significantly differ (P = 0.4) from those of the venous blood (V) from the blood bank. However, the T1 of venous blood calculated in the sagittal sinus in vivo was 2.45 ± 0.11s and higher than in the samples. The whole blood samples obtained from the blood bank contain additives including AS3 (extended storage preservative solution) with sodium chloride, dextrose, adenine, trisodium citrate, citric acid and sodium phosphate. The additives are known to reduce the pH of blood slightly, which further reduces with lactic acid production. There could also be a slight degradation of the samples over the duration of the experiment thereby altering the longitudinal relaxation. Significant inflow of fresh spins into the voxels of interest might alter the measured signal intensity and potentially, the estimated T1 value. In the in vivo experiment, since a global inversion pulse was used to null the blood signal in the entire brain volume, these effects were partly mitigated (8). Any residual effects of flow in the sinus were neglected in this study.
Figure 1a.
Representative inversion recovery curve for human blood sample at 7T using three parameter fitting.
Figure 1b.
Dependence of R1 on oxygen saturation (n = 5, each group)
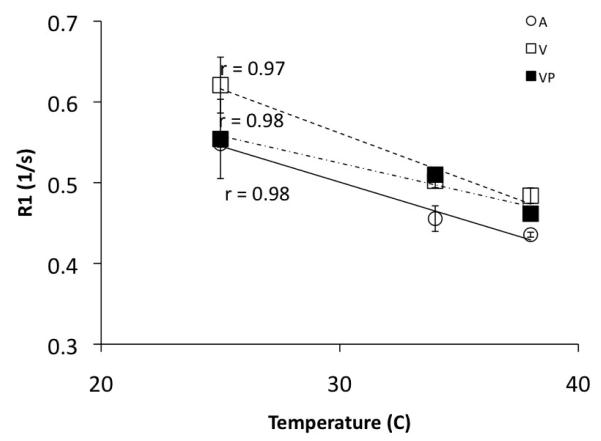
Figure 2 shows the dependence of the R1 of blood on temperature. R1a decreased from 0.55 ± 0.01 s at room temperature (25°C) to 0.43 ± 0.01 s at 37°C. Similarly, the R1 of venous blood obtained from the blood bank decreased from 0.62± 0.03 s at 25° C to 0.48 ± 0.01 s at 37° C. Similar results were obtained for the sealed samples of VP. Evaluation of the relationship between T1 and temperature shows that T1 of blood at 7T is more sensitive to temperature increases than at 3T (8).
Figure 2.
Temperature dependence of R1 of blood. (A = Arterial blood from blood bank, VP = Venous from pathology lab in the clinic, V = Venous blood from blood bank). @ Hct = 43, T1 (7T) = 37.4(°C) + 899.5. T1 (3T) = 22.3(°C) + 919.4 (8)
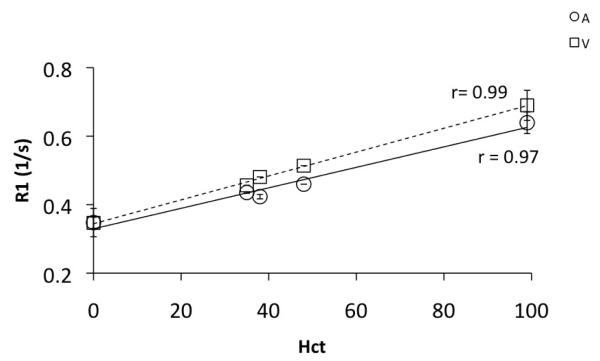
Dependence of R1 on hematocrit concentration (Hct) was also evaluated for the blood obtained from the blood bank. Figure 3 shows the relationship between relaxation rate of blood and the hematocrit concentration. The R1 of both arterial and venous blood increased as the hematocrit concentration was increased. R1 of a mixture of blood plasma and the AS3 additive, obtained after centrifuging was measured as the ‘zero Hct’ fluid. On the other hand, the sediments from the centrifuge were used for measuring R1 of only the packed cells (Hct ~95-100). Our data shows that compared to 3T(8), R1 of blood shows a slower rate of change with increasing Hct. This is consistent with the finding that whole blood and plasma relaxation rates change at a different rate at different fields(14). R1 of plasma is significantly different from whole blood at lower field strengths and is likely to increase rapidly with increased Hct. On the contrary, an increase in Hct increases R1 at higher fields at a rate lower than that observed at low B0. This can also be observed in the study by Lin et al. (15) at 11.7T.
Figure 3.
Relaxivity (1/T1) of arterial (A, R1a) and venous (V, R1v) blood as a function of hematocrit concentration. Relaxivity increases (T1 decreases) as Hct increases linearly in both arterial and venous blood. This study, Hct: 0 – 100, R1a(7T) = 0.34(Hct) + 0.34, R1v(7T)=0.29(Hct) + 0.33, @3T(8) Hct: 32 – 48, R1a(3T) = 0.8Hct + 0.28, R1v(3T)=0.5(Hct) + 0.38
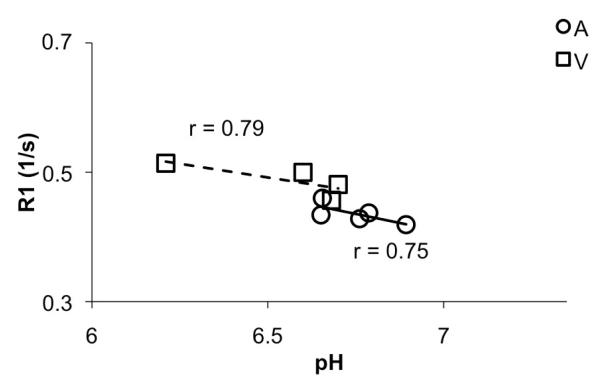
We examined the dependence of R1a and R1v on pH. Our samples had a slightly reduced pH due to the presence of additives and storage. However, Figure 4 clearly shows the venous samples had a lower pH than the arterial samples. Further, R1 values decreases as pH increased, thereby accounting for the reduced T1 values in the samples, compared to the in-vivo data. Therefore addition of additives, reduced pH, absence of flow in the samples could potentially explain the discrepancies in the R1 values calculated in vivo and in vitro.
Figure 4.
R1 dependence on pH
DISCUSSION
The longitudinal relaxation time of human blood was measured and the dependences of R1 on oxygen saturation, temperature, hematocrit, and pH were studied in various sources of human blood at 7T. The T1 of arterial blood was significantly longer than that of venous blood samples. The in vivo T1 value of venous blood was much longer than that of the samples for reasons outlined above. Alternatively, a fast imaging approach outlined by Varela et al. (16) could be used to verify discrepancies in the measurements. Consistent with the literature, R1 decreases with temperature, oxygenation, and pH increases and increases with increase in hematocrit concentration. Comparing the temperature dependence of T1 at 3T by Lu et al. (8), to our study at 7T shows that T1 is more sensitive to temperature differences at 7T. These data will enable the use of appropriate sequence timing parameters at 7T for techniques such as ASL, VASO and iVASO and black blood imaging that rely on efficient nulling of the blood signal.
ACKNOWLEDGEMENTS
The authors would like to thank Dr. Samir Aleryani from the Department of Pathology, Eileen Ricker and Mary Johnson from the Blood Bank at Vanderbilt University for their assistance with the supply of blood samples. The authors are also grateful to Chaohui Tang at Vanderbilt University Institute of Imaging Science for her help with sample preparation.
Grant Support: This work was supported by National Institutes of Health EB000461 (JCG).
Footnotes
Publisher's Disclaimer: This is a PDF file of an unedited manuscript that has been accepted for publication. As a service to our customers we are providing this early version of the manuscript. The manuscript will undergo copyediting, typesetting, and review of the resulting proof before it is published in its final citable form. Please note that during the production process errors may be discovered which could affect the content, and all legal disclaimers that apply to the journal pertain.
REFERENCES
- 1.Detre J, Leigh J, Williams D. W. K. Perfusion Imaging. Magn Reson Med. 1992;23(9) doi: 10.1002/mrm.1910230106. [DOI] [PubMed] [Google Scholar]
- 2.Lu H, Golay X, Pekar J. P.C.M. v. Functional Magnetic Resonacne Imaging Based on Changes in Vascular Space Occupancy. Magn Reson Med. 2003;50:12. doi: 10.1002/mrm.10519. [DOI] [PubMed] [Google Scholar]
- 3.Hua J, Qin Q, Donahue M, Zhou J, Pekar J. P.C.M. vZ. Inflow-based Vascular Space Occupancy(iVASO) MRI. Magn Reson Med. 2011;66(1):17. doi: 10.1002/mrm.22775. [DOI] [PMC free article] [PubMed] [Google Scholar]
- 4.Stanisz G, Odrobina E, Pun J, Escaravage M, Graham S, Bronskill M. M H. T1, T2 Relaxation and Magnetization Transfer in Tissue at 3T. Magn Reson Med. 2005;54(3):6. doi: 10.1002/mrm.20605. [DOI] [PubMed] [Google Scholar]
- 5.Spees W, Yablonsky D, Oswood MC, Ackerman J. Water proton MR properties of human blood at 1.5 Tesla: Magnetic susceptibility, T1, T2, T2* image, and non-Lorentzian signal behavior. MRM. 2001;45(4):10. doi: 10.1002/mrm.1072. [DOI] [PubMed] [Google Scholar]
- 6.Rooney WD, Johnson G, Li X, Cohen ER, Kim SG, Ugurbil K, SC Magnetic field and tissue dependencies of human brain longitudinal 1H2O relaxation in vivo. Magn Reson Imag. 2007;57(2):308–318. doi: 10.1002/mrm.21122. [DOI] [PubMed] [Google Scholar]
- 7.Lu H, Golay X, Pekar J. PCM v. Functional Magnetic Resonacne Imaging Based on Changes in Vascular Space Occupancy. Magn Reson Med. 2003;50:12. doi: 10.1002/mrm.10519. [DOI] [PubMed] [Google Scholar]
- 8.Lu H, Clingman C, Golay X. PCM v. Determining Longitudinal Relaxation Time (T1) of Blood at 3.0 Tesla. Magn Reson Med. 2004;52(4):679. doi: 10.1002/mrm.20178. [DOI] [PubMed] [Google Scholar]
- 9.Dobre M, Uğurbil K. M M. Determination of Blood Longitudinal Relaxation Time (T1) at High Magnetic Field Strengths. Magn Reson Imag. 2007;25(5):3. doi: 10.1016/j.mri.2006.10.020. [DOI] [PubMed] [Google Scholar]
- 10.Barth M, Moser E. Proton NMR relaxation times of human blood samples at 1.5 T and implications for functional MRI. Cell Mol Biol. 1997;43(5):783–791. [PubMed] [Google Scholar]
- 11.Dobre M, Uğurbil K. M. M. Determination of Blood Longitudinal Relaxation Time (T1) at High Magnetic Field Strengths. Magn Reson Imag. 2007;25(5):3. doi: 10.1016/j.mri.2006.10.020. [DOI] [PubMed] [Google Scholar]
- 12.Lu H, Clingman C, Golay X. P.C.M. vZ. Determining Longitudinal Relaxation Time (T1) of Blood at 3.0 Yesla. Magn Reson Med. 2004;52(4):679. doi: 10.1002/mrm.20178. [DOI] [PubMed] [Google Scholar]
- 13.Qin Q, Strouse J. P.C.M. vZ. Fast Measurement of Blood T1 in the Human Jugular Vein at 3 Tesla. Magn Reson Med. 2011;65(5):8. doi: 10.1002/mrm.22723. [DOI] [PMC free article] [PubMed] [Google Scholar]
- 14.Persson BRR, Malmgren L, LG S. Paramagnetic Ions Affect Relaxation Rate Dispersion of Blood: Implications for Magnetic Resonance Relaxation Dispersion Imaging. J Biomengineer & Biomedical Sci. 2012;2(1):105–113. [Google Scholar]
- 15.Lin A-L, Qin Q, Zhao X. T D. Blood longitudinal (T1) and transverse (T2) relaxation time constants at 11.7 Tesla. MAGMA. 2012;25(3):245–249. doi: 10.1007/s10334-011-0287-2. [DOI] [PMC free article] [PubMed] [Google Scholar]
- 16.Varela M, Hajnal JV, Pteresen ET, Golay XT, Merchant N, DJ L. A method for rapid in vivo measurement of blood T1. NMR Biomed. 2011;24(1):9. doi: 10.1002/nbm.1559. [DOI] [PubMed] [Google Scholar]


