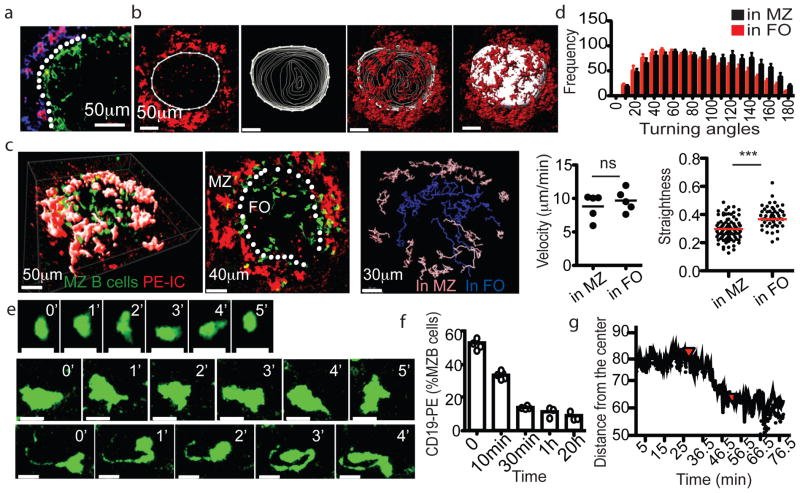
Figure 2. MZ B cells are migratory and exhibit long membrane processes.
(a) Figure 4. Splenic FO B cell migration and S1PR1 requirement for exit a) Spleen section showing PE-IC (red), SIGN-R1 (blue) and CD169 (green) distribution two hours after PE-IC injection. White dotted line indicates location of sinus. (b) Generation of MZ-FO boundary surface. Left image shows an example contour drawn ~10μm internal to the PE-ICs to represent the boundary in a single x–y slice (3μm). Middle images show contours drawn for each slice in the 60μm z stack. Right image shows final surface with overlaid PE-IC stain. (c) TPLSM of GFP+ MZ B cells in reconstituted CD19−/− spleen. Left panel shows a 57μm z-projection view. Middle panel shows a 30μm slice from the center of this region. Location of marginal sinus is indicated (white dotted line). Right, representative classification of MZ B cell tracks based on positioning with respect to surface. Pink, in MZ; blue, in FO. (d) Median velocity, distribution of turning angles and straightness of MZ B cells (5 data sets from 3 mice). (e) Time-lapse images of two MZ B cells (middle and bottom panels) compared with a FO B cell (top panels). All cells are GFP+. Scale bars, 10μm. (f, g) Kinetics of MZ B cell displacement into the FO following FTY720 treatment. (f) Frequency of in vivo anti-CD19-PE labeled MZ B cells at the indicated time after FTY720 injection (n=6 mice), detected by flow cytometry. (g) Average distance of GFP+ MZ B cells from the most center point over time during TPLSM imaging. Red arrow at 25 min, time of FTY720 injection. (Second red arrow, time of anesthetic reinjection). In d, c, f, bars or lines indicate means (error bars, SEM). *** p<0.0005 and ns, not significant (p>0.05) by unpaired Student’s t-test.

