

Background: The significance of Pak1 in prostate cancer remains unclear.
Results: Pak1 knockdown impaired prostate tumor growth via increased expression of TGFβ and reduced secretion of MMP9.
Conclusions: We demonstrated that Pak1 is a more potent mediator of prostate cancer cell migration and tumor growth than Pak6, the predominant isoform in the prostate.
Significance: A novel role of Pak1 in prostate cancer is identified.
Keywords: Cancer Therapy, Cell Signaling, Matrix Metalloproteinase (MMP), Prostate Cancer, Transforming Growth Factor β (TGFβ), MMP9, Pak1, Pak6
Abstract
P21-activated kinases (Paks) are major effectors downstream of the small Rho family of GTPases. Among the six isoforms, Pak1 is the most ubiquitous and the best characterized member. Previous studies have shown that inhibition of Pak6, which is predominantly present in the prostate compared with other tissues, inhibits prostate tumor growth in vivo. Even though Pak1 has been identified in normal prostatic epithelial cells and cancer cells, its specific role in the development of prostate cancer remains unclear. We report here that highly invasive prostate cancer cells express significantly higher levels of Pak1 protein compared with non-invasive prostate cancer cells. Furthermore, prostate tumor tissues and prostate cancer metastasized to lungs showed a higher expression of Pak1 compared with normal tissues. Interestingly, Pak6 protein expression levels did not change with the invasive/metastatic potential of the cancer cells or tumors. Although inhibition of Pak1, and not Pak6, resulted in impaired PC3 cell migration, the effects of Pak1 knockdown on transendothelial migration (microinvasion), tumor growth, and tumor angiogenesis was higher compared with Pak6 knockdown. Finally, gene array data revealed reduced expression of matrix metalloproteinase 9 with the ablation of either Pak1 or Pak6 gene expression in PC3 cells, whereas protein levels of TGFβ was elevated significantly with specific modulation of Pak1 activity or ablation of the Pak1 gene. Our observations suggest that although some level of functional redundancy exists between Pak1 and Pak6 in prostate cancer cells, targeting Pak1 is a potential option for the management of prostate tumor growth, microinvasion, and metastasis.
Introduction
P21-activated kinases (Paks)2 are a family of six serine-threonine kinases that are categorized into group I and group II Paks on the basis of their mechanism of activation (1). Group I Paks differ from their group II counterparts on their activation by small Rho GTPases such as Rac and cdc42 (2) as well as their specific involvement in inducing cytoskeletal changes and lamellipodia and filopodia formation in mammalian cells in the promotion of cell motility (1, 3). Group II Paks lack the auto inhibitory domain, acidic and Pix-binding regions, as well as the cdc42/Rac interacting binding (CRIB) domain, which are present in all group I Pak isoforms (4–6).
Among the Pak isoforms, group I Paks (Pak1 and Pak2 in particular) are the best characterized and most deregulated in cancers (1, 3). We have shown previously that Pak1 is necessary for inducing cytoskeletal changes in normal cells (7) and in reconciling the effects of the Akt and ERK pathways, two major pathways deregulated in multiple cancers, thus mediating oncogenic transformation (8). Although present in the prostate, group I Paks are the least studied in prostate cancer, probably because the prostate is known for its higher expression of group II Paks, Pak4 and Pak6 (9, 10), which are less expressed and less known for cancer incidences in other tissues. In support of this assumption, inhibition of either Pak4 or Pak6 has been reported to inhibit prostate cancer cell function in vitro and tumor growth in vivo (11, 12). Our recent study has demonstrated that activation of Rac1 driven by the dimerization of protein 14-3-3ζ induces cytoskeletal changes in prostate cancer cells, thus augmenting their motility and transendothelial migration (13), strongly suggesting a role for group I Paks in prostate cancer.
This study was designed to establish the biological significance of the expression of predominant group I Pak isoform Pak1 in prostate cancer cells in comparison with Pak6, the predominant group II counterpart, on tumor growth and transendothelial migration. In addition to the analysis of Pak1 and Pak6 protein expression in human prostate cancer patient samples and cell lines of various tumor and metastatic potential, we generated stable PC3 cells with shRNA-mediated knockdown of Pak1, Pak6, or a combination of both using a lentiviral approach. Cells were then transiently transfected with either control vector (pBabe-Puro) or plasmids expressing constitutively active Pak1 (CA-Pak1, Pak1 E423) or dominant negative Pak1 (DN-Pak1, Pak1 R299). Transfected PC3 cells were used for the analysis of prostate cancer cell functions in vitro, such as migration, proliferation, colony formation, and transendothelial migration (microinvasion) as well as tumor growth in vivo along with quantitative real-time PCR arrays to identify the novel genes involved in the process. Our study demonstrated that Pak1 is necessary for prostate tumor growth and micrometastasis mainly via regulation of prostate cancer cell migration and proliferation through enhanced expression of various tumor-promoting factors such as MMP9 and reduced expression of inhibitors of tumor growth such as TGFβ.
EXPERIMENTAL PROCEDURES
Reagents, Cell Lines, and Antibodies
Human PC3 cells (ATCC) were used and maintained in DMEM (HyClone, Thermo Scientific, Logan, UT) with 10% fetal bovine serum, 100 units/ml penicillin, and 100 μg/ml streptomycin in a 5% CO2 atmosphere at 37 °C. Primary antibodies against Pak1 were purchased from Cell Signaling Technology (Boston, MA). Anti-Pak6 antibody as well as primary antibodies against β-actin and laminin were purchased from Sigma. Anti-HRP secondary antibodies were obtained from Bio-Rad (Hercules, CA). Alexa Fluor secondary antibodies and Alexa Fluor 555-labeled phalloidin were purchased from Invitrogen. ShPak1 and ShPak6 lentiviral particles were purchased from Origene (Rockville, MD).
Transfections
Human LNCaP, PC3, and LNCaP C4-2 cells were transiently transfected with the CA-Pak1 plasmid using Lipofectamine 2000 (Invitrogen) according to the protocol of the manufacturer. LNCaP C4–2 cells were stably transfected with ShPak1 and ShPak6 using lentiviral particles (5 × 10⁹ plaque-forming units) and selected with puromycin (or in a combination of ShPak1 with ShPak6). Scrambled shRNA was used a control.
Processing of Human Prostate Cancer Patient Samples
Tissue blocks of biopsy samples for the normal human prostate, benign prostatic hyperplasia, prostate tumor, and prostate cancer metastasized to lymph node and lung tissues were obtained from the Department of Pathology of the Charlie Norwood Veterans Affairs Medical Center in Augusta, Georgia with the approval of the Georgia Health Sciences University Institutional Review Board and Veterans Affairs Medical Center Department of Research and Development. Tissue samples were subjected to immunohistochemical analysis of Pak1 and Pak6 using Diaminobenzidine (DAB) staining kit (Invitrogen) to unveil their intratissue and intracellular localization compared with H&E-stained sections. The percentage of Pak1- or Pak6-positive areas in prostate cancer and lung metastasis samples was determined by National Institutes of Health ImageJ software.
Migration Assay
Migration assays were performed as described previously (14). Briefly, prostate cancer cells, after stable and transient transfections, were grown on 12-well plates either with or without specific ECM proteins (1 μg/ml) to reach confluence (∼12 h) and then serum-starved for 3 h. A scratch was made in the monolayer, and pictures were taken at 0, 12, and 24 h. The rate of migration (as measured by scratch recovery) was calculated using the equation (1-Tf/T0) × 100, where Tf is the area at the end point and T0 is the area at time 0. Depending upon the conditions in individual experiments, treatments were used as follows: 5, 10, and 15 μm IPA3 (Pak1 inhibitor) for 12 and 24 h and 0.1, 1.0, and 5.0 ng/ml of TGFβ.
Transendothelial Migration Assay
Transendothelial migration of prostate cancer (PC3) cells was measured using electric cell substrate impedance sensing (ECIS) equipment (14) with human dermal microvascular endothelial cells (ATCC) plated on 8W10E+ array chips (Applied Biophysics, Troy, NY). Following this, control PC3 as well as transfected cells were directly added onto endothelial cell monolayer at a density of 5 × 10⁴ cells/well in 50 μl of medium. Cells were detached from plate by using cell dissociation buffer (20 mm EDTA in PBS (pH 7.4)) to avoid integrin/receptor loss because of trypsin digestion. Real-time measurements on the transendothelial migration of PC3 cells were recorded by ECIS up to 12 h.
Immunocytochemistry
The immunofluorescence staining of the cells was performed as described previously (7). Briefly, PC3 cells, after stable transfections or treatment with IPA3 inhibitor, were plated on cell culture chamber slides (Fisher Scientific, Pittsburgh, PA) followed by fixation with 1% paraformaldehyde in PBS. Cells were permeabilized with 0.1% Triton X-100 in PBS. The nonspecific staining was blocked with 2% BSA for 1 h at room temperature. The fixed and permeabilized cells were incubated with standardized dilution Alexa Fluor 555-labeled phalloidin applied for 30 min at room temperature and washed. The slides were mounted with Vectashield (Vector Laboratories), and the images were taken by a Zeiss fluorescent microscope (Zeiss Axiovert100M, Carl Zeiss, Germany).
Cell Proliferation Assay
Proliferation of PC3 cells was determined using the nonradioactive BrDU-based cell proliferation assay (Roche) according to the protocol of the manufacturer. Briefly, PC3 cells, after stable and transient transfections, were seeded in 96-well plates at a density of 5 × 10³cells/well. After 12 h, the cells were subject to a 5-bromo-2-deoxyuridine assay using the BrDU Labeling and Detection Kit III (Roche) according to the protocol of the manufacturer. BrDU incorporation into the DNA was determined by measuring the absorbance at both 450 and 690 nm on an ELISA plate reader. The data are presented as mean ± S.D. (n = 3).
Colony Formation Assay
The colony formation assay was performed using a standardized protocol in the laboratory (15). In this approach, PC3 cells, after stable and transient transfections, were cultured on 12-well plates. Five days after transfection, each of the wells was examined for the number of colonies and compared with the control. The plates were fixed using crystal violet and counted visually or using ImageJ software. The data are presented as mean ± S.D. (n = 3).
In Vivo Nude Mouse Tumor Xenograft Model
All animal procedures were performed according to the protocol approved by the Institutional Animal Care and Use Committee at the Charlie Norwood Veterans Affairs Medical Center, Augusta, Georgia (protocol 09-07-011 dated July 10, 2009). PC3 cells, after stable transfection with either ShPak1 or ShPak6, were grown to confluence in 250-ml flasks. Cells were resuspended in saline to a concentration of 1.7 × 10⁷/ml. Cell suspension (100 μl) was injected subcutaneously into 8-week-old nude mice (athymic nude mice; Harlan, Indianapolis, IN) (16). The respective controls were injected intraperitoneally with 0.9% saline. Mice were sacrificed on day 20, and tumors were dissected, weighed, and snap-frozen using dry ice for further processing to use in Western blot analysis or quantitative real-time PCR.
Immunohistochemistry
Immunofluorescence staining of the tumor sections for Ki67 (proliferation) and laminin (blood vessels) was performed according to the protocol of the manufacturer (Sigma). Briefly, formalin-fixed, frozen prostate (PC3) xenograft tumor sections from nude mice were subjected to the standard xyline ethanol dehydration process and permeabilized with 0.3% Triton X-100 in 1× PBS. The nonspecific staining was blocked with 5% goat serum for 1 h at room temperature. The dehydrated, permeabilized, and blocked tissue sections were incubated with primary antibody against Ki67 antigen (dilution 1:1000) or laminin (dilution 1:1000) overnight at 4 °C followed by washing with 1× PBS (4 times for 15 min each). Next, anti-mouse Alexa Fluor 488-labeled secondary antibodies (1:500) were applied for 1 h at room temperature and washed four times for 15 min with 1× PBS. The slides were mounted with Vectashield (Vector Laboratories), and the images were taken by a Zeiss fluorescent microscope (Zeiss Axiovert100M, Carl Zeiss).
Quantitative Real-time PCR Arrays
PC3 cells stably transfected with either ShPak1 or ShPak6 were grown until reaching 75% of confluence in 6-well plates and subjected to RNA isolation, followed by cDNA synthesis and quantitative PCR (15). Briefly, cells were lysed, and RNA was isolated according to the protocol of the manufacturer using the RNAeasy Plus mini kit (Qiagen, Valencia, CA). Next, 25 μl of cDNA was produced by RT2 First Strand kit (SABioscience, Frederick, MD), mixed with quantitative PCR SYBR Green master mix and loaded into the Human Cancer Pathway RT2 Profiler PCR Array (catalog no. PAHS-033, SABiosciences), which detects 85 different cancer-related gene expression changes per array, and the data were normalized to eight different housekeeping genes. Reading was completed in an Eppendorf Mastercycler Realplex 2 instrument.
Western Blot Analysis
Whole cell lysates were prepared using lysis buffer (50 mm Tris-HCl (pH 7.4), 1% Triton X-100, 150 mm NaCl, 1 mm EDTA, 2 mm Na3VO4, and 1× complete protease inhibitors (Roche)). Proteins from sample paraffin tissue blocks were extracted using the protocols established previously (17–18). The protein concentration was measured by Dc protein assay (Bio-Rad). Approximately 30 μg of tissue lysates and 45 μg of cell lysates were used for loading onto the Western gel apparatus. Western analyses were performed using the standard Laemmle's method as done previously (19). Densitometry was done using National Institutes of Health ImageJ software.
Statistical Analysis
All the data are presented as means ± S.D. To determine significant differences between treatment and control values, we used Student's two-tailed t test. The significance was set at 0.05 levels (marked with symbols wherever data are statistically significant).
RESULTS
Because the expression levels of Pak1 in various prostate cancer cells is not yet known, we first examined the protein levels of Pak1 in comparison with Pak6, the predominant Pak isoform expressed in prostate gland, in various androgen-dependent lymph-node Cancer of the Prostate (LNCaP) and androgen-independent (LNCaP C4-2, PC3, and VCaP) prostate cancer cell lines. In agreement with the previous reports, robust expression of Pak6 was observed in prostate cancer cells of all stages. Because of the possible differences in the specificities of the antibodies, it was not practically possible to determine from our data which among the Pak1 and Pak6 is the predominantly expressed isoform in prostate cancer cells. Interestingly, although protein expression levels of Pak6 was constant in all cell lines we tested, Pak1 expression was observed to be significantly higher in invasive/metastatic prostate cancer cells as compared with non-invasive LNCaP cells (Fig. 1, a and b).
FIGURE 1.

Pak1 controls micrometastasis of prostate cancer cells. a and b, Western blot analysis showing expression levels of Pak1 and Pak6 in human prostate cancer LNCaP, PC3, LNCaP C4-2, and VCaP cell lines normalized to β-actin. c, stable human prostate cancer (PC3) cells expressing shRNA for scrambled (control), Pak1, or Pak6 were made using lentiviral particles following selection with puromycin. Control PC3 cells as well as those expressing ShPak1 and ShPak6 were also transiently transfected with control vector (pBabe-Puro) or constitutively active Pak1 (CA-Pak1, Pak1 E423). c, Western blot analysis of control and transfected PC3 cells with antibodies specific for Pak1, Pak6, and β-actin. d and e, transendothelial migration (microinvasion) of prostate cancer (PC3) cells was measured using ECIS equipment with human dermal microvascular endothelial cells plated on 8W10E+ array chips (14). Control and transfected PC3 cells, detached from the plate by using cell dissociation buffer (20 mm EDTA in PBS (pH 7.4)) to avoid receptor loss because of trypsin digestion, were directly added onto the endothelial cell monolayer at a density of 5 × 10⁴ cells/well in 50 μl serum-free DMEM. Real-time measurements on the transendothelial migration of PC3 cells were recorded by the ECIS up to 5 h. Data are presented as mean ± S.D. n = 3 of triplicate experiments. *, p < 0.001; Δ, p < 0.01; #, p < 0.05 versus control experiments within the same group.
To test the specific role of Pak1 and Pak6 in prostate cancer, we first utilized PC3 cells with shRNA-based knockdown of Pak1 or Pak6 and those transiently expressing the control plasmid or the plasmid encoding CA-Pak1 and subjected them to transendothelial migration (microinvasion) assays on monolayers of human dermal microvascular endothelial cells plated in array chips suitable for measurements in the ECIS equipment. Our data indicated that PC3 cells expressing CA-Pak1 undergo microinvasion more efficiently as compared with cells expressing the control vector (Fig. 1, d and e). Although shRNA-mediated knockdown of both Pak1 and Pak6 significantly impaired microinvasion of PC3 cells, inhibition of Pak1 appeared to be more effective as compared with Pak6 inhibition (Fig. 1, d and e). A combined knockdown of Pak1 and Pak6 did not exhibit an effect beyond the effect of Pak1 knockdown. In contrast, impaired microinvasion of Pak6-deficient PC3 cells was significantly rescued by expression with CA-Pak1, thus indicating that Pak1 predominantly promotes microinvasion of prostate cancer cells.
To confirm our findings from in vitro studies, we utilized normal human prostate, benign prostatic hyperplasia (BPH), and tumor and metastatic (lymph node and lung) biopsy samples and subjected them to immunohistochemical and Western blot analysis for Pak1 and Pak6 expression. In concert with our in vitro findings, Pak6 was expressed in all tissues, with a modest but significant increase in expression in tumor and metastatic tissues (Fig. 2, a–d). Interestingly, Pak1 was relatively less expressed in normal and benign prostatic hyperplasia tissues, but its expression was elevated significantly (∼4-fold) in tumor and metastatic lymph node and lung tissues (Fig. 2, a–d).
FIGURE 2.

Expression of Pak1 and Pak2 are elevated during prostate tumor growth, but only Pak1 is elevated in prostate tumor metastasis in humans. a and b, Western blot analysis showing expression levels of Pak1 and Pak6 in human prostate tumor and metastasized lung tissues normalized to β-actin (n = 3). BPH, benign prostatic hyperplasia. c, immunohistochemical analysis of Pak1 and Pak6 in human prostate cancer and metastasized lung tissues revealing their intratissue and intracellular localization compared with H&E-stained sections. Paraffin-embedded prostate cancer tissues were obtained from the Department of Pathology of the Charlie Norwood Veterans Affairs Medical Center in Augusta and were subjected to immunohistochemistry analysis for Pak1 and Pak6 using a DAB staining kit. d, percentage of Pak1- or Pak6-positive areas in prostate cancer and lung metastasis samples as determined by the National Institutes of Health ImageJ software (n = 6). All data are presented as mean S.D. of n = 4 samples. *, p < 0.001; Δ, p < 0.01; and #, p < 0.05.
Because cell motility in response to ECM proteins is the key for invasion and metastasis of prostate cancer cells, we subjected PC3 cells with Pak1 or Pak6 gene knockdown for a cell migration assay utilizing a monolayer scratch wound healing method (14). Our data indicated that expression of PC3 cells with CA-Pak1 resulted in significantly enhanced migration of PC3 cells on all ECM proteins we tested (Fig. 3, a–f). In contrast, Pak1 knockdown resulted in significantly impaired cell migration (∼4-fold in the absence of ECM proteins and ∼2- to 3-fold inhibition when plated on ECM proteins). Although modest inhibition in PC3 cell migration was observed with Pak6 knockdown, the data were not statistically significant. More importantly, Pak6 knockdown did not reverse the enhanced cell migration of PC3 cells expressing CA-Pak1 (Fig. 3, a–f). Next, we determined whether Pak1 has a differential role to play in androgen-responsive versus androgen-insensitive prostate cancer cells and whether shRNA-mediated Pak1 knockdown leads to any off-target effects. We prepared PC3 cells overexpressing CA-Pak1 or DN-Pak1, LNCaP cells overexpressing CA-Pak1, and LNCaP C4–2 cells with stable shRNA-mediated knockdown of Pak1. Our data indicated that although expression with CA-Pak1 in PC3 and LNCaP cells enhanced cell migration of fibronectin (Fig. 4, a and b), expression with DN-Pak1 in PC3 cells resulted in impaired cell migration (b). In support of this, LNCaP C4–2 cells with stable knockdown of Pak1 exhibited impaired migration on fibronectin (Fig. 4c). Together, our study demonstrated that directional migration of prostate cancer cells is reliant on the activation of Pak1 and not Pak6.
FIGURE 3.

Inhibition of Pak1, but not Pak6, inhibits extracellular matrix-specific directional migration of prostate cancer cells. a–f, stable human prostate cancer (PC3) cells expressing shRNA for scrambled (control), Pak1 or Pak6, and control PC3 cells (pBabe-Puro), as well as cells transiently transfected with constitutively active Pak1 (CA-Pak1, Pak1 E493) were subjected to a migration assay utilizing a monolayer scratch recovery assay. Cells were plated on 12-well pates precoated with ECM proteins (0.5 μg/well) such as fibronectin, vitronectin, laminin, secreted protein acidic and rich in cysteine/osteonectin, and bone sialoprotein/osteopontin, respectively, and treated with 50 μm EGF (R&D Systems, Minneapolis, MN). The data are presented as mean ± S.D. n = 3 of quadruplicate experiments. *, p < 0.001; #, p < 0.05; Δ, p < 0.01 versus control experiments within the same group.
FIGURE 4.

Modulation of Pak1 activity in androgen-responsive and androgen-insensitive prostate cancer cells inhibits directional migration of prostate cancer cells. a–c, human androgen-responsive LNCaP and androgen-insensitive PC3 and LNCaP C4-2 cells were either overexpressed with CA-Pak1 or DN-Pak1 (in the case of PC3 and LNCaP), or made stable cell lines expressing ShPak1 (in the case of LNCaP C4-2) and then subjected to a migration assay on fibronectin in the presence of 50 μm EGF. The data are presented as mean ± S.D. n = 3 of quadruplicate experiments. *, p < 0.001; #, p < 0.05; Δ, p < 0.01; versus control experiments within the same group.
Even though Pak1 has been implicated in the tumor progression and metastasis of multiple cancers (1, 3), group I Paks are the least studied in prostate tumor growth. Hence we attempted to test the efficacy of Pak1 knockdown, in comparison with Pak6, on the growth of PC3 tumor xenografts in an athymic nude mouse model in vivo. Our data indicated that knocking down either Pak1 or Pak6 significantly inhibited prostate tumor growth in vivo ∼4-fold and ∼3-fold, respectively (Fig. 5, a–d). Although our data are in agreement with previous reports that inhibition or gene ablation of group II Paks (Pak4 and Pak6) in mice inhibits prostate tumor growth (9, 11–12), we observed that Pak1 knockdown yielded a higher rate of inhibition on PC3 tumor growth in nude mice as compared with Pak6 (Fig. 5, a–d). To determine the involvement of Pak1 and Pak6 in the regulation of prostate tumor angiogenesis, we subjected the frozen sections from control, Pak1 knockdown, and Pak6 knockdown PC3 tumor xenografts to fluorescence immunohistochemistry with antibodies specific for laminin, an ECM protein abundantly expressed in the vascular basement membrane and a marker for vasculature (20). We observed that the laminin-positive vascular area was significantly less in PC3 cells with impaired Pak1 and Pak6 activities (4-fold and 3-fold, respectively) compared with control cells (Fig. 5, e–f). Interestingly, the impact of Pak1 knockdown on prostate tumor angiogenesis was significantly higher as compared with Pak6 knockdown, thus demonstrating the predominant role of Pak1 in prostate tumor growth as compared with Pak6. Our data also suggests that Pak1 may be a potential mediator of tumor angiogenesis in vivo.
FIGURE 5.

Pak1 is a more potent mediator of prostate tumor growth and angiogenesis in vivo than Pak6. a and b, stable human prostate cancer (PC3) cells expressing shRNA for scrambled (control), Pak1, or Pak6 were implanted subcutaneously into athymic nude mice (Harlan, Indianapolis, IN) at a concentration of 1.5 × 10⁶ cells in 100 μl of sterile saline (16). Images show tumor xenographs collected on day 20. The levels of Pak1 and Pak6 protein expression in the tumor lysates was verified by Western blot analysis. c, tumor measurements were made using a caliper on every fourth day after tumor cell administration until day 20. Shown is quantification of the growth of Sh-control, ShPak1-expressing, and ShPak6-expressing tumor xenografts. The data are presented as mean ± S.D. n = 8. Δ, p < 0.01; #, p < 0.05 versus control group. d, tumors were collected, and weight was measured on day 20. The bar graph shows quantification of tumor weight (g) on day 20. The data are presented as mean ± S.D. n = 8. *, p < 0.001. e, tumor angiogenesis was measured by fluorescent immunohistochemistry analysis of frozen tumor sections using antibodies specific for laminin, and the slides were viewed under a Zeiss fluorescent microscope. Shown are laminin-positive blood vessels in the frozen sections of Sh-control, ShPak1-expressing, and ShPak6-expressing PC3 tumor xenografts. f, bar graph showing quantification of the vascular area using ImageJ software. The data are presented as mean ± S.D. n = 8. Δ, p < 0.01; #, p < 0.05.
Although Pak1 predominantly regulated motility and microinvasion of prostate cancer cells, its effects on other cellular functions in vitro such as proliferation and colony formation appeared similar to that of Pak6. Our data showed that expression with CA-Pak1 significantly enhanced PC3 cell proliferation by 22% and colony formation by 20%. In contrast, knockdown of either Pak1 or Pak6 resulted in an ∼3-fold decrease in the rate of PC3 cell proliferation and colony formation compared with the control (Fig. 6, a and b). A combined knockdown of Pak1 and Pak6 in PC3 cells did not exhibit any added effects on cellular functions. Interestingly, impaired proliferation and colony formation in PC3 cells with Pak6 knockdown was reversed significantly upon coexpression with CA-Pak1 (Fig. 6, a and b). These results corroborated with our findings from tumor xenografts in vivo that showed that the number of Ki67-positive proliferating tumor cells are less in ShPak1 and ShPak6 tumor sections as compared with control tumors (Fig. 6, c and d). Together, these data indicate that the role of Pak1 and Pak6 in the regulation of proliferation and colony formation is highly redundant.
FIGURE 6.
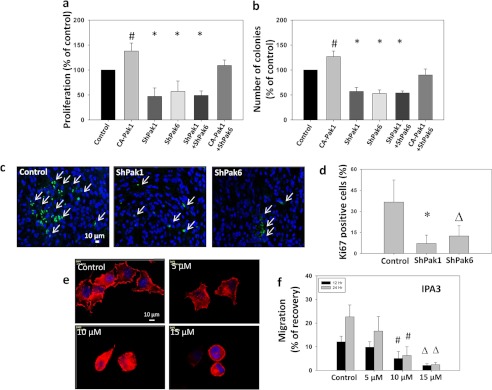
Both Pak1 and Pak6 are necessary for prostate cancer cell proliferation, but only Pak1 is necessary for motility. a, stable human prostate cancer (PC3) cells expressing shRNA for scrambled (control), Pak1 or Pak6, or PC3 cells expressing CA-Pak1 were subjected to proliferation assays. The bar graph shows proliferation of PC3 cells after expression of control vector (pBabe-Puro and Sh-Scrambled), CA-Pak1, ShPak1, and ShPak6, respectively, or in combination of ShPak1 with ShPak6 and CA-Pak1 with a rate of proliferation determined by the measurement of the amount of BrDU incorporated into the PC3 cells (Roche). b, stable human prostate cancer (PC3) cells expressing ShRNA for scrambled (control), Pak1 or Pak6, or PC3 cells expressing CA-Pak1 were subjected to colony (foci) formation assays. The bar graph shows quantification of colonies formed by PC3 cells after expression of control vector (pBabe-Puro), CA-Pak1, ShPak1, and ShPak6, respectively, or in combination of ShPak1 with ShPak6 and CA-Pak1 with ShPak6. c, shown are day 20 PC3 tumor (Scrambled, Sh-Pak1, and ShPak6) xenograft frozen sections stained with Ki67 antibodies. d, bar graph showing the number of Ki67-positive cells in day 20 PC3 tumor (Scrambled, Sh-Pak1, and ShPak6) xenograft frozen sections. e, images of PC3 cells treated with 0, 5, 10, and 15 μm of Pak1 inhibitor IPA3 stained with phalloidin. f, PC3 cells were treated with 0, 5, 10, and 15 μm of Pak1 inhibitor IPA3 and were subjected to a migration assay utilizing a monolayer scratch recovery assay. Cells were plated on 12-well pates precoated with fibronectin (0.5 μg/well) and treated with 50 μm EGF (R&D Systems). All data are presented as mean ± S.D. n = 4 of quadruplicate experiments. *, p < 0.001; Δ, p < 0.01; and #, p < 0.05.
We next determined whether pharmacological inhibition of Pak1 with a specific inhibitor (IPA3) will provide desired results on inhibition of cell migration. Our study indicated that treatment with IPA3 resulted in a dose-dependent inhibition of cytoskeletal organization and cell migration of PC3 cells plated on fibronectin (Fig. 6, e and f), thus indicating the therapeutic potential of Pak1 inhibition for the prevention of prostate cancer invasion.
Because ShRNA-mediated knockdown of Pak1 and Pak6 in PC3 cells resulted in tumor regression, we sought to identify the genes involved in the process. To do that, we performed quantitative real-time PCR-based gene arrays for control, Pak1 knockdown, and Pak6 knockdown PC3 cells using arrays specific for genes involved in the cancer growth and progression. Our gene array analysis identified several candidate genes that are likely involved in the prostate tumor growth, invasion, and metastasis (Fig. 7). Candidate genes with increased expression associated with Pak1 knockdown include angiopoitein1, TGFβ, and tumor necrosis factor 25, whereas expression of genes such as p21/cip1, interferon β1, insulin-like growth factor, metastasis-associated proteins 1/2, integrin α4, and MMP9 were reduced with Pak1 knockdown. In contrast, Pak6 knockdown resulted in increased expression of interleukin-8, MMP2, and thrombospondin1 and reduced expression of MMP9. Among these MMP9 mRNA as well as protein expression was reduced by both Pak1 and Pak6 (Figs. 7 and 8, a–d). To confirm the findings from gene arrays, we subjected tumor lysates for Western blot analysis using specific antibodies against MMP9, MMP2, and TGFβ. Our data indicated that MMP9 protein expression was significantly reduced in PC3 cells with the knockdown of either Pak1 or Pak6 by more than 10-fold. Notably, neither Pak1 nor Pak6 knockdown exhibited any changes in the protein expression levels of MMP2 (Fig. 8, b–c). Interestingly, we observed significant elevation in the protein expression levels of TGFβ (∼3-fold), a widely known tumor suppressive growth factor (21) in PC3 tumors with Pak1 knockdown, but no changes were observed in tumors with Pak6 knockdown (Fig. 8, b–c). We further determined whether these changes occurred within the PC3 cells or in the tumor microenvironment. Our analysis of control and CA-Pak1-expressing PC3 cells indicated reduced protein expression of MMP9 (∼3-fold) and enhanced protein expression of TGFβ (∼4-fold) (Fig. 6, b and d). Finally, we tested the effect of TGFβ on prostate cancer cell motility in vitro. Our results indicated that TGFβ inhibited PC3 cell motility in a dose- and time-dependent manner (Fig. 8e). Together, these data demonstrated that Pak1-mediated prostate tumor growth and invasion involved enhanced MMP9 and reduced TGFβ expression.
FIGURE 7.
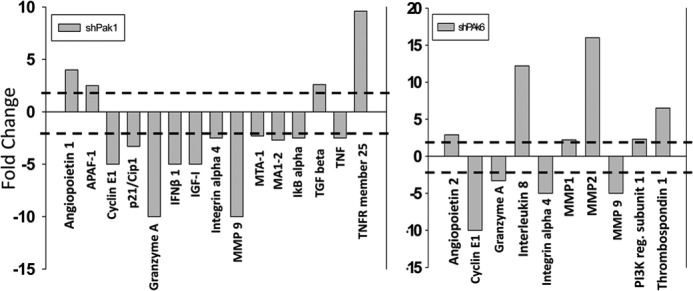
Genes modulated by Pak1 in prostate cancer cells. a, quantitative RT-PCR arrays (SA Biosciences) showing genes up- or down-regulated because of the shRNA-mediated knockdown of Pak1 in PC3 cells. b, quantitative real-time PCR arrays (SA Biosciences) showing genes up- or down-regulated because of the shRNA-mediated knockdown of Pak6 in PC3 cells. A 2-fold difference was considered as a change in gene expression.
FIGURE 8.

Pak1 inhibition results in reduced MMP9 expression and increased TGFβ expression in prostate cancer cells and tumor xenografts. a, stable human prostate cancer (PC3) cells expressing shRNA for scrambled (control), Pak1, or Pak6 were subjected to quantitative real-time PCR arrays for the identification of changes in cancer-related genes according to the protocol of the manufacturer. The chart indicates three major genes whose RNA expression levels were modulated with shRNA-mediated knockdown of either Pak1 or Pak6. b–d, Western blot analysis of PC3 cells expressing Sh-Scrambled, ShPak1, or Sh-Pak6 and those expressing the control plasmid (PBabe-Puro) or CA-Pak1 for the expression of MMP2, MMP9, and TGFβ. Quantification of the changes in the protein expression levels of MMP2, MMP9, and TGFβ normalized to β-actin is also shown. e, PC3 cells were treated with 0, 0.1, 1.0, and 5.0 ng/ml TGFβ (R&D Systems) and were subjected to a migration assay utilizing a monolayer scratch recovery assay. Cells were plated on 12-well pates precoated with fibronectin (0.5 μg/well). The data are presented as mean ± S.D. n = 3. *, p < 0.001; #, p < 0.05.
DISCUSSION
Our previous studies have demonstrated that 14-3-3β-Rac-Pak1 signaling is necessary for the migration of normal fibroblasts and endothelial cells (7). We also showed that Pak1 mediates oncogenic transformation in a Rat1 fibroblast model by reconciling the effects of Akt and cRaf pathways, two major signaling cascades that are often deregulated in multiple cancers (8). Our recent study demonstrated that 14-3-3ζ-Rac signaling, an upstream activity modulator of group I Paks such as Pak1, is also necessary for the ECM-specific directional migration and transendothelial migration of non-invasive LNCaP and highly invasive PC3 prostate cancer cells, respectively (13). In support of these findings, we hypothesized that, although not a predominant Pak isoform in prostate cancer cells, Pak1 is important for the prostate tumor progression and metastasis. In this study, using multiple approaches, we studied the importance of group I Paks, Pak1 in particular, in the regulation of prostate tumor growth and metastasis in comparison with Pak6, a group II counterpart that is predominantly expressed in prostate.
As reported in the literature (9, 22), our data confirmed that prostate cancer cells express a robust amount of Pak6 irrespective of their tumorigenic and metastatic potential. Although protein expression levels of Pak1 were relatively less in non-invasive LNCaP cells, expression of Pak1 in highly invasive prostate cancer cells such as PC3, LNCaP C4-2, and Vertebral Cancer of the Prostate (VCaP) were significantly higher compared with less aggressive LNCaP cells, thus suggesting the predominant role of Pak1 in prostate cancer cell invasion and metastasis. Similar to the results from cell-based studies, normal human prostate and benign prostatic hyperplasia tissues expressed a negligible amount of Pak1. However, expression of Pak1 was elevated significantly in prostate tumor and prostate cancer metastatic lymph node and lung tissues. This is highly in agreement with a previous observation on the basis of prostate cancer patient samples where significantly elevated Pak1 expression was observed in invasive prostate cancer tissues as compared with tissues with benign prostatic hyperplasia (23), which suggested a predominant role for Pak1 in prostate cancer invasion and metastasis. To our knowledge, this is the first report on a correlation between enhanced protein expression of Pak1 with the tumorigenic and metastatic potential of prostate cancer.
Next, we sought to determine the significance of elevated Pak1 levels in prostate cancer with respect to its precise role in tumor progression and invasion. We have shown previously that Rac-Pak1 signaling is necessary for inducing cytoskeletal changes, lamellipodia formation and cell protrusion through actin remodeling in normal and prostate cancer cells (7, 14). This is also in agreement with another report that HGF utilizes Pak1 in prostate cancer cells in inducing cytoskeletal changes (24). We also demonstrated previously that Pak1 inhibition prevents oncogenic transformation and tumor growth in vivo through uncoupling of Akt from cRaf-ERK pathways (8). Although Pak1 has been implicated in the attainment of migratory and invasive potential by a variety of cancer cell types (25–26), this is the least studied Pak isoform in prostate cancer, probably because the prostate is well known for its higher expression of group II Paks such as Pak4 and Pak6 compared with group I Paks such as Pak1 and Pak2. Because group II Paks are not common effectors downstream of Rac1 activation (1), we hypothesized that our previous observation of Rac1-mediated activation of prostate cancer cells (13) is mediated via utilizing a mechanism independent of Pak6. Because Pak1 expression is significantly enhanced in invasive prostate cancer cells compared with non-invasive LNCaP cells, we assumed a role for Pak1 in the regulation of cell motility in prostate cancer cells. Our study revealed that although Pak6 knockdown had no significant effect on prostate cancer cell motility on ECM proteins, Pak1 deficiency resulted in significant impairment of motility of the PC3 cells plated on ECM proteins such as fibronectin, vitronectin, laminin, osteonectin, and osteopontin. A similar effect was also observed in hormone-responsive LNCaP cells and metastatic LNCaP C4–2 cells. Furthermore, treatment with Pak1 specific inhibitor IPA3 significantly blunted EGF-mediated cell migration in PC3 cells.
Interestingly, the isoform-specific difference in Paks in the regulation of cell motility was not apparent in the transendothelial migration (microinvasion) of PC3 cells. Transendothelial migration of prostate cancer cells is a measure of its ability to cross the endothelial barrier to get into the systemic circulation (intravasation) and come out of circulation (extravasation) to the site of metastasis, such as lung and bone (14). Because microinvasion, also termed “micrometastasis,” is a prerequisite for metastasis of cancers to distant tissues, this process is considered a key step to target for the prevention of cancer metastasis. Surprisingly, shRNA-mediated knockdown of both Pak1 and Pak6 resulted in impaired microinvasion of PC3 cells. Notably, the effect of Pak1 knockdown on microinvasion of PC3 cells was much more robust compared with Pak6 knockdown. Furthermore, impaired microinvasion of PC3 cells with Pak6 knockdown was significantly reversed by coexpression with constitutively active Pak1, demonstrating that Pak1 is predominantly involved in the regulation of prostate cancer microinvasion.
Because Pak1 is a well known effector downstream of Rac1 activation in the regulation of cytoskeletal remodeling and integrin activation (7, 14), its predominant role in cell migration is expected. However, why ablation of both Pak1 and Pak6 resulted in impaired microinvasion was perplexing. To characterize the mechanisms involved in this process, we performed gene arrays on PC3 cells with Pak1 and Pak6 gene knockdown compared with the control vector-expressing PC3 cells. Candidate genes identified to increase their expression with Pak1 knockdown included angiopoietin-1, TGFβ, and TNFR25, whereas expression of genes such as IFNβ1, insulin-like growth factor, metastasis-associated proteins 1/2, integrin α4, and MMP9 were reduced with Pak1 knockdown. In contrast, Pak6 knockdown resulted in increased expression of IL-8, MMP2, and thrombospondin1 and reduced expression of MMP9. Because MMP9 is necessary for the transendothelial migration of cancer cells (27–29), this would answer why both Pak1 and Pak6 are important for microinvasion. The predominant effect of Pak1 on prostate cancer microinvasion over Pak6 may be due to its specific role in mediating cytoskeletal remodeling and in the expression of integrin α4, which, when partnered with integrin β6, is a receptor for laminin in the vascular basement membrane (29). Our findings, in combination with these reports, unequivocally demonstrate that Pak1 is a potent mediator of prostate cancer cell migration and microinvasion through cytoskeletal remodeling, intercellular interactions, and expression/repression of various genes.
Finally, to examine the role of Pak1 in prostate tumor growth, we utilized an athymic nude mouse tumor xenograft model for PC3 cells with Pak1 and Pak6 genes ablated using specific shRNAs. Although Pak1 knockdown resulted in > 50% reduction in the rate of tumor growth, Pak6 knockdown was associated with > 25% reduction in tumor growth. Impaired tumor growth was also associated with > 70% and > 40% reduction in the number of laminin-positive blood vessels with Pak1 and Pak6 knockdown, respectively. We showed recently that TGFβ acts as a tumor suppressor for prostate and bladder cancer cells (30). Our data also indicated that TGFβ can significantly inhibit migration of PC3 cells on fibronectin. Hence, enhanced expression of TGFβ and reduced expression of MMP9 as a result of Pak1 knockdown in PC3 cells may be the predominant factors that resulted in reduced tumor growth.
In conclusion, we show for the first time that expression of Pak1 is significantly elevated in invasive prostate cancer cells as well as prostate tumor and metastatic tissues as compared with non-invasive prostate cancer cells and normal prostate tissue, respectively. We demonstrated that inhibition of Pak1 expression or activity can inhibit prostate cancer cell migration, microinvasion, and tumor growth via modulation of the expression of number genes such as TGFβ, MMP9, integrin α4, insulin-like growth factor, and so forth. Considering our data, it is possible that targeting Pak1, coupled with one or more of the existing chemotherapeutic agents such as docetaxel (Taxotere®) could prove to be an effective, multi-pronged treatment strategy for patients harboring advanced-stage prostate cancer.
This work was supported, in whole or in part, by National Institutes of Health Grant R01HL103952 (to P. R. S.). This work was also supported by the University of Georgia Research Foundation, by the Wilson Pharmacy Foundation, and by the University of Georgia College of Pharmacy through intramural grants (to P. R. S.) and by American Heart Association Scientist Development Grant 0830326N (to P. R. S.).
- Pak
- p21-activated kinase
- MMP
- matrix metalloproteinase
- ECM
- extracellular matrix
- ECIS
- electric cell substrate impedance sensing.
REFERENCES
- 1. Kichina J. V., Goc A., Al-Husein B., Somanath P. R., Kandel E. S. (2010) PAK1 as a therapeutic target. Expert Opin. Ther. Targets 14, 703–725 [DOI] [PMC free article] [PubMed] [Google Scholar]
- 2. Eswaran J., Lee W. H., Debreczeni J. E., Filippakopoulos P., Turnbull A., Fedorov O., Deacon S. W., Peterson J. R., Knapp S. (2007) Crystal Structures of the p21-activated kinases PAK4, PAK5, and PAK6 reveal catalytic domain plasticity of active group II PAKs. Structure 15, 201–213 [DOI] [PMC free article] [PubMed] [Google Scholar]
- 3. Kumar R., Gururaj A. E., Barnes C. J. (2006) p21-activated kinases in cancer. Nat. Rev. Cancer 6, 459–471 [DOI] [PubMed] [Google Scholar]
- 4. Knaus U. G., Wang Y., Reilly A. M., Warnock D., Jackson J. H. (1998) Structural requirements for PAK activation by Rac GTPases. J. Biol. Chem. 273, 21512–21518 [DOI] [PubMed] [Google Scholar]
- 5. Lei M., Lu W., Meng W., Parrini M. C., Eck M. J., Mayer B. J., Harrison S. C. (2000) Structure of PAK1 in an autoinhibited conformation reveals a multistage activation switch. Cell 102, 387–397 [DOI] [PubMed] [Google Scholar]
- 6. Bokoch G. M. (2003) Biology of the p21-activated kinases. Annu. Rev. Biochem. 72, 743–781 [DOI] [PubMed] [Google Scholar]
- 7. Somanath P. R, Byzova T. V. (2009) 14–3-3β-Rac1-p21 activated kinase signaling regulates Akt1-mediated cytoskeletal organization, lamellipodia formation and fibronectin matrix assembly. J. Cell. Physiol. 218, 394–404 [DOI] [PMC free article] [PubMed] [Google Scholar]
- 8. Somanath P. R., Vijai J., Kichina J. V., Byzova T., Kandel E. S. (2009) The role of PAK-1 in activation of MAP kinase cascade and oncogenic transformation by Akt. Oncogene 28, 2365–2369 [DOI] [PMC free article] [PubMed] [Google Scholar]
- 9. Schrantz N., da Silva Correia J., Fowler B., Ge Q., Sun Z., Bokoch G. M. (2004) Mechanism of p21-activated kinase 6-mediated inhibition of androgen receptor signaling. J. Biol. Chem. 279, 1922–1931 [DOI] [PubMed] [Google Scholar]
- 10. Yang F., Li X., Sharma M., Zarnegar M., Lim B., Sun Z. (2001) Androgen receptor specifically interacts with a novel p21-activated kinase, PAK6. J. Biol. Chem. 276, 15345–15353 [DOI] [PubMed] [Google Scholar]
- 11. Wen X., Li X., Liao B., Liu Y., Wu J., Yuan X., Ouyang B., Sun Q., Gao X. (2009) Knockdown of p21-activated kinase 6 inhibits prostate cancer growth and enhances chemosensitivity to docetaxel. Urology 73, 1407–1411 [DOI] [PubMed] [Google Scholar]
- 12. Park MH., Lee HS., Lee CS., You ST., Kim DJ., Park BH., Kang MJ., Heo WD., Shin EY., Schwartz MA. (2012) p21-Activated kinase 4 promotes prostate cancer progression through CREB. Oncogene, June 18 doi: 10.1038/onc.2012.255 [Epub ahead of print] [DOI] [PubMed] [Google Scholar]
- 13. Goc A., Abdalla M., Al-Azayzih A., Somanath P. R. (2012) Rac1 activation driven by 14-3-3ζ dimerization promotes prostate cancer cell-matrix interactions, motility and transendothelial migration. PLoS ONE 7, e40594. [DOI] [PMC free article] [PubMed] [Google Scholar]
- 14. Goc A., Liu J., Byzova T. V., Somanath P. R. (2012) Akt1 mediates prostate cancer cell microinvasion and chemotaxis to metastatic stimuli via integrin β(3) affinity modulation. Br. J. Cancer 107, 713–723 [DOI] [PMC free article] [PubMed] [Google Scholar]
- 15. Goc A., Al-Husein B., Kochuparambil S. T., Liu J., Heston W. W., Somanath P. R. (2011) PI3 kinase integrates Akt and MAP kinase signaling pathways in the regulation of prostate cancer. Int. J. Oncol. 38, 267–277 [PubMed] [Google Scholar]
- 16. Kochuparambil S. T., Al-Husein B., Goc A., Soliman S., Somanath P. R. (2011) Anticancer efficacy of simvastatin on prostate cancer cells and tumor xenografts is associated with inhibition of Akt and reduced prostate-specific antigen expression. J. Pharmacol. Exp. Ther. 336, 496–505 [DOI] [PubMed] [Google Scholar]
- 17. Wolff C., Schott C., Porschewski P., Reischauer B., Becker K. F. (2011) Successful protein extraction from over-fixed and long-term stored formalin-fixed tissues. PLoS ONE 6, e16353. [DOI] [PMC free article] [PubMed] [Google Scholar]
- 18. Scicchitano M. S., Dalmas D. A., Boyce R. W., Thomas H. C., Frazier K. S. (2009) Protein extraction of formalin-fixed, paraffin-embedded tissue enables robust proteomic profiles by mass spectrometry. J. Histochem. Cytochem. 57, 849–860 [DOI] [PMC free article] [PubMed] [Google Scholar]
- 19. Somanath P. R., Kandel E. S., Hay N., Byzova T. V. (2007) Akt1 signaling regulates integrin activation, matrix recognition, and fibronectin assembly. J. Biol. Chem. 282, 22964–22976 [DOI] [PMC free article] [PubMed] [Google Scholar]
- 20. Chen J., Somanath P. R., Razorenova O., Chen W. S., Hay N., Bornstein P., Byzova T. V. (2005) Akt1 regulates pathological angiogenesis, vascular maturation and permeability in vivo. Nat. Med. 11, 1188–1196 [DOI] [PMC free article] [PubMed] [Google Scholar]
- 21. Li B., Wen G., Zhao Y., Tong J., Hei T. K. (2012) The role of TGFBI in mesothelioma and breast cancer: association with tumor suppression. BMC Cancer 12, 239. [DOI] [PMC free article] [PubMed] [Google Scholar]
- 22. Zhang M., Siedow M., Saia G., Chakravarti A. (2010) Inhibition of p21-activated kinase 6 (PAK6) increases radiosensitivity of prostate cancer cells. Prostate 70, 807–816 [DOI] [PMC free article] [PubMed] [Google Scholar]
- 23. Richmond B., Bhatt T., Douglass L., Colligan B., Deddens J., Pemberton J., Marshall M., Graff J., Carter J. (2005) Pak-1 expression is increased during human prostate cancer progression [Abstract]. Proc. Amer. Assoc. Cancer Res. 46, [Google Scholar]
- 24. Bright M. D., Garner A. P., Ridley A. J. (2009) PAK1 and PAK2 have different roles in HGF-induced morphological responses. Cell. Signal. 21, 1738–1747 [DOI] [PubMed] [Google Scholar]
- 25. Chow H. Y., Jubb A. M., Koch J. N., Jaffer Z. M., Stepanova D., Campbell D. A., Duron S. G., O'Farrell M., Cai Q., Klein-Szanto A. J. (2012) p21-activated kinase 1 is required for efficient tumor formation and progression in a Ras-mediated skin cancer model. Cancer Res. 72, 5966–5975 [DOI] [PMC free article] [PubMed] [Google Scholar]
- 26. Eswaran J., Li D. Q., Shah A., Kumar R. (2012) Molecular pathways. Targeting p21-activated kinase 1 signaling in cancer. Opportunities, challenges, and limitations. Clin. Cancer Res. 18, 3743–3749 [DOI] [PMC free article] [PubMed] [Google Scholar]
- 27. Deryugina E. I., Quigley J. P. (2006) Matrix metalloproteinases and tumor metastasis. Cancer Metastasis Rev. 25, 9–34 [DOI] [PubMed] [Google Scholar]
- 28. Lakka S. S., Gondi C. S., Yanamandra N., Dinh D. H., Olivero W. C., Gujrati M., Rao J. S. (2003) Synergistic down-regulation of urokinase plasminogen activator receptor and matrix metalloproteinase-9 in SNB19 glioblastoma cells efficiently inhibits glioma cell invasion, angiogenesis, and tumor growth. Cancer Res. 63, 2454–2461 [PubMed] [Google Scholar]
- 29. Redondo-Muñoz J., Escobar-Díaz E., Samaniego R., Terol M. J., García-Marco J. A, García-Pardo A. (2006) MMP-9 in B-cell chronic lymphocytic leukemia is up-regulated by α4β1 integrin or CXCR4 engagement via distinct signaling pathways, localizes to podosomes, and is involved in cell invasion and migration. Blood 108, 3143–3151 [DOI] [PubMed] [Google Scholar]
- 30. Al-Azayzih A., Gao F., Goc A., Somanath P. R. (2012) TGFβ1 induces apoptosis in invasive prostate cancer and bladder cancer cells via Akt-independent, p38 MAPK and JNK/SAPK-mediated activation of caspases. Biochem. Biophys. Res. Commun. 32, 1095–1111 [DOI] [PMC free article] [PubMed] [Google Scholar]