

Background: Soluble adenylyl cyclase (sAC) may be an alternative intracellular localized source of cAMP controlling proliferation.
Results: sAC is overexpressed in prostate carcinoma, and inhibition of sAC leads to cell cycle arrest.
Conclusion: sAC controls proliferation of prostate carcinoma cells.
Significance: sAC represents a novel pathway promoting proliferation in cancer cells and is a promising target for prostate cancer treatment.
Keywords: Adenylate Cyclase (Adenylyl Cyclase), Cell Proliferation, Cell Signaling, Cyclic AMP (cAMP), Prostate Cancer, Cell Cycle Arrest, EPAC
Abstract
cAMP signaling plays an essential role in modulating the proliferation of different cell types, including cancer cells. Until now, the regulation of this pathway was restricted to the transmembrane class of adenylyl cyclases. In this study, significant overexpression of soluble adenylyl cyclase (sAC), an alternative source of cAMP, was found in human prostate carcinoma, and therefore, the contribution of this cyclase was investigated in the prostate carcinoma cell lines LNCaP and PC3. Suppression of sAC activity by treatment with the sAC-specific inhibitor KH7 or by sAC-specific knockdown mediated by siRNA or shRNA transfection prevented the proliferation of prostate carcinoma cells, led to lactate dehydrogenase release, and induced apoptosis. Cell cycle analysis revealed a significant rise in the G2 phase population 12 h after sAC inhibition, which was accompanied by the down-regulation of cyclin B1 and CDK1. sAC-dependent regulation of proliferation involves the EPAC/Rap1/B-Raf signaling pathway. In contrast, protein kinase A does not play a role. In conclusion, this study suggests a novel sAC-dependent signaling pathway that controls the proliferation of prostate carcinoma cells.
Introduction
Defects in proliferation or apoptosis control are important underlying causes of cancer progression. Therefore, many antitumor strategies focus on suppressing the cell cycle or inducing apoptosis. cAMP-dependent signaling plays a substantial role in several signaling pathways that control cell proliferation and apoptosis. However, the specific effects of cAMP signaling on proliferation and apoptosis are controversial. For example, elevation of cellular cAMP content by stimulation of G protein-responsive transmembrane adenylyl cyclases (tmACs)4 or by treatment with cAMP analogs has been shown to either induce or suppress proliferation in different cell types (1–4). Similarly, cAMP signaling has conflicting effects on apoptosis (5–8). This discrepancy may be due to differences in cell types or experimental models. Alternatively, the lack of specificity regarding tmAC-dependent signals, especially those that are directed to distant intracellular targets, such as the nucleus and mitochondria, may also be a cause for this discrepancy. For many years, cAMP signaling was thought to rely solely on the production of cAMP at the plasma membrane by tmAC. However, work by many groups, including our own, has changed that model. We now know that tmAC can continue to signal within the cell following internalization, thereby defining endocytic cAMP microdomains (9, 10). Furthermore, a second source of cAMP, type 10 soluble adenylyl cyclase (sAC), was identified in mammalian cells (11). Unlike tmAC, sAC possesses no transmembrane domains and is localized throughout the cell, e.g. cytosol, nucleus, mitochondria, and centriole (12). In 1999, Buck et al. (13) purified and characterized this enzyme from rat testes. The follow-up studies demonstrated the unique activation of sAC by bicarbonate and bivalent cations as well as the role of sAC in various functions of several cells and organs, e.g. sperm, neutrophils, brain, kidney, eye, and pancreas (for review, see Ref. 14). Furthermore, recent studies have demonstrated that sAC regulates oxidative phosphorylation in mitochondria (15) as well as activation of the mitochondrial pathway of apoptosis (16).
The role of sAC-dependent cAMP in proliferation control is unknown. Aside from its cytosolic localization, sAC is also present in the nucleus, where it controls the activity of the nuclear cAMP response element-binding protein transcription factor through PKA-dependent phosphorylation (12). Recent studies have also demonstrated that sAC migrates from the cytosol to the nucleus when certain cells (keratinocytes and melanocytes) transition from benign cells into cancers, such as squamous cell carcinoma of the skin and melanoma (17, 18). These observations suggest that sAC may play a dynamic role in the transition from benign growth to cancer. In this study, we found significant sAC overexpression in human prostate carcinoma compared with benign prostatic tissue. These data further suggest a possible role for sAC in proliferation control. To test this hypothesis in the context of cancer, we utilized the human prostate carcinoma cell lines LNCaP and PC3 and investigated the functional role of sAC.
EXPERIMENTAL PROCEDURES
Tissue Samples
Cases were retrospectively identified from the database of the Division of Surgical Pathology, Weill Cornell Medical College. Immunostaining of archival patient samples was approved under Weill Cornell Medical College Institutional Review Board Protocol 1008011210. The study was conducted according to the Declaration of Helsinki Principles.
Immunohistochemical staining for sAC was performed on both tumor and benign tissues from 12 radical prostatectomy specimens. Two tumors were well differentiated (Gleason score 6), seven were moderately differentiated (Gleason score 7), and three were poorly differentiated (Gleason score 8–10). The Gleason score is created by adding two measurements of tumor differentiation (Gleason scale) together. The pathologist assigns a scale number (1–5) or grade to the most common tumor pattern and a second grade to the next most common tumor pattern. The two numbers are added together to get a Gleason score.
Briefly, 5-μm-thick sections of the formalin-fixed paraffin-embedded tissue were deparaffinized and stained using a BOND-III Autostainer (Leica Microsystems, Buffalo Grove, IL) and the manufacturer's Heat-Induced Epitope Retrieval 1 protocol with supplied reagents. Mouse anti-sAC monoclonal antibody (R21-IHC, CEP Biotech, Inc., Tamarac, FL) was used at a dilution of 1:750 as described previously (17, 18), followed by treatment in a post-primary alkaline phosphatase step for 20 min for signal amplification, application of 3,3′-diaminobenzidine for 10 min, and finally washing and mounting with a coverslip.
All slides were evaluated in a non-blinded fashion by an experienced urologic pathologist (B. D. R.). Test prostate cases (not included in this study) were examined by two physicians prior to assessment of the study cases to determine the relative staining intensity categories of weak (1+), moderate (2+), and strong (3+). A histology scoring system, H-score (19), which takes into account the percent of tissue staining for each intensity level, was then used to quantify the amount of staining. The H-score is calculated using the following equation: H-score = (% of cells staining “1+”) × 1 + (% of cells staining “2+”) × 2 + (% of cells staining “3+”) × 3. Thus, the H-score ranges from 0 to 300. Localization of the staining within the cell (cytoplasmic compartment, apical/luminal border, or nuclear compartment) was recorded for each case. Nuclear staining was positive when the sAC-specific diaminobenzidine precipitate (brown) overlaid and obscured hematoxylin-stained (blue) nuclei. Cytoplasmic staining was defined as sAC-specific diaminobenzidine precipitate not overlaying nuclei. Variations in staining distribution (i.e. tissue near the periphery (“capsule”) of the prostate versus more interior regions) were also recorded for each case.
Cell Culture
Androgen-sensitive LNCaP (ATCC CRL-1740D) and androgen-insensitive PC3 (ATCC CRL-1435D) human prostate carcinoma cell lines and the neuroblastoma cell line SH-SY5Y (ATCC CRL-2266) were purchased from American Type Culture Collection, and the human normal prostate epithelial cell line PNT2 was purchased from Sigma-Aldrich (catalog no. 95012613). Cells were expanded and frozen in aliquots within 4 weeks of purchase. For the experiments in this study, cells were thawed and cultured for no more than three additional passages. PNT2 cells were cultured in RPMI 1640 medium supplemented with 10% fetal calf serum, glutamine, and antibiotics. All other cells were cultured in Dulbecco's modified Eagle's medium that was supplemented with 5% fetal calf serum, glutamine, and antibiotics. The cells (1.5 × 10⁵) were seeded in culture medium with 2% fetal calf serum 24 h prior to each experiment.
Experimental Protocols
KH7 (20 μmol/liter; Cayman Europe, Tallinn, Estonia), its inactive analog KH7.15 (20 μmol/liter; kindly provided by Dr. J. Buck, Cornell University) (20), H-89 (3 μmol/liter; Sigma-Aldrich), (Rp)-cAMP-S (100 μmol/liter; Merck), 8-pCPT-cAMP (100 μmol/liter; BioLog, Bremen, Germany), and N6-benzoyl-cAMP (100 μmol/liter; BioLog) were applied to the cells throughout the duration of the experiments as indicated. At the end of the experiments, the floating cells were collected and used together with the attached cells for further analysis.
siRNA Transfection
Knockdown of sAC was achieved by treating LNCaP cells with siRNA duplexes that consisted of four different predesigned sequences targeting the human sAC mRNA sequence (accession number NM_001167749; catalogue no. L-006353-00, Dharmacon, Lafayette, CO). In the control group, cells were treated with scrambled non-targeting siRNA (catalogue no. D-001810-10, Dharmacon). Cells were transfected following the manufacturer's instructions. Briefly, cells were seeded 1 day before transfection in Dulbecco's modified Eagle's medium that was supplemented with 2% fetal calf serum without antibiotics. Targeting or non-targeting siRNA was mixed with Lipofectamine 2000 (Invitrogen) in Opti-MEM medium (Invitrogen) for 20 min at room temperature and then added to the cell culture medium at a final concentration of 40 nmol/liter. The cells were incubated at 37 °C for 6 h, and the medium was changed to normal growth medium (1% fetal calf serum) for an additional 42 h. The concentration of fetal calf serum was then increased to 2%, and the cells were cultured for an additional 24 h. At the end of this incubation, sAC expression was determined by Western blot analysis, which revealed a ≥80% reduction in sAC.
sAC shRNA Adenovirus Vector Construction and Transfection
The experimental procedure and methodology for sAC knockdown in LNCaP cells using adenovirus-driven transcription with shRNA were adapted from a previously described protocol (21). Briefly, the shRNA adenovirus vectors were constructed using the AdEasy adenoviral vector system. The pAd-Track-CMV shuttle vector was used to insert the murine U6 promoter and the anti-sAC-directed shRNA sequence as a double-stranded oligonucleotide using the BglII and KpnI restriction sites. The pmU6pro vector, which contains the murine U6 snRNA promoter, served as a template. To produce shRNA-encoding vectors, the U6 promoter and the hairpin construct were fused using a universal U6 5′-primer and a 3′-primer that included the siRNA targeting the rat sAC mRNA sequence (accession number NM_021684.1; boldface) and complementary U6 promoter sequences (italic): 5′-GGGGTACCAAAAAAGTGGAAAGTGGAACGAAAGCATCTCTTGAATGCTTTCGTTCCACTTTCCACAAACAAGGCTTTTCTCCAAG-3′. We found that this sequence was effective in inhibiting human sAC expression even though homology is not 100%. The underlined sequence corresponds to the hairpin loop. A randomized sequence (scrambled) that was based on the above sequence served as a control. Adenovirus recombinant plasmids were generated by homologous recombination between pAd-Track-sh-sAC and pAd-Easy1 in Escherichia coli to produce the recombinant viruses. The recombinant viruses were propagated in HEK293 cells and recovered after several freeze-thaw cycles. The cells were infected using 106 viral particles/ml of culture medium. The efficiency of sAC knockdown was examined by Western blot analysis, which revealed a ≥80% reduction in sAC.
Western Blotting
Cells were lysed in Laemmli buffer containing 2% SDS, 10% glycerol, 5% 2-mercaptoethanol, 0.002% bromphenol blue, and 0.0625 mol/liter Tris-HCl. Equal amounts of total proteins were separated on SDS-polyacrylamide gels and transferred to a nitrocellulose membrane. The following primary antibodies were used: sAC (clones R21 and R40; kindly provided by Dr. J. Buck); actin (Millipore); cleaved caspase-3, CDK1, phospho-CDK1, cyclin B1, cyclin D1, cyclin D3, cyclin E2, phospho-B-Raf, and B-Raf (Cell Signaling, Frankfurt, Germany); and Rap1A (Jena Bioscience, Jena, Germany). After incubation with peroxidase-linked and horseradish peroxidase-labeled secondary antibodies, specific bands were visualized by chemiluminescence using an ECL Plus kit. Equivalent sample loading was confirmed by stripping the membranes with Restore Western blot stripping buffer (Pierce), followed by treatment with anti-actin antibody.
FACS-based Cell Cycle Analysis
The cells were fixed with 70% alcohol, stained with propidium iodide, and treated with RNase (BD Biosciences). DNA content analysis was performed using a FACSCalibur flow cytometer (BD Biosciences) and FlowJo software.
Analysis of Cell Number
After staining with 4% trypan blue, cells were counted using a Neubauer hemocytometer (depth of 0.1 mm).
Cellular cAMP Analysis
Analysis of the total cellular cAMP content was performed using a cAMP direct enzyme immunoassay kit (Enzo Life Sciences, Lausen, Switzerland) according to the manufacturer's protocol. The absorbance measured at 405 nm was used to calculate the concentration of cAMP, applying a calibration curve.
Analysis of Lactate Dehydrogenase in Culture Medium
Lactate dehydrogenase (LDH) activity in the cell culture medium was used as an indicator of necrosis and was determined using a cytotoxicity detection kit (Roche Applied Science). After each experiment, the culture medium was centrifuged at 500 × g for 5 min at 4 °C, and the supernatant was used for LDH analysis with a spectrophotometer.
Rap1 Activity Assay
The level of activated Rap1 was determined using a pulldown assay kit (Jena Bioscience) based on glutathione S-transferase fusion to the Ras-binding domain of RalGDS following the manufacturer's instructions. The amount of GTP-bound Rap1 and total Rap1 was determined by Western blotting, followed by staining with anti-Rap1A antibody.
Statistical Analysis
Data are given as the mean ± S.E. For experiments with cells, comparison of the means between groups was performed using one-way analysis of variance, followed by a post hoc Bonferroni test. The intensity and localization of sAC-specific staining between the paired benign and malignant tissues were analyzed using the Wilcoxon signed-rank test. The proportion of benign versus malignant cases with differential staining of sAC at the capsular edge was analyzed using Fisher's exact test. p < 0.05 was considered to be statistically significant.
RESULTS
sAC Expression Is Elevated in Prostate Carcinoma
To examine the expression, subcellular localization, and distribution of sAC protein in prostate, we examined both benign and malignant prostate tissue samples. All prostatic glands, whether benign or malignant, showed at least weak (1+) cytoplasmic staining for sAC. When the level of sAC expression was analyzed, prostate cancer glands showed significantly increased sAC staining compared with benign glands (H-score 189.2 versus 144.3, respectively; p < 0.01) (Fig. 1 and Table 1). In particular, we found sAC up-regulation at the leading edge of the prostate cancer near the prostatic capsule and in extraprostatic foci of the tumor relative to the center of the tumor, but we saw no significant increase in staining as the tumor invaded deeper into the prostate gland (Fig. 1D). In contrast, benign glands near the prostatic capsule typically did not show any up-regulation of sAC compared with benign glands deeper within the prostate (Fig. 1C).
FIGURE 1.

sAC protein expression is elevated in prostate cancer. Shown are representative images of immunohistochemical staining for sAC (brown) combined with hematoxylin staining (blue). The majority of benign prostatic glands showed weak staining for sAC (A), whereas the majority of tumor glands showed moderate or strong staining for sAC (B). Benign glands near the prostatic capsule (right side of C) typically did not show increased staining compared with glands deeper within the prostate (left side of C). However, increased staining for sAC at the “capsular” leading edge of the prostate cancer (right side of D, noted by the asterisk) was seen in the vast majority of cases. The number sign indicates the area closer to the center of the gland. Although all cells showed diffuse staining of the cytoplasm, some also showed accentuated staining at the apical/luminal border (prostate cancer; arrows in E) or nuclear staining (benign prostatic gland; arrows in F). Original magnifications were ×400 (A, B, E, and F) and ×200 (C and D). Scale bars = 50 μm (A, B, E, and F) and 100 μm (C and D).
TABLE 1.
Immunohistochemical analysis of sAC expression and subcellular localization
| Benigna | Malignanta | p values | |
|---|---|---|---|
| Expression level | |||
| Weak (1+) | 59.6% | 28.3% | 0.022 |
| Moderate (2+) | 36.6% | 54.2% | 0.11 |
| Strong (3+) | 3.8% | 17.5% | 0.028 |
| H-score (mean) | 144.3 | 189.2 | 0.0070 |
| Intensity distribution | |||
| Increased staining at capsular edge | 3/12 | 8/9 | 0.0092 |
| Localization | |||
| Cytoplasmic | 100% | 100% | 1 |
| Apical/luminal border | 12.4% | 6.8% | 0.063 |
| Nuclear | 7.8% | 2.6% | 0.056 |
a n = 12 for both groups, except for analysis of the intensity distribution for malignant tissue (n = 9).
Analysis of the subcellular distribution of sAC revealed diffuse cytoplasmic staining for sAC in all cells. Some glands also showed more intense staining of nuclei (Fig. 1E) or the apical/luminal border of the cells (Fig. 1F). Statistical analysis did not reveal any significant difference in the subcellular distribution pattern of sAC between benign and tumor samples (Table 1).
Inhibition of sAC Suppresses Cell Growth and Induces Cell Death
To prove the possible role of sAC in the proliferation/apoptosis control of prostate carcinoma, two human prostate carcinoma cell lines were used. Both cell lines showed marked expression of sAC as analyzed by Western blotting. The expression of sAC was markedly higher compared with reference cells, i.e. human normal prostate epithelial cells (PNT2). Furthermore, by analyzing isoform-specific expression by applying antibody R40, which recognize only the “testicular” isoform, and antibody R21, which recognizes both the testicular and “somatic” isoforms (22), we found only weak expression of the testicular isoform (supplemental Fig. 1) in both cell lines, suggesting that the somatic isoform is the predominant form of sAC in these cells.
Treatment of PC3 and LNCaP cells with the sAC-selective inhibitor KH7 was used to suppress the activity of sAC. Previous studies demonstrated that KH7 inhibits sAC in various cell types at a concentration range of 10–30 μmol/liter, whereas it has no effect on tmAC and soluble guanylyl cyclase up to 100 μmol/liter (23). To further distinguish the possible nonspecific sAC-independent effects of KH7, an inactive analog of KH7 (KH7.15) was used (20).
Treatment with KH7 reduced the intracellular cAMP content and suppressed cell proliferation in a dose-dependent manner in both cell lines, with a maximal effect at 20 μmol/liter (supplemental Fig. 2). Analysis of cell growth and death following treatment with 20 μmol/liter KH7 for 48 h revealed that the antiproliferative effect of sAC inhibition was accompanied by the release of LDH and apoptosis, as measured by a rise in the sub-G1 population and cleavage of caspase-3 (Fig. 2). In contrast, treatment with the inactive analog KH7.15 had no effect, suggesting that the observed effects of KH7 treatment are sAC-dependent.
FIGURE 2.
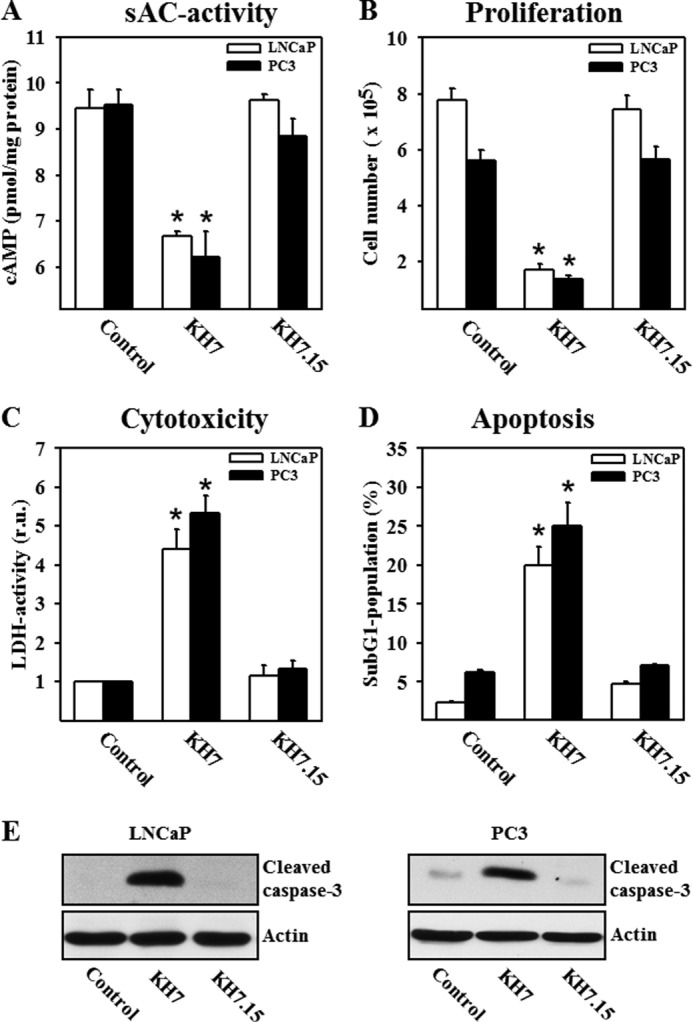
Inhibition of sAC reduces cellular cAMP content, inhibits proliferation, and leads to cytotoxicity and apoptosis in LNCaP and PC3 cells. Statistical analyses are presented of cellular cAMP content (A), cell number per dish (B), LDH activity in the cell culture medium (presented as a ratio to individual protein content; relative units (r.u.)) (C), and percentage of the sub-G1 population (D) in control cells and cells treated with the sAC inhibitor KH7 (20 μmol/liter) or its inactive analog KH7.15 (20 μmol/liter) for 48 h. Note that 150,000 cells per dish were plated at the beginning of all experiments. Values are the mean ± S.E. (n = 7–9). *, p < 0.05 versus the control. E, Western blot analysis of cleaved caspase-3 was performed with lysates of LNCaP and PC3 cells. Treatment conditions were similar to those described for A–D. The data are representative of five independent experiments with similar results.
To further substantiate the role of sAC in cell growth and death, the expression of sAC was suppressed in LNCaP cells. Two different methods of sAC knockdown, Lipofectamine-based transfection with sAC-specific siRNA or adenoviral transfection with shRNA, were used to further rule out the possibility of KH7 off-target effects. Both treatments equally reduced the expression of the 50-kDa sAC isoform by ≥80% (Fig. 3A). Similar to pharmacological inhibition of sAC with KH7, both methods of sAC knockdown significantly suppressed the proliferation of LNCaP cells (reduction of cell numbers from 6.37 × 10⁵ to 3.25 × 10⁵ after siRNA treatment and to 3.56 × 10⁵ after shRNA treatment), induced LDH release, and led to caspase-3 cleavage (Fig. 3, B–D). In contrast, treatment with scrambled siRNA or shRNA had no effect on these parameters.
FIGURE 3.

Knockdown of sAC inhibits proliferation and induces cytotoxicity and apoptosis in LNCaP cells. A, Western blot analysis of sAC performed with lysates of LNCaP cells after treatment with specific or scrambled siRNA for 72 h (left panel) or after treatment with sAC-specific or scrambled shRNA for 72 h (right panel). B–D, effects of siRNA or shRNA transfection on cell proliferation, LDH activity in the cell culture medium (relative units (r.u.)), and cleavage of caspase-3. Values are the mean ± S.E. (n = 5–6). *, p < 0.05 versus control or scrambled. The Western blot data are representative of five independent experiments with similar results.
Inhibition of sAC-induced Cell Cycle Arrest
To understand the mechanisms responsible for the antiproliferative effect of sAC inhibition, cell cycle analysis was performed. In LNCaP cells, pharmacological or genetic suppression of sAC activity significantly increased the percentage of cells in G2 phase and subsequently reduced the percentage of cells in G1 phase (Fig. 4, A–C), suggesting the development of cell cycle arrest at the G2/M checkpoint.
FIGURE 4.

Pharmacological inhibition or knockdown of sAC induces cell cycle arrest at G2 phase. A–C, statistical analysis of cell cycle phases was carried out by flow cytometry with control LNCaP cells, with cells treated either with the sAC inhibitor KH7 (20 μmol/liter) or with its inactive analog KH7.15 (20 μmol/liter) for 24 h, or with cells transfected with sAC-specific or scrambled siRNA. D, the time course for the G2 phase population, as well as caspase-3 cleavage, was examined in LNCaP cells treated for 48 h with the sAC inhibitor KH7. Values are the mean ± S.E. (n = 8–10). *, p < 0.05 versus control or scrambled siRNA. E and F, Western blot analysis of proteins controlling cell cycle progression through the G2/M and G1/S checkpoints was performed with lysates of control LNCaP cells or cells treated with KH7 for 24 h or after sAC knockdown (siRNA). Treatment conditions were similar to those described for A–D. All Western blot data are representative of three to five independent experiments with similar results.
Further kinetic analysis of cell cycle arrest progression revealed that the percentage of cells in G2 phase started to rise 12 h after treatment with the sAC inhibitor and reached a maximal value at 24 h (Fig. 4D). In contrast, cleavage of caspase-3 first appeared after 24 h. Therefore, apoptosis appears to be a result, rather than a cause, of the cell cycle arrest.
sAC Controls the Expression of G2/M Checkpoint Proteins
To investigate how sAC controls the G2/M transition, the expression of cyclin B1 and CDK1 was examined. We found that expression of cyclin B1 and CDK1 (both the phosphorylated and dephosphorylated forms) was significantly suppressed by treatment with KH7: reduction in optical band density expressed as a ratio to actin band density of 66% (cyclin B1), 64% (CDK1), and 78% (phospho-CDK1) from control levels. Similar effects were found upon sAC knockdown: reduction of 70% (cyclin B1), 75% (CDK1), and 78% (phospho-CDK1) from control levels (Fig. 4E). In contrast, expression of cyclins D1, D3, and E2, the proteins responsible for the G1/S transition, was not altered by sAC inhibition (Fig. 4F). Therefore, these data substantiate the specific role of sAC in controlling the G2/M transition.
sAC Controls Proliferation in an EPAC-dependent Manner
PKA and EPAC (exchange protein activated by cAMP) are two major downstream targets of cAMP. Therefore, we investigated whether these proteins are involved in sAC-dependent proliferation control. The role of PKA was investigated first by applying the PKA-specific activator N6-benzoyl-cAMP. Treatment with this compound had no effect on proliferation of control cells or cells treated with the sAC inhibitor KH7 (Fig. 5, A–C). Additionally, cells were treated with two structurally different PKA inhibitors, the ATP-binding site inhibitor H-89 (3 μmol/liter) and the cAMP-binding site inhibitor (Rp)-cAMP-S (100 μmol/liter). Treatment with these inhibitors had no effect on the proliferation, cytotoxicity, or distribution of the cell population within the cell cycle (Fig. 5, A–C).
FIGURE 5.

sAC controls proliferation and the cell cycle in a PKA-independent and EPAC-dependent manner. A–C, statistical analyses are presented of cell number per dish (A), LDH activity in the cell culture medium (relative units (r.u.)) (B), and G2 phase populations (C). Treatments (24 h) were as follows: 20 μmol/liter KH7, 20 μmol/liter KH7.15, 100 μmol/liter 8-pCPT-cAMP (8-pCPT), 100 μmol/liter N6-benzoyl-cAMP (6-Bnz), 3 μmol/liter H-89, or 100 μmol/liter (Rp)-cAMP-S (RpcAMP). Values are the mean ± S.E. (n = 8–11). *, p < 0.05 versus the control; #, p < 0.05 versus KH7. D and E, Western blot analysis of the active form of Rap1 (Rap1-GTP) and phosphorylated forms of B-Raf was performed with LNCaP cell lysates. Treatment conditions were similar to those described for A–C. Treatment was performed for 18 h. All Western blot data are representative of four to six independent experiments with similar results.
To test the role of EPAC in proliferation control, we first examined whether the inhibition of sAC affected the EPAC activity in LNCaP cells. To trace the EPAC activity, the expression of an active form of Rap1, GTP-bound Rap1, was analyzed by Western blotting. We found that sAC inhibition with KH7 significantly depleted Rap1-GTP, whereas treatment with its inactive analog (KH7.15) had no effect (Fig. 5D). Similarly, the inhibition of sAC suppressed the phosphorylation of B-Raf, a downstream kinase activated by Rap1. By analyzing optical band density expressed as a ratio to actin band density, we did not find any significant effect of KH7 treatment on expression of Rap1 (0.81 ± 0.07 versus 0.79 ± 0.01 in the control, n = 6) or B-Raf (1.02 ± 0.04 versus 1.13 ± 0.06 in the control, n = 8).
Treatment with the EPAC-selective activator 8-pCPT-cAMP reversed the effect of KH7 on Rap1-GTP expression (Fig. 5E). Further analysis revealed that treatment with the EPAC activator prevented the decrease in cell proliferation, LDH release, and the cell cycle block induced by sAC inhibition (Fig. 5, A–E). Together, these data suggest that sAC controls the cell cycle and proliferation in an EPAC/Rap1-dependent and PKA-independent manner.
DISCUSSION
The aim of this study was to determine whether sAC plays a role in the growth and apoptosis of prostate carcinoma cells. The main findings are as follows. (i) sAC is overexpressed in prostate carcinoma compared with benign prostatic glands and is specifically up-regulated at the leading edge of the tumor. (ii) The suppression of sAC activity prevents proliferation and induces apoptosis in prostate carcinoma cell lines. (iii) The antiproliferative effect of sAC inhibition is mediated by cell cycle arrest in G2 phase. (iv) sAC controls proliferation of prostate carcinoma cell lines specifically through EPAC/Rap1/B-Raf signaling.
cAMP signaling regulates diverse cell functions, including cell death and growth. However, the data are controversial. Apoptosis that is induced by serum deprivation or by treatment with Fas ligand or staurosporine (5, 6) may be suppressed by tmAC-dependent elevation of cellular cAMP. Alternatively, several studies demonstrated that elevation of cellular cAMP itself might lead to apoptosis (7, 8). Similarly, activation of a cAMP-regulated pathway may promote (1, 2) or suppress (3, 4) proliferation. The basis for this discrepancy is unclear and may be due to differences in cell types and experimental models. For example, cAMP stimulates the proliferation of various epithelial cells, hepatocytes, adipocytes, and pancreatic β-cells, whereas it inhibits the proliferation of fibroblasts, smooth muscle cells, neoplastic B-cells, and malignant glioma cells (24, 25). On the other hand, spatial restriction or compartmentalization of cAMP and its downstream targets PKA and EPAC within the cell may significantly affect a cAMP response. In particular, spatially discrete subpopulations of PKA that are generated by PKA-anchoring proteins may have the opposite effect on proliferation due to C-Raf-dependent inhibition or the B-Raf-dependent stimulation of the Raf/MEK/ERK signaling pathway (26). Similarly, a spatial cAMP gradient can be formed through the targeted degradation of cAMP by phosphodiesterases, providing selective localization of the cAMP pool in close proximity to its origin.
Traditionally, cAMP synthesis was attributed solely to G protein-coupled tmACs and was therefore restricted to the plasmalemma. Whether an intracellularly localized sAC-derived pool of cAMP also plays a role in proliferation and therefore in tumor growth was unknown. In this study, immunohistochemical analysis revealed marked sAC overexpression in human prostate carcinoma compared with benign prostatic tissue. This finding suggested a possible functional role for sAC in prostate cancer growth.
Utilizing two prostate carcinoma cell lines, we found that the pharmacological inhibition of sAC with KH7 and sAC knockdown with siRNA and shRNA prevented cell proliferation. Furthermore, suppression of proliferation by sAC inhibition was accompanied by apoptosis, as revealed by caspase-3 cleavage and a rise in the sub-G1 population.
Inducing apoptosis is a promising strategy for inhibiting the proliferation of cancer cells, and inhibiting proliferation may secondarily lead to apoptotic cell death. In this study, the suppression of proliferation seems to be the primary event. We found that inhibition of sAC with KH7 and sAC knockdown induced cell cycle arrest in G2 phase. Time course analysis of caspase-3 cleavage and the accumulation of cells in G2 phase revealed a significant rise in the G2 population 12 h after the start of sAC inhibition, whereas the onset of caspase-3 cleavage was significantly delayed, being observed first only after 24 h. Finally, our previous studies suggested a pro-apoptotic rather than an anti-apoptotic role for sAC (16, 27). Therefore, our data from this and previous studies support that apoptosis is a result, rather than a cause, of cell cycle arrest in our current experimental model.
Androgen receptors have been shown to play a pivotal role in the development of prostate cancer (28, 29). Furthermore, a cross-talk between androgen receptors and cAMP signaling has been demonstrated previously (29); in particular, a role for the tmAC-specific cAMP pool in the activation of androgen receptors and proliferation promotion has been revealed. In contrast, the results from this study suggest that the contribution of the sAC-specific cAMP pool to proliferation control is androgen receptor-independent because similar effects were observed in androgen-dependent (LNCaP) as well as in androgen-independent (PC3) cell lines. Furthermore, a cross-talk between cAMP signaling and androgen receptors involves PKA activation by the tmAC-specific cAMP pool (29). In our study, PKA did not contribute to proliferation control, as confirmed by treatment with PKA activators and inhibitors. The PKA-independent proliferation of prostate cancer cells found here appears to be in contradiction of previous reports emphasizing the role of PKA. Notably, in the majority of the previous studies, tmAC was stimulated, thus affecting proliferation by generating a rise in cAMP. In contrast, cAMP production was suppressed in this study by specific inhibition of sAC. Therefore, the sAC-specific cAMP pool may control proliferation in the unstimulated basal mode of cancer cells.
EPAC has also been shown to play an important role in the control of proliferation in different cell types, including prostate carcinoma cells (2, 24, 30). A recent study by Misra and Pizzo (2) demonstrated that treatment with an EPAC-specific cAMP analog promotes proliferation of prostate carcinoma cells in a PKA-independent manner. The authors found that the B-Raf/ERK1/2 and mTOR (mammalian target of rapamycin) signaling pathways play essential roles in EPAC-dependent proliferation. In agreement with their study, our data suggest that sAC controls the proliferation of prostate carcinoma cells in an EPAC-dependent manner. Inhibition of sAC significantly reduced the activity of Rap1 and suppressed its downstream signaling pathways. Furthermore, stimulation of EPAC with an EPAC-specific cAMP analog prevented the inhibition of Rap1 activity and the antiproliferative effect of sAC inhibition. Therefore, EPAC appears to be a major downstream target of the sAC-dependent cAMP pool.
Rap1 is an important component of the MAPK signal transduction pathway, which plays a pivotal role in cell cycle progression, cell differentiation, and cell division. The activity of Rap1 is regulated by several guanine nucleotide exchange factors, such as EPAC, whereas it is inactivated by GTPase-activating proteins, such as Rap1GAP, SPA-1, and E6TP1. Recently, the tumor-suppressive effects of GTPase-activating proteins have been investigated, and it was found that mutations leading to the loss of their activity promoted malignancy in different tissues (31–33). Furthermore, activation of the EPAC/Rap1 pathway has been shown to stimulate the proliferation and migration of tumor cells (34, 35). Importantly, all previous studies ascribed the cAMP-triggered activation of EPAC/Rap1 signaling to tmAC-derived cAMP. This study outlines a new pathway for cAMP/EPAC/Rap1 signal transduction in the regulation of cell proliferation that is distinct from the known tmAC-dependent signaling pathway.
The antiproliferative effect of sAC inhibition appears to be due to induced cell cycle arrest. How the sAC/EPAC/Rap1 pathway may control the cell cycle is still incompletely understood. A previous study by Qiao et al. (36) demonstrated dramatic alterations in the spatial distribution of EPAC during the cell cycle. In particular, the authors found that EPAC exhibits a predominantly perinuclear localization during interphase, whereas EPAC starts to dissociate from the nuclear envelope during prophase/prometaphase and was observed to associate with the mitotic spindle and the centrosomes in metaphase. In line with these findings, a recent report suggests that MEK1, which is a downstream target of Rap1/B-Raf signaling, plays an essential role in spindle organization and chromosomal stability during mitosis (37). The disruption of this signaling pathway impairs spindle formation (38) and leads to cell cycle arrest in G2 phase (39). A previous report demonstrated that MAPK is activated during the G2/M phase transition (40). Finally, the inhibition of ERK1/2, a kinase downstream of B-Raf and MEK1, induces the down-regulation of cyclin B1, a key protein for the G2/M phase transition, in different cancer cell lines (41). In agreement with this finding, the inhibition of sAC led to the deactivation of Rap1 and the down-regulation of the phosphorylated forms of B-Raf, which were accompanied by suppression of cyclin B1 expression and cell cycle arrest at G2 phase. Together, the previous studies and our present findings support a functional role for EPAC/Rap1 signaling at the G2/M phase transition.
In conclusion, in this study, we have described a novel signaling pathway that controls the proliferation of prostate carcinoma cells. A sAC-specific cAMP pool supports the proliferation of prostate carcinoma cells through promotion of the G2/M phase transition. This function of sAC is PKA-independent and is due to activity of the EPAC/Rap1 pathway.
Acknowledgments
We thank Drs. Lonny Levin and Jochen Buck (Cornell University) for kindly providing the R40 and R21 antibodies (Western blot) and KH7.15. The technical help of Gabi Scheibel and Katja Rezny is gratefully acknowledged.
This work was supported in part by Grant LA 1159/7-1 from the Deutsche Forschungsgemeinschaft and by Forum Grants F690-2010 and F719-2011 from Ruhr University Bochum.

This article contains supplemental Figs. 1–3.
- tmAC
- transmembrane adenylyl cyclase
- sAC
- soluble adenylyl cyclase
- (Rp)-cAMP-S
- (Rp)-adenosine cyclic 3′:5′-monophosphorothioate
- 8-pCPT-cAMP
- 8-(4-chlorophenylthio)-2′-O-methyladenosine cyclic 3′:5′-monophosphate
- LDH
- lactate dehydrogenase.
REFERENCES
- 1. Hochbaum D., Hong K., Barila G., Ribeiro-Neto F., Altschuler D. L. (2008) Epac, in synergy with cAMP-dependent protein kinase (PKA), is required for cAMP-mediated mitogenesis. J. Biol. Chem. 283, 4464–4468 [DOI] [PubMed] [Google Scholar]
- 2. Misra U. K., Pizzo S. V. (2009) Epac1-induced cellular proliferation in prostate cancer cells is mediated by B-Raf/ERK and mTOR signaling cascades. J. Cell. Biochem. 108, 998–1011 [DOI] [PMC free article] [PubMed] [Google Scholar]
- 3. Hewer R. C., Sala-Newby G. B., Wu Y. J., Newby A. C., Bond M. (2011) PKA and Epac synergistically inhibit smooth muscle cell proliferation. J. Mol. Cell. Cardiol. 50, 87–98 [DOI] [PMC free article] [PubMed] [Google Scholar]
- 4. Lucchi S., Calebiro D., de Filippis T., Grassi E. S., Borghi M. O., Persani L. (2011) 8-Chloro-cyclic AMP and protein kinase A I-selective cyclic AMP analogs inhibit cancer cell growth through different mechanisms. PLoS ONE 6, e20785. [DOI] [PMC free article] [PubMed] [Google Scholar]
- 5. Leone V., di Palma A., Ricchi P., Acquaviva F., Giannouli M., Di Prisco A. M., Iuliano F., Acquaviva A. M. (2007) PGE2 inhibits apoptosis in human adenocarcinoma Caco-2 cell line through Ras-PI3K association and cAMP-dependent kinase A activation. Am. J. Physiol. Gastrointest. Liver Physiol. 293, G673–G681 [DOI] [PubMed] [Google Scholar]
- 6. Rudolph J. A., Poccia J. L., Cohen M. B. (2004) Cyclic AMP activation of the extracellular signal-regulated kinases 1 and 2: implications for intestinal cell survival through the transient inhibition of apoptosis. J. Biol. Chem. 279, 14828–14834 [DOI] [PubMed] [Google Scholar]
- 7. Smith P. G., Wang F., Wilkinson K. N., Savage K. J., Klein U., Neuberg D. S., Bollag G., Shipp M. A., Aguiar R. C. (2005) The phosphodiesterase PDE4B limits cAMP-associated PI3K/AKT-dependent apoptosis in diffuse large B-cell lymphoma. Blood 105, 308–316 [DOI] [PubMed] [Google Scholar]
- 8. Zhang L., Insel P. A. (2004) The pro-apoptotic protein Bim is a convergence point for cAMP/protein kinase A- and glucocorticoid-promoted apoptosis of lymphoid cells. J. Biol. Chem. 279, 20858–20865 [DOI] [PubMed] [Google Scholar]
- 9. Calebiro D., Nikolaev V. O., Gagliani M. C., de Filippis T., Dees C., Tacchetti C., Persani L., Lohse M. J. (2009) Persistent cAMP signals triggered by internalized G-protein-coupled receptors. PLoS Biol. 7, e1000172. [DOI] [PMC free article] [PubMed] [Google Scholar]
- 10. Ferrandon S., Feinstein T. N., Castro M., Wang B., Bouley R., Potts J. T., Gardella T. J., Vilardaga J. P. (2009) Sustained cyclic AMP production by parathyroid hormone receptor endocytosis. Nat. Chem. Biol. 5, 734–742 [DOI] [PMC free article] [PubMed] [Google Scholar]
- 11. Chen Y., Cann M. J., Litvin T. N., Iourgenko V., Sinclair M. L., Levin L. R., Buck J. (2000) Soluble adenylyl cyclase as an evolutionarily conserved bicarbonate sensor. Science 289, 625–628 [DOI] [PubMed] [Google Scholar]
- 12. Zippin J. H., Chen Y., Nahirney P., Kamenetsky M., Wuttke M. S., Fischman D. A., Levin L. R., Buck J. (2003) Compartmentalization of bicarbonate-sensitive adenylyl cyclase in distinct signaling microdomains. FASEB J. 17, 82–84 [DOI] [PubMed] [Google Scholar]
- 13. Buck J., Sinclair M. L., Schapal L., Cann M. J., Levin L. R. (1999) Cytosolic adenylyl cyclase defines a unique signaling molecule in mammals. Proc. Natl. Acad. Sci. U.S.A. 96, 79–84 [DOI] [PMC free article] [PubMed] [Google Scholar]
- 14. Tresguerres M., Levin L. R., Buck J. (2011) Intracellular cAMP signaling by soluble adenylyl cyclase. Kidney Int. 79, 1277–1288 [DOI] [PMC free article] [PubMed] [Google Scholar]
- 15. Acin-Perez R., Salazar E., Kamenetsky M., Buck J., Levin L. R., Manfredi G. (2009) Cyclic AMP produced inside mitochondria regulates oxidative phosphorylation. Cell Metab. 9, 265–276 [DOI] [PMC free article] [PubMed] [Google Scholar]
- 16. Kumar S., Kostin S., Flacke J. P., Reusch H. P., Ladilov Y. (2009) Soluble adenylyl cyclase controls mitochondria-dependent apoptosis in coronary endothelial cells. J. Biol. Chem. 284, 14760–14768 [DOI] [PMC free article] [PubMed] [Google Scholar]
- 17. Zippin J. H., Chadwick P. A., Levin L. R., Buck J., Magro C. M. (2010) Soluble adenylyl cyclase defines a nuclear cAMP microdomain in keratinocyte hyperproliferative skin diseases. J. Invest. Dermatol. 130, 1279–1287 [DOI] [PMC free article] [PubMed] [Google Scholar]
- 18. Magro C. M., Crowson A. N., Desman G., Zippin J. H. (2012) Soluble adenylyl cyclase antibody profile as a diagnostic adjunct in the assessment of pigmented lesions. Arch. Dermatol. 148, 335–344 [DOI] [PMC free article] [PubMed] [Google Scholar]
- 19. Barnes D. M., Harris W. H., Smith P., Millis R. R., Rubens R. D. (1996) Immunohistochemical determination of oestrogen receptor: comparison of different methods of assessment of staining and correlation with clinical outcome of breast cancer patients. Br. J. Cancer. 74, 445–451 [DOI] [PMC free article] [PubMed] [Google Scholar]
- 20. Wu K. Y., Zippin J. H., Huron D. R., Kamenetsky M., Hengst U., Buck J., Levin L. R., Jaffrey S. R. (2006) Soluble adenylyl cyclase is required for netrin-1 signaling in nerve growth cones. Nat. Neurosci. 9, 1257–1264 [DOI] [PMC free article] [PubMed] [Google Scholar]
- 21. Rinne A., Littwitz C., Kienitz M. C., Gmerek A., Bösche L. I., Pott L., Bender K. (2006) Gene silencing in adult rat cardiac myocytes in vitro by adenovirus-mediated RNA interference. J. Muscle Res. Cell. Motil. 27, 413–421 [DOI] [PubMed] [Google Scholar]
- 22. Farrell J., Ramos L., Tresguerres M., Kamenetsky M., Levin L. R., Buck J. (2008) Somatic 'soluble' adenylyl cyclase isoforms are unaffected in Sacytm1Lex/Sacytm1Lex 'knockout' mice. PLoS ONE 22, e3251. [DOI] [PMC free article] [PubMed] [Google Scholar]
- 23. Hess K. C., Jones B. H., Marquez B., Chen Y., Ord T. S., Kamenetsky M., Miyamoto C., Zippin J. H., Kopf G. S., Suarez S. S., Levin L. R., Williams C. J., Buck J., Moss S. B. (2005) The “soluble” adenylyl cyclase in sperm mediates multiple signaling events required for fertilization. Dev. Cell 9, 249–259 [DOI] [PMC free article] [PubMed] [Google Scholar]
- 24. Borland G., Smith B. O., Yarwood S. J. (2009) EPAC proteins transduce diverse cellular actions of cAMP. Br. J. Pharmacol. 158, 70–86 [DOI] [PMC free article] [PubMed] [Google Scholar]
- 25. Chen T. C., Hinton D. R., Zidovetzki R., Hofman F. M. (1998) Up-regulation of the cAMP/PKA pathway inhibits proliferation, induces differentiation, and leads to apoptosis in malignant gliomas. Lab. Invest. 78, 165–174 [PubMed] [Google Scholar]
- 26. Dumaz N., Marais R. (2005) Integrating signals between cAMP and the RAS/RAF/MEK/ERK signalling pathways. Based on the anniversary prize of the Gesellschaft fur Biochemie und Molekularbiologie Lecture delivered on 5 July 2003 at the Special FEBS Meeting in Brussels. FEBS J. 272, 3491–3504 [DOI] [PubMed] [Google Scholar]
- 27. Appukuttan A., Kasseckert S. A., Micoogullari M., Flacke J. P., Kumar S., Woste A., Abdallah Y., Pott L., Reusch H. P., Ladilov Y. (2012) Type 10 adenylyl cyclase mediates mitochondrial Bax translocation and apoptosis of adult rat cardiomyocytes under simulated ischaemia/reperfusion. Cardiovasc. Res. 93, 340–349 [DOI] [PubMed] [Google Scholar]
- 28. Massard C., Fizazi K. (2011) Targeting continued androgen receptor signaling in prostate cancer. Clin. Cancer Res. 17, 3876–3883 [DOI] [PubMed] [Google Scholar]
- 29. Merkle D., Hoffmann R. (2011) Roles of cAMP and cAMP-dependent protein kinase in the progression of prostate cancer: cross-talk with the androgen receptor. Cell. Signal. 23, 507–515 [DOI] [PubMed] [Google Scholar]
- 30. Kiermayer S., Biondi R. M., Imig J., Plotz G., Haupenthal J., Zeuzem S., Piiper A. (2005) Epac activation converts cAMP from a proliferative into a differentiation signal in PC12 cells. Mol. Biol. Cell 16, 5639–5648 [DOI] [PMC free article] [PubMed] [Google Scholar]
- 31. Zheng H., Gao L., Feng Y., Yuan L., Zhao H., Cornelius L. A. (2009) Down-regulation of Rap1GAP via promoter hypermethylation promotes melanoma cell proliferation, survival, and migration. Cancer Res. 69, 449–457 [DOI] [PubMed] [Google Scholar]
- 32. Poetsch M., Dittberner T., Woenckhaus C. (2003) Microsatellite analysis at 1p36.3 in malignant melanoma of the skin: fine mapping in search of a possible tumour suppressor gene region. Melanoma Res. 13, 29–33 [DOI] [PubMed] [Google Scholar]
- 33. Sjöblom T., Jones S., Wood L. D., Parsons D. W., Lin J., Barber T. D., Mandelker D., Leary R. J., Ptak J., Silliman N., Szabo S., Buckhaults P., Farrell C., Meeh P., Markowitz S. D., Willis J., Dawson D., Willson J. K., Gazdar A. F., Hartigan J., Wu L., Liu C., Parmigiani G., Park B. H., Bachman K. E., Papadopoulos N., Vogelstein B., Kinzler K. W., Velculescu V. E. (2006) The consensus coding sequences of human breast and colorectal cancers. Science 314, 268–274 [DOI] [PubMed] [Google Scholar]
- 34. Zhang L., Chenwei L., Mahmood R., van Golen K., Greenson J., Li G., D'Silva N. J., Li X., Burant C. F., Logsdon C. D., Simeone D. M. (2006) Identification of a putative tumor suppressor gene Rap1GAP in pancreatic cancer. Cancer Res. 66, 898–906 [DOI] [PubMed] [Google Scholar]
- 35. Baljinnyam E., De Lorenzo M. S., Xie L. H., Iwatsubo M., Chen S., Goydos J. S., Nowycky M. C., Iwatsubo K. (2010) Exchange protein directly activated by cyclic AMP increases melanoma cell migration by a Ca2+-dependent mechanism. Cancer Res. 70, 5607–5617 [DOI] [PubMed] [Google Scholar]
- 36. Qiao J., Mei F. C., Popov V. L., Vergara L. A., Cheng X. (2002) Cell cycle-dependent subcellular localization of exchange factor directly activated by cAMP. J. Biol. Chem. 277, 26581–26586 [DOI] [PubMed] [Google Scholar]
- 37. Cao J. N., Shafee N., Vickery L., Kaluz S., Ru N., Stanbridge E. J. (2010) Mitogen-activated protein/extracellular signal-regulated kinase kinase 1act/tubulin interaction is an important determinant of mitotic stability in cultured HT1080 human fibrosarcoma cells. Cancer Res. 70, 6004–6014 [DOI] [PMC free article] [PubMed] [Google Scholar]
- 38. Borysova M. K., Cui Y., Snyder M., Guadagno T. M. (2008) Knockdown of B-Raf impairs spindle formation and the mitotic checkpoint in human somatic cells. Cell Cycle 7, 2894–2901 [DOI] [PubMed] [Google Scholar]
- 39. Wright J. H., Munar E., Jameson D. R., Andreassen P. R., Margolis R. L., Seger R., Krebs E. G. (1999) Mitogen-activated protein kinase kinase activity is required for the G2/M transition of the cell cycle in mammalian fibroblasts. Proc. Natl. Acad. Sci. U.S.A. 96, 11335–11340 [DOI] [PMC free article] [PubMed] [Google Scholar]
- 40. Hayne C., Tzivion G., Luo Z. (2000) Raf-1/MEK/MAPK pathway is necessary for the G2/M transition induced by nocodazole. J. Biol. Chem. 275, 31876–31882 [DOI] [PubMed] [Google Scholar]
- 41. Xu Y., Liu L., Qiu X., Jiang L., Huang B., Li H., Li Z., Luo W., Wang E. (2011) CCL21/CCR7 promotes G2/M phase progression via the ERK pathway in human non-small cell lung cancer cells. PLoS ONE 6, e21119. [DOI] [PMC free article] [PubMed] [Google Scholar]