Abstract
A microscopy technique, spatial-domain low-coherence quantitative phase microscopy (SL-QPM) is proposed for speckle-free, quantitative phase imaging of subcellular structures with subnanometer sensitivity. We quantified, for the first time to our knowledge, the refractive index of the cell nuclei on original unmodified histology specimens. We demonstrate that the refractive index of cell nucleus is highly sensitive in detecting cancer, especially in histologically normal-appearing cells from cancer patients. Because this technique is sensitive and does not require special sample processing, it can be disseminated to all clinical settings.
The ability to quantitatively interrogate cell architecture, especially at the nanoscale level, is of great importance for many biomedical applications. Conventional light microscopy does not provide sufficient quantitative information on subcellular organelles of a biological cell. Quantitative phase microscopy has emerged as an important technique for the investigation of cell structures and dynamics [1,2] owing to the ultrasensitivity of light interference effect to detect nanoscale structural alterations. The recent development of a common-path interferometer has effectively eliminated the notorious external noise artifacts that have hampered the biological applicability of quantitative phase microscopy [3,4]. However, the clinical applications of quantitative phase microscopy, especially cancer diagnosis, have not been extensively explored. Several factors may contribute, such as speckle noise, difficulty for clinical implementation of patient sample preparations, and lack of known diagnostic quantitative parameters.
In this Letter, we present spatial-domain low-coherence quantitative phase microscopy (SL-QPM), which produces a speckle-free nanoscale-sensitive map of optical path length differences of subcellular architecture. We validate this technique by experiments with a U.S. Air Force (USAF) resolution target and polystyrene microspheres. We quantified, for the first time to our knowledge, the refractive index of the cell nuclei on original unmodified histology specimens. We demonstrate the high sensitivity of refractive index of the cell nucleus in detecting cancer, especially in those cells labeled as “normal” by pathologists, showing the great potential of SL-QPM in cancer diagnosis.
Three major technical characteristics of SL-QPM contribute to its high sensitivity and clinical applicability: reflectance-mode, low spatial-coherence illumination from a thermal light source, and spectroscopic detection. Because of the reflectance-mode geometry, the phase-matching condition picks up the largest possible wave vectors in the Fourier-space representation of the refractive structure of the object, which carry information about its finest features. Importantly, compared to conventional transmission-mode light microscopy, the reflectance mode effectively suppresses the effect of absorption owing to the staining reagents commonly used in most clinical cytology or histology specimens and highlights the interference signals. The illumination from a thermal light source coupled with a low-NA objective provides a low transverse spatial-coherence length [approximately 700 nm (ac ~ λ0/2NA)] [5], which serves as a virtual aperture to eliminate the speckle noise and decompose a three-dimensional complex scattering medium into many one-dimensional channels. White-light spectroscopic detection allows us to quantify the phase information of the scattering object through the spectral analysis of wavelength-dependent interference signals. The glass substrate and tissue components of the histology slides serve as a reference and a sample, respectively, that share a common path, effectively eliminating the slightest external disruptions that may compromise the ultrahigh sensitivity.
The details of the hardware design of SL-QPM are described elsewhere [6]. In brief, a broadband white light from a Xenon-arc lamp was collimated by a 4f system (divergence angle of ~0.8°) and then focused onto the sample by a low-NA objective (NA = 0.4). The reflectance-mode scattering signals were collected and projected by a tube lens onto the slit of an imaging spectrograph coupled with the CCD camera mounted on a scanning stage. The magnification of the system is about 44. By linearly scanning the slit of the spectrograph with a 10 μm step size, the reflectance-mode microscopic image is acquired. The detected signal is related to the sample and reference electric field (Es, Er) as [7]
where k represents the free-space wavenumber, (x, y) represents the spatial position of each pixel, and ϕ(x, y) is the phase difference between the reference and sample beams at each pixel.
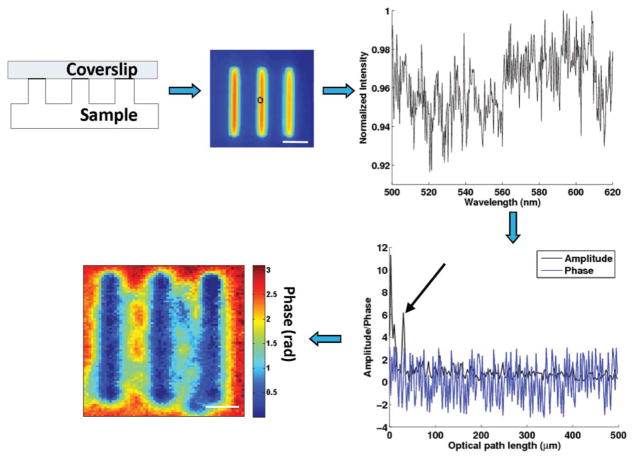
The procedure for the data processing is summarized in Fig. 1. The backscattering spectrum from each pixel is normalized by the spectral profile of the optical system, which accounts for the wavelength-dependent response of the light source and optical components. Each spectrum is numerically resampled to evenly spaced wave-numbers and multiplied by a Hanning window before applying a fast Fourier transform. The Fourier-transformed data at the prominent peak corresponding to the depth of interest z were selected for phase processing. The depth-resolved phase map ϕ(x, y) was extracted by
Fig. 1.
(Color online) Signal processing steps of SL-QPM system. The spectrum from each pixel (bandwidth from 500 to 620 nm) is interpolated, windowed prior to performing fast Fourier transform. The predominant peak corresponding to the depth of interest is chosen for phase processing. The two-dimensional quantitative phase map can be obtained by repeating these steps pixel by pixel. The scale bar indicates 5 μm.
from a complex-valued F(z) (an axial spatial cross-correlation function). The subnanometer-sensitive phase map can be obtained by plotting the phase variation at certain depth plane. The corresponding optical path length (OPL) can be derived by
where λ0 is the source center wavelength (i.e., 550 nm) and ϕ(x, y) is the phase at each pixel. The OPL is related to the refractive index of the scattering object by
where 〈n(x, y)〉 is the average refractive index along the axial direction (i.e., z direction) and L(x, y) is the corresponding physical thickness at a specific pixel (x, y). The phase stability of SL-QPM is characterized to be 0.9 nm, as determined by the standard deviation of the histogram of measured phase performed for ~3 min.
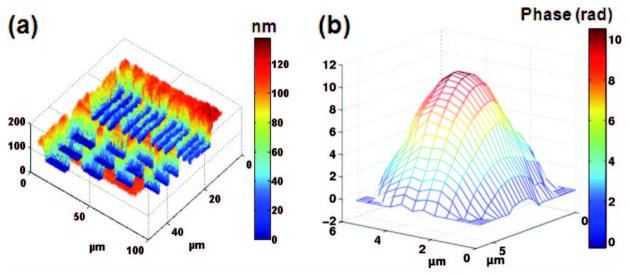
To demonstrate the performance of SL-QPM for quantitative imaging, a USAF resolution target and polystyrene microspheres are used as testing objects. To map the nanoscale depth profile of the patterned chrome on a USAF resolution target (Edmund Optics), the reference coverslip was suspended on the top of the resolution target. The measured OPL was converted to the physical depth information by dividing the OPL by the refractive index of the air (n = 1). Figure 2(a) shows the depth profile of the smallest bar on the target, of which the spatial period is 4.4 μm. The height of the patterned chrome layer on the USAF target was measured to be 120 nm, consistent with the reported values in the literature [3].
Fig. 2.

(a) Depth profile of USAF resolution target showing elements of group 7. The color bar represents the unit of nanometer. (b) Phase map of a 5 μm polystyrene microsphere. The color bar represents the phase in radians. Phase unwrapping program is used to correct the phase jump of 2π.
In the experiment with polystyrene microspheres, the sample consists of a glass coverslip (thickness d ~ 170 μm) with monodispersed polystyrene microspheres (ThermoFisher Scientific), which were uniformly smeared and dried from 10 μl of aqueous solution onto the glass surface. The phase map of the microsphere clearly shows its spherical profile [Fig. 2(b)]. The diameter of the microsphere is experimentally determined to be 4.92 μm (with the microsphere refractive index n = 1.59), which is close to the manufacturer-reported diameter of 5.003 ± 0.04 μm.
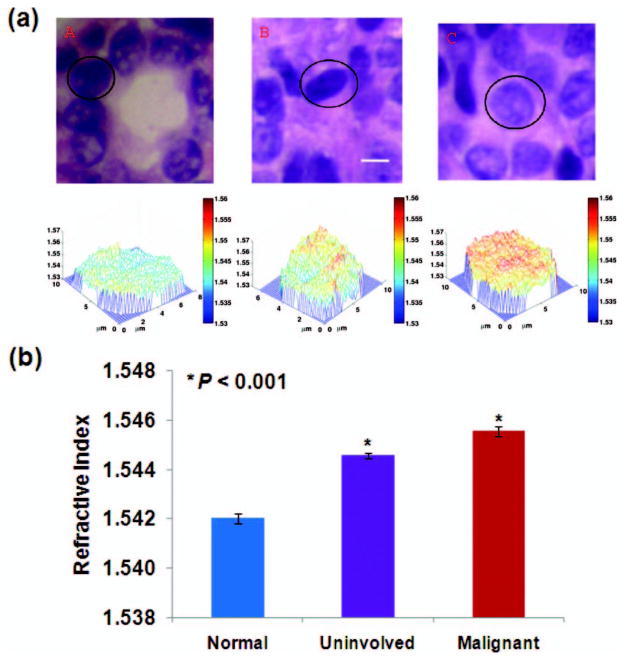
To demonstrate the capability of SL-QPM for clinical cancer diagnosis, we evaluated original unmodified histology specimens of breast biopsies processed with standard clinical protocol (formalin fixed, paraffin embedded, and stained with hematoxylin and eosin). The slides were reviewed by an expert pathologist who marked the region of interest. The refractive index was determined by dividing the measured OPL by the known physical thickness of the tissue section (i.e., 4 μm) controlled by the microtome. We confirmed that the selected OPL of the cell nucleus is not affected by the absorption profile of the histology stain, with a distinct spatial frequency peak in the Fourier-transformed spectrum from that of the stain alone (data not shown). We analyzed the nuclear refractive index maps from three groups of cells (five patients from each group): (a) normal cells from healthy patients undergoing reduction mammoplasty, (b) uninvolved cells (i.e., cells from patients with invasive cancer that were called normal by pathological diagnosis), and (c) malignant cells (i.e., cells that were histologically called malignant from patients with invasive cancer). We analyzed the cell nuclei within the marked region of interest and the pathological status of all the cells (normal, uninvolved, or malignant) were confirmed by the expert pathologist. Figure 3(a) shows the representative histology image and the corresponding refractive index map of cell nuclei from each group. The average refractive index of the cell nucleus 〈nnu〉 of histology slides is in the range of 1.53 to 1.56, consistent with previously reported values [8]. Evidently, there is a progressive increase of 〈nnu〉 in normal, uninvolved, and malignant cells. More importantly, 〈nnu〉 is significantly elevated, even in the uninvolved cells from cancer patients are marked as “normal” by pathological diagnosis, when compared to normal cells from healthy patients. The statistical significance is also achieved (P < 0.001) by comparing 〈nnu〉 from approximately 30 randomly selected cell nuclei within the marked region of interest, as shown in Fig. 3(b).
Fig. 3.
(a) Representative histology images and the corresponding refractive index maps of cell nuclei from (a) normal, (b) uninvolved, and (c) malignant cells. The scale bar indicates 5 μm. (b) By analyzing approximately 30 cell nuclei per group, the average refractive indices of malignant and uninvolved cell nuclei are significantly increased when compared to the normal cell nuclei (t-test, two-sided P value <0.001).
In conclusion, we developed SL-QPM that generates a speckle-free and nanoscale-sensitive quantitative phase map. We demonstrate the promise of this technique for improving cancer diagnosis through characterizing the alterations of refractive index of cancer cell nuclei on original histology specimens prepared with standard clinical protocols, especially its potential in detecting cancer from histologically normal-appearing cells. This technique opens up a new possibility of investigating the unmodified and archived clinical specimens for early detection and prognosis of cancer. In the future, this technique may be used for characterization of cell and tissue nanoarchitectures of clinical specimens, or identification of diagnostically valuable optical parameters associated with disease-specific subcellular characteristics.
Acknowledgments
The work was supported by the National Cancer Institute (R21CA138370), the Shirlie and Owen Siegel Foundation, and the University of Pittsburgh Medical Center. P. Wang is supported by the National Energy Technology Laboratory Research Participation Program.
References
- 1.Joo C, Akkin T, Cense B, Park BH, de Boer JF. Opt Lett. 2005;30:2131. doi: 10.1364/ol.30.002131. [DOI] [PubMed] [Google Scholar]
- 2.Fang-Yen C, Chu MC, Seung HS, Dasari RR, Feld MS. Opt Lett. 2004;29:2028. doi: 10.1364/ol.29.002028. [DOI] [PubMed] [Google Scholar]
- 3.Sarunic MV, Weinberg S, Izatt JA. Opt Lett. 2006;31:1462. doi: 10.1364/ol.31.001462. [DOI] [PubMed] [Google Scholar]
- 4.Lue N, Choi W, Badizadegan K, Dasari RR, Feld MS, Popescu G. Opt Lett. 2008;33:2074. doi: 10.1364/ol.33.002074. [DOI] [PMC free article] [PubMed] [Google Scholar]
- 5.Indebetouw G, Klysubun P. J Opt Soc Am. 2001;A 18:319. doi: 10.1364/josaa.18.000319. [DOI] [PubMed] [Google Scholar]
- 6.Liu Y, Li X, Kim YL, Backman V. Opt Lett. 2005;30:2445. doi: 10.1364/ol.30.002445. [DOI] [PubMed] [Google Scholar]
- 7.Wax A, Yang C, Izatt JA. Opt Lett. 2003;28:1230. doi: 10.1364/ol.28.001230. [DOI] [PubMed] [Google Scholar]
- 8.Naser-Kolahzadeh ZP, Stavrianopoulos JG. Mounting medium for microscope slide preparations. 5,492,837. US patent. 1996 Feb 20;


