

Abstract
Herein, murine prostate cancer cell lines, generated via selective transduction with a single oncogene (c-Myc, Ha-Ras, and v-Src), demonstrated oncogene-specific prostate cancer molecular signatures that were recapitulated in human prostate cancer, and developed lung metastasis in immune competent mice. Interrogation of two independent retrospective cohorts of patient samples using the oncogene signature demonstrated an ability to distinguish tumor from normal prostate with a predictive value for prostate cancer of 98 – 99%. In a blinded study, the signature algorithm demonstrated independent substratification of reduced recurrence free survival by Kaplan-Meier analysis. The generation of new oncogene-specific prostate cancer cell lines that recapitulate human prostate cancer gene expression, that metastasize in immune-competent mice, are a valuable new resource for testing targeted therapy while the molecular signatures identified herein provides further value over current gene signature markers of prediction and outcome.
INTRODUCTION
Prostate cancer remains the most common non-dermatological cancer in the United States and the second leading cause of cancer death amongst men with ~190,000 new cases diagnosed and ~27,000 deaths annually. The adoption of screening with serum prostate specific antigen (PSA) has led both to the earlier detection of prostate cancer and to the improved understanding of the biological heterogeneity of the disease. Risk stratification following local therapy has used histopathological criterion, gleason scale, tumor grade, the degree of tumor differentiation, and serum PSA. The diverse clinical behavior of prostate cancer with some patients dying within 2 years of diagnosis and others living for 20 years with localized disease emphasizes the need for improved prognostic tests.
The molecular mechanisms contributing to prostate cancer recurrence and therapy resistance are poorly understood. Androgen ablation therapy results in a 60% to 80% initial response rate (1), however ~30% of men who receive radical prostatectomy relapse, attributed to micrometastatic disease. Clinical classification nomograms are used that incorporate individual pre- and post-operative parameters. These clinically efficient models have limited value in predicting the diverse outcomes of patients with similar clinical, histological and biochemical parameters. A global pathway analysis view of the prostate cancer genome identified the most commonly altered pathways as the AR, Rb, PI3K and Ras/Raf signaling (2). The use of gene expression analysis has identified a subset of gene clusters that correlated in retrospective analysis with therapy outcomes (3, 4). Biomarkers derived from gene expression profiling studies that use the same data set for signature discovery and validation (5, 3, 6) typically however, demonstrated limited utility when used to re-interrogate independent data sets (7).
Molecular analysis of human prostate cancer has demonstrated increased c-Myc expression and/or copy number in up to 30% of prostate tumors. Murine prostate tumors induced by prostate targeted c-Myc give rise to tumors with molecular features of human prostate cancer (8). c-Myc, which is overexpressed in human prostate cancer is sufficient to induce prostatic intraepithelial neoplasia (PIN) in transgenic mice (8). In contrast, Ras mutations are relatively uncommon, however induction of Ras effector pathways has been revealed by microarray and genomic analysis (2). Up-regulation of Ras-mediated signaling cascades may also reflect the overexpression of autocrine and paracrine factors (EGFR, TGFα) (9). Although there are conflicting results over whether ErbB2 is overexpressed or amplified in prostate cancer, a subpopulation of prostate cancer patients demonstrated a gene expression pathway of activated ErbB2 signaling (10). Activation of the Src pathway is also found in primary prostate cancer associated with a truncated version of c-kit (11), and a subset of human prostate cancers express a Src signature (10).
The current studies were conducted to address several key needs. Firstly, the development of new therapies for prostate cancer requires model systems that closely resemble human disease. Unfortunately, to date there have been several limitations with currently available cell lines. Although important transplantation experiments have been conducted using human prostate cancer cell lines in immune deficient animals, the immune system plays an important role in prostate cancer onset and progression (12, 13) making it imperative to develop prostate cancer cell lines that can be studied in immune competent animals. Secondly, genome wide expression studies of prostate cancer cell lines demonstrated only a small number of genes with concordant expression in malignant prostate tissue (14). Thirdly, prostate cancer in humans is associated with bone and lung metastasis however only a single cell line, a product of Myc and Ras transduction has been developed that develops bone metastasis in immune-competent mice (15). Fourthly, although the transgenic mouse had been effectively deployed as a model to study the molecular basis of human cancers the prostate cancer mouse models have long latency and often unpredictable metastasis (16).
The current studies aimed to generate oncogene specific cell lines that could be grown in immune-competent mice, determine whether the lines recapitulate human prostate cancer and validate the signature in distinct populations of patients as a prognostic test. Herein, oncogene transduction of murine prostate epithelium induced prostate cellular transformation with invasive and metastatic properties. Oncogene-specific molecular signatures were defined that distinguished benign from malignant human prostate and predicted outcome of human prostate cancer patients. The generation of oncogene-specific prostate cancer cell lines that recapitulate molecular signatures of human prostate cancer will be of value in understanding molecular mechanisms and identification of new therapies for this disease.
MATERIALS AND METHODS
Mice, cell culture, chemicals and reagents
The experimental procedures with transgenic mice were approved by the ethics committee of Thomas Jefferson University. Mice were in the FVB strain. Mouse prostate epithelial cell cultures were isolated from prostate glands of 12 week old male mice and maintained as previously described (17) and analyzed after 25 passages with at least three lines of each genotype. Transduction of cells by the retroviral expression vector encoding either c-Myc, Ha-Ras, v-Src, NeuT, in the vector pBABE-IRES-GFP, was previously described (18, 19).
Cellular growth assays
Cells were seeded in 24-well-plates at a concentration of 1×10⁴ cells / well, with each sample in triplicate for 7 days. Transformed cells were grown in DMEM medium with 10% FBS, while control PEC cells were cultured in prostate epithelial primary culture medium. Cells were harvested, suspended in 100 μl PBS, and an equal volume of 0.4% Trypan blue added after 5 minutes. Cells were counted using a Countess™ Automated Cell Counter (C10227, Invitrogen Carlsbad, CA).
Colony Formation in Soft Agar
Cells (3×10³/ml) were seeded into 0.3% soft agar Sigma) in a suspension dish (Nalgene Nunc International, Rochester, NY). Colonies were stained by 0.04% crystal violet acetate and counted under a vertical microscope after 2 weeks of incubation.
Tumor Formation Assay and Detection of Lung Metastasis
1×10⁶ cells suspended in a 100 μl volume were injected subcutaneously into 7~8 week old FVB male mice. The cell suspension was mixed with a 20% by volume BD Matrigel (BD Biosciences, Bedford, MA), resulting in a final cell concentration of 107 cells/ml. Tumor growth was measured by vernier calipers twice a week. Tumor samples were harvested after 30 days (except NeuT-induced tumors which were harvested after 16 days). 30 mice were examined. At autopsy the presence of lung metastasis was examined by visualization and palpation. All lungs were subsequently analyzed for metastasis by histological sections of hematoxylin and eosin stained specimens. The prostate cancer lung metastases were confirmed by a trained pathologist to show similar histology to the parental line, with migration of cells through the basement membrane. Ten sections were examined per lung at 100 μm separation. No formal analyses of bone metastasis or lymph node infiltration were conducted in these studies.
Statistical Analysis
Comparisons between groups were analyzed by two-sided t-test. A difference of P < 0.05 was considered to be statistically significant. All analyses were done with SPSS 11.5 software. Data are expressed as mean ± SEM.
RESULTS
Oncogene transformed prostate cell lines convey contact-independent growth
Primary prostate epithelial cell cultures were established from the ventral prostates of FVB mice. Cells were transduced with retroviral expression vectors encoding a single distinct oncogene (c-Myc, Ha-Ras (V-12), v-Src and NeuT, an activating mutant of ErbB2). The cellular morphology of the prostate epithelial cells was altered over the four-week period (Fig. 1A). Individual colonies of oncogene-transduced cells were selected and characterized. Cellular growth assays were conducted by cell counting (Fig. 1B). A substantial growth advantage was observed in each oncogene transduced cell line compared with primary prostate epithelial cells.
Figure 1. Oncogene transduced PEC lines form colonies in soft agar.
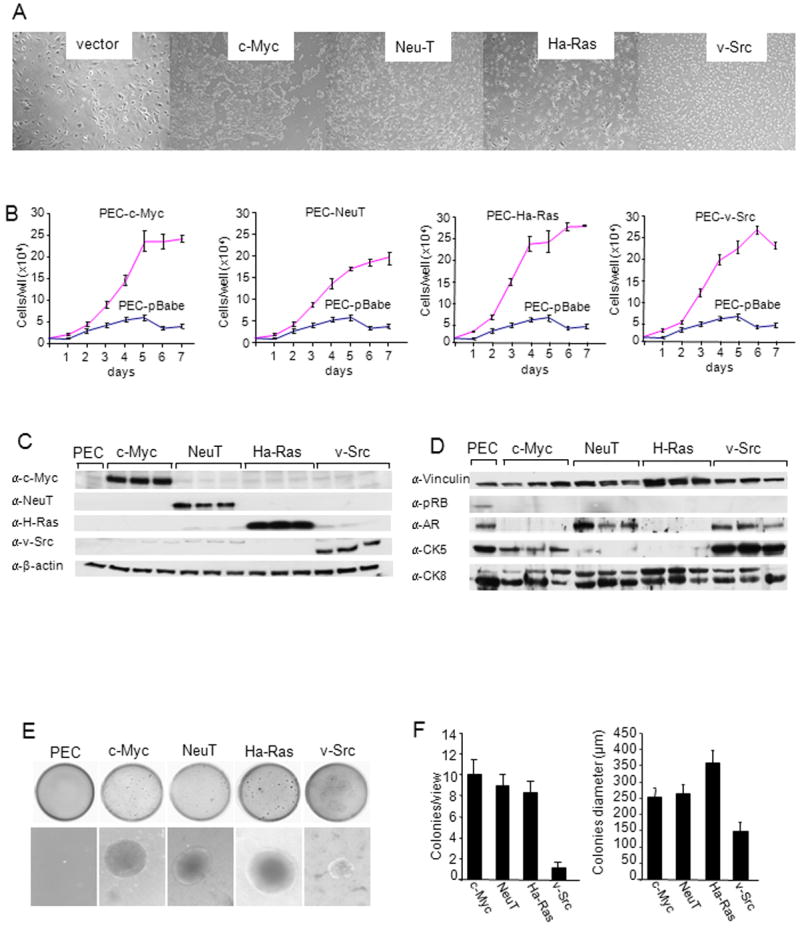
(A)Phase contrast microscopy of oncogene induced cell lines were transduced by distinct oncogenes (c-Myc, NeuT, Ha-Ras, v-Src). Photo of individual colonies derived from oncogene-transduced PEC that were selected and characterized. (B) Growth curves of PEC lines determined by cell counting. Data are mean ± SEM of N>3 separate experiments. (C, D) Western Blot analysis of 3 separate clones of each oncogene induced PEC with antibodies as shown for detection of c-Myc, NeuT, Ha-Ras and v-Src and (D) markers of basal (CK5) vs luminal (CK8) prostate cancer. GDI is used as a protein loading control. (E) Soft agar assays of oncogene transduced PEC. Non-transformed PEC failed to grow in soft agar. The size and number (F) of colonies from oncogene transduced PEC lines are shown as mean ± SEM of N>5 separate experiments.
Western blot analysis was conducted to examine the relative expression of each of the oncogenes used to transduce the PEC. The presence of oncogenic c-Myc, Ha-Ras, ErbB2 and v-Src was identified by Western blot (Fig. 1C). The increase in abundance of each oncogene was specific to each cell line (Fig. 1C). The prostate tumor cell lines expressed prostate epithelial cell markers including cytokeratin 5 (CK5) and CK8, and were either androgen receptor (AR) positive (NeuT, v-Src) or AR negative (c-Myc, Ha-Ras) (Fig. 1D). Oncogene transformation of fibroblasts or murine epithelial cells conveys contact-independent growth in solid agar. The oncogene transduced PEC lines were examined for growth in soft agar. Colony size and number were characterized for each oncogene (Fig. 1E). Non-transformed PECs failed to grow in soft agar as previously described. Oncogene transduction increased the size and number of colonies (Fig. 1F).
As changes in genome copy number and/or genome structure contribute to tumor progression (20, 21), we conducted genome copy number analysis using array CGH (see Materials and Methods). The cell lines, like human prostate cancer, exhibited genomic gains and losses (Fig. 2A, B). Genome abnormalities were similar within each oncogene transformed line. The genome copy number abnormality profiles demonstrated distinct levels of genomic complexity. Greater complexity and number of abnormalities was identified in the NeuT lines, followed by the c-Myc lines. Ha-Ras lines showed low level abnormalities (Fig. 2A). Copy aberration associated with the human prostate cancer derived from 205 primary and metastatic prostate cancer samples (Materials and Methods), were then compared with the genomic aberration of the oncogene transformed cell lines (Fig. 2C, D). The frequency and copy aberrations associated with the human prostate cancer samples are shown on the right of each schematic. Significant fidelity of conservation between genomic alterations in the prostate cell lines and alterations found in human prostate cancer was observed. Analysis of the individual genes within the regions deleted or amplified for each cell line was conducted and tabulated (Supplemental Table 1). Approximately 2400 genes are included within these regions. A comparison of gene expression and copy number demonstrated the relative frequency of coincident changes (Fig. 2D).
Figure 2. Copy number aberrations in the four oncogene cell lines assessed by array CGH.
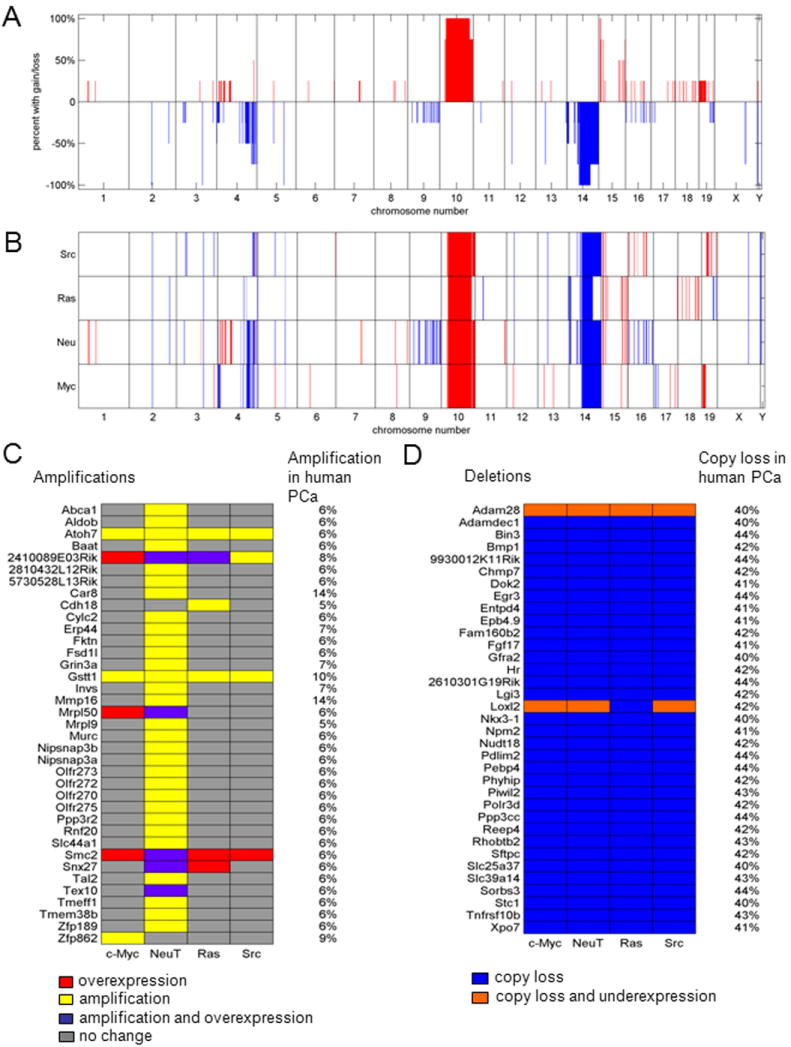
(A) The percentage of the four cell lines sharing copy gain or loss regions is shown as a function of genomic position. (B) Regions of copy gain (red) or loss (blue) for each of the four cell lines are shown as a function of genomic position. (C) Oncogenes are identified with mRNA over-expression (red), DNA amplification (yellow), or both (purple) among the four oncogene cell lines, with corresponding amplification in the MKSCC prostate cancer database (listed on right-hand side). (D) Tumor suppressor genes are identified with mRNA under expression only (blue) or both mRNA under expression and DNA copy loss (orange) among the four oncogene cell lines, with corresponding copy loss in the MKSCC prostate cancer database (listed on right-hand side).
Lung metastases of prostate cancer cell lines
Tumor formation studies were conducted in FVB mice. Each of the prostate tumor lines grew subcutaneously in immune competent mice. Growth was sustained for c-Myc, Ha-Ras and v-Src transformed PECs (Fig. 3A). The extirpated tumors were hemorrhagic (Fig. 3B) with histological features of prostate adenocarcinoma (Fig. 3C, Supplemental Fig. 1). Immunostaining of tumors for Von Willebrand factor (VWF) confirmed angiogenesis and demonstrated significantly greater VWF staining in tumors induced by Ha-Ras (Supplemental Fig. 2A). Lung metastases were characterized at autopsy by histopathological assessment as described in the Materials and Methods (Fig. 4A). The number of lung metastases derived from subcutaneous injection of the primary PECs was increased in the Ha-Ras, v-Src, and c-Myc sublines (Fig. 4B).
Figure 3. Prostate epithelial cell lines grow in immune competent mice.
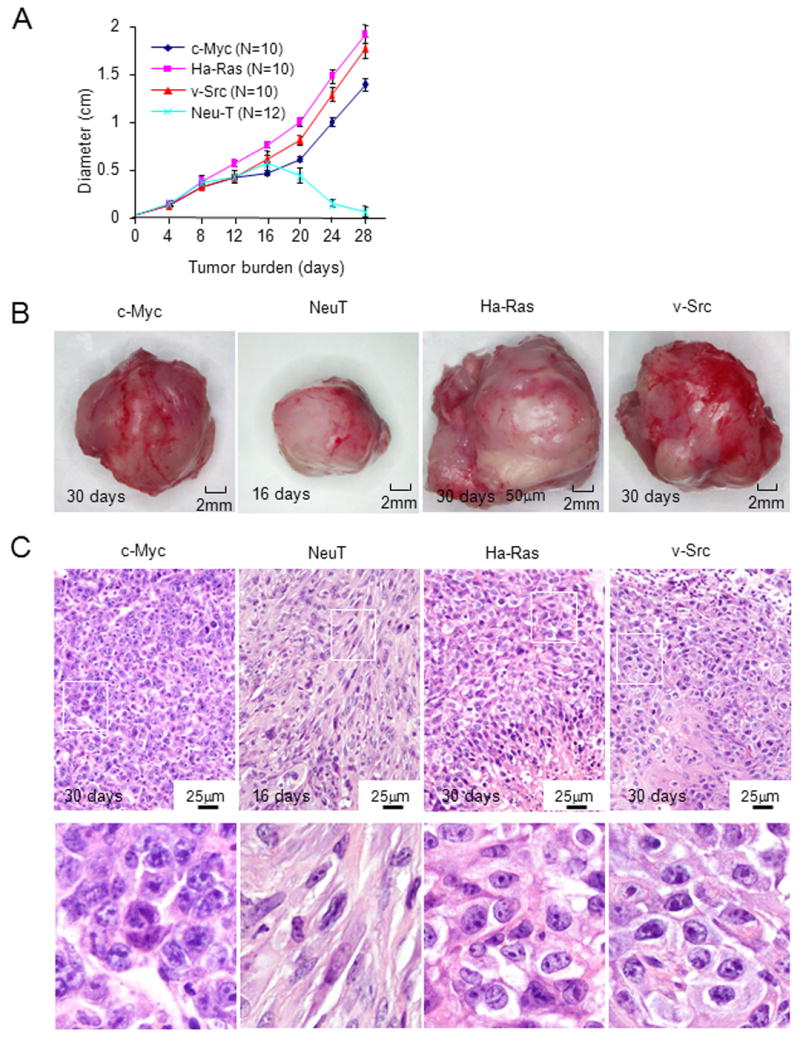
(A) PEC tumor diameter determined by vernier caliper measurement is shown as days after inoculation in FVB mice. The diameter mean ± SEM for N>5 separate experiments. (B) Photograph of representative tumor derived from oncogene-induced lines. NeuT induced tumors were harvested at 15 days after cell injection. (C) Hematoxylin and eosin staining at low and high magnification (see also Supplemental Fig. 1).
Figure 4. Oncogene transformed prostate epithelial cell tumors metastasize to lung.
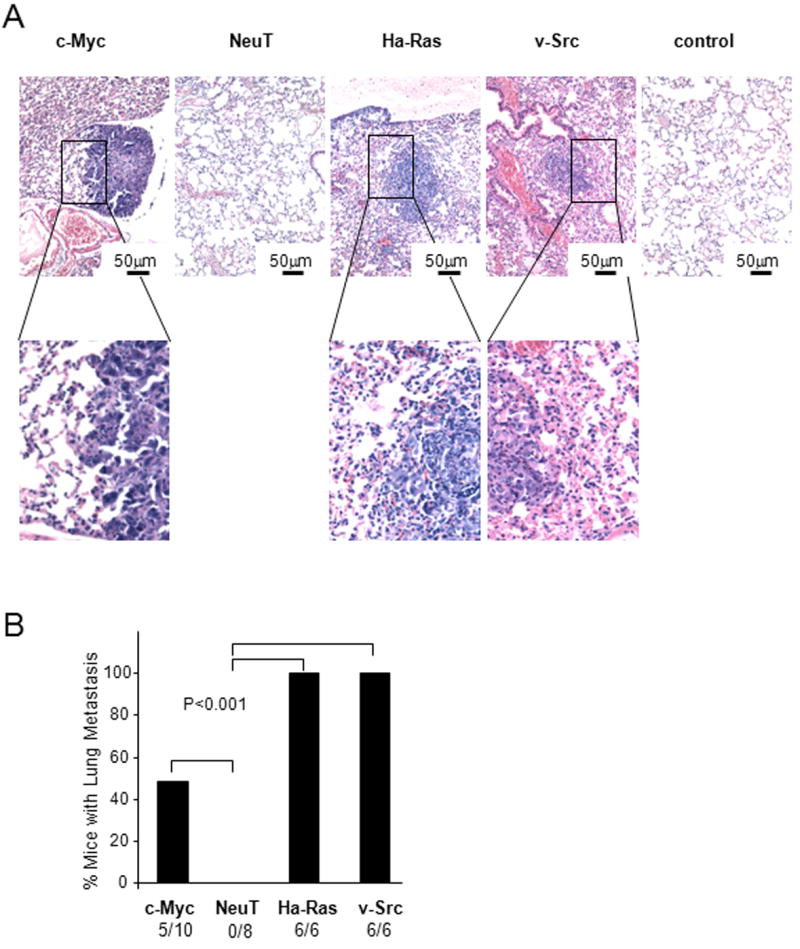
(A) Hematoxylin and eosin stain of murine lung post tumor implantation demonstrating representative example of lung metastasis. (B) Frequency of lung metastases were detected in mice for c-Myc, NeuT and v-Src PEC groups 5 weeks after subcutaneous injection. The rates were 100% frequency in Ha-Ras and v-Src groups.
Oncogene specific molecular signatures in prostate cancer cell lines
In order to further characterize the molecular genetic signaling pathways regulated by specific oncogenes in prostate epithelial cells, mRNA was prepared from the oncogene transformed PEC cell lines. Microarray analysis identified a total of 2635 out of 22115 genes that were significantly altered in expression (at least two-fold change) in oncogene over-expressing cell lines when compared with non-transformed prostate epithelial cell control samples (Fig. 5A). The rows of the heatmap represent unique genes and are displayed by their pattern of up- and down-regulation for all four of the oncogene induced cell lines. For example Group 1 contains genes that share concordant differential expression patterns across all four cell lines, while group 15 contains genes whose differential expression is specific to the v-Src cell lines. A sizable number of up- and down-regulated genes were shared amongst all four cell lines (Group 1; 251 genes). Genes with up and down-regulation specific to Ha-Ras were the most prevalent (Group 14; 584 genes), followed by c-Myc-specific genes (Group 8; 332 genes), NeuT-specific genes (Group 12; 277 genes), and v-Src-specific genes (Group 15; 215 genes).
Figure 5. Differential gene expression patterns in transformed PEC cell lines.
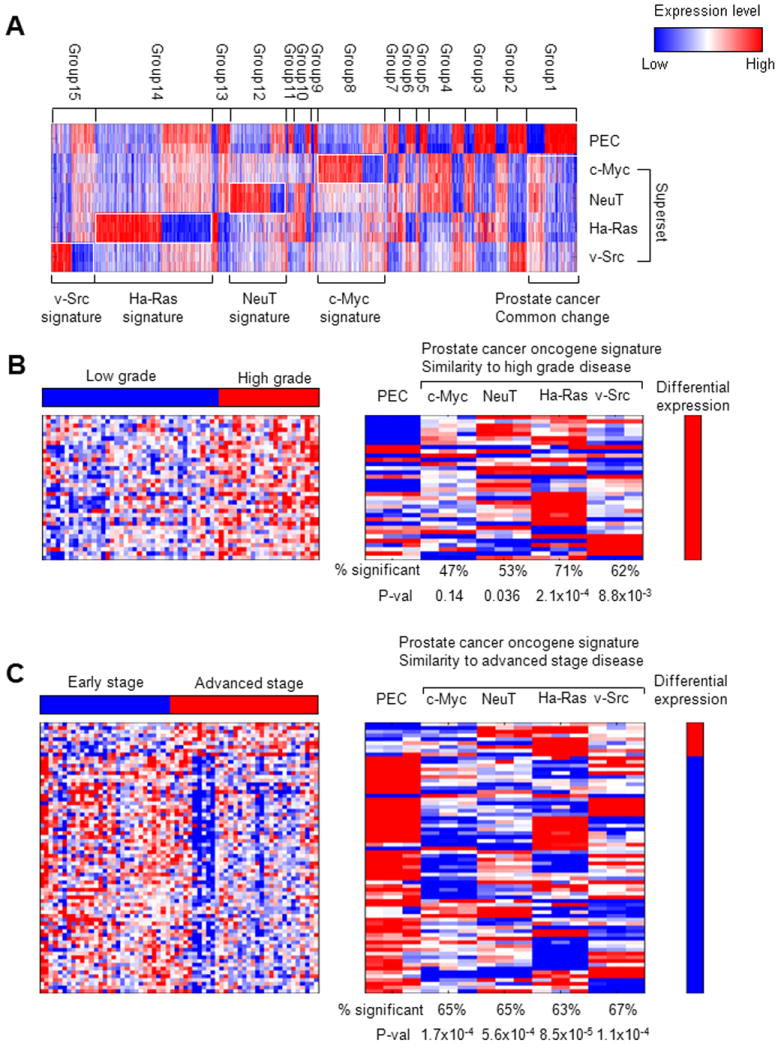
A heatmap (A) provides an overview of the differential expression patterns among four distinct oncogene transformed cell lines. Heatmaps of genes that are differentially expressed in the four oncogene transformed PEC lines and differentially expressed genes in (B) high grade vs. low grade and (C) advanced stage vs early stage prostate cancer (4). Heatmaps of the left-hand side represent the prostate cancer high grade and advanced stage signatures, while heatmaps on the right represent genes that are differentially expressed in at least one of the four prostate cancer cell lines. The percentage of the 34 high-grade and 72 advanced-state genes that are differentially expressed within each individual prostate cancer cell line is shown in the respective columns along with the p value for the degree of similarity with the high grade and advanced stage phenotypes.
The murine prostate oncogene expression signature in high grade and advanced stage human prostate cancer
The prostate “oncogene expression signature” (Group 1) was defined as genes that were significantly altered in expression level and that were uniquely altered in expression by a specific oncogene compared with primary prostate epithelial cells (Fig. 5A). The oncogene expression signature was compared to gene signatures obtained from other published databases to identify similarities to other well-studied disease phenotypes and cell lines. Gene ontology (GO) enrichment analysis for each of the cell lines identified enrichment for pathways involved in tumor progression. The top 40 GO biological process terms sorted based on their overall significance in the four oncogene cell lines are shown in Supplemental Fig. 3 and show enrichment of pathways involved in cellular proliferation, DNA replication, and reduced expression of pathways promoting adhesion and epithelial cell differentiation. Comparisons were performed against gene signatures representative of differential expression in advanced state vs. early stage prostate cancer, high grade vs. low grade prostate cancer, recurrent vs. nonrecurrent prostate cancer (4). The gene signature heatmaps representing advanced stage/early stage, high grade/low grade, and recurrent/nonrecurrent prostate cancer phenotypes (4) (Fig. 5B, C) are shown on the left and the heatmaps on the right represent genes that are differentially expressed in the prostate oncogene expression signature. The heatmaps are labeled with the percentage of genes within the “oncogene expression signature” that are differentially expressed. P values for the statistical significance of the similarity between the genes expressed in the prostate cancer cell lines and the gene signature of the disease phenotype are shown. P values are based on the hypergeometric distribution and represent the probability of these genes being differentially expressed in the disease phenotype if they were selected at random.
A “high grade” prostate cancer gene signature was previously determined from 61 primary prostate tumors (4). Figure 5B shows that 34 genes from the prostate oncogene expression signature were common to the “high grade” gene signature (p = 2.97 × 10⁻⁵). For each oncogene induced prostate cancer cell line, the proportion of significant genes contributing to that cell line is shown. For example, the overlap between the prostate oncogene expression signature and high grade disease includes a combination of genes that are significant genes in c-Myc (47%), NeuT (53%), Ha-Ras (71%), and v-Src (62%). Figure 5C depicts the 72 genes that were common between the prostate oncogene signature and the “advanced stage” gene signature (p= 4.13 × 10⁻⁸). These results indicate a significant degree of similarity between the prostate oncogene expression signature and high-grade disease (p = 2.97 × 10⁻⁵) and between the oncogene expression signature and the advanced stage disease phenotype (p= 4.13 × 10⁻⁸).
No significant overlap was identified between the prostate oncogene expression signature and the recurrent/nonrecurrent disease signature identified by Lapointe et al. (4). When the prostate oncogene expression signature was compared with the Lapointe data, the Ha-Ras cell line captured the highest level of similarity with high grade disease (71%), while the v-Src cell line showed the highest similarity with advanced stage disease (67%).
c-Myc specific gene expression signature in prostate cancer epithelial cells resembles the c-Myc signature in fibroblasts and mammary tumors
A comparison was made between gene expression pathways regulated in the c-Myc cell line with previous studies of gene expression in transgenic mice expressing the c-Myc oncogene targeted to the prostate under control of the probasin promoter (8) double transgenic mice expressing c-Myc and NKX3.1 (22) and curated gene signatures (23) (Supplemental Fig. 4A). These studies demonstrated a significant concordant correlation between c-Myc repressed and c-Myc-induced genes in the c-Myc PEC line, with the gene expression profiles of the transgenic mice and several curated gene signatures (Supplemental Fig. 4B).
In previous studies we identified gene expression signatures that were specific to the oncogene used to transform fibroblasts (3T3 cells) that were recapitulated in mammary tumors induced by c-Myc or Ha-Ras (24). The previously defined Ha-Ras-and c-Myc-induced molecular signature was compared with the gene expression signature induced by these oncogenes in the prostate cancer epithelial cells (Oncogene Superset in Fig. 5A). A comparison was conducted of the Ha-Ras prostate oncogene expression signature against Ha-Ras transduced fibroblasts (Fig. 6A). Significant overlap was identified between the prostate oncogene expression signature and genes differentially expressed upon Ras oncogene transduction in the mouse fibroblasts (33 genes, hypergeometric p = 3.7×10⁻³).
Figure 6. c-Myc- and Ha-Ras-specific oncogene signatures in prostate tumors are conserved in other tissues.
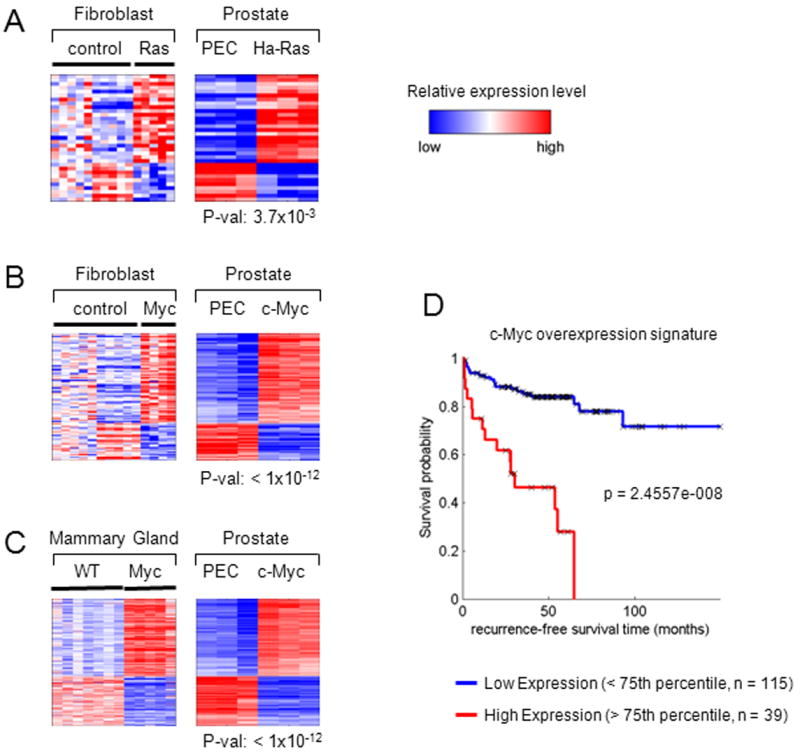
Heatmaps show genes that are differentially expressed in the oncogene-induced prostate cancer cell lines and in (A) Ha-Ras and (B) c-Myc fibroblasts (3T3 cell line). (C) A heatmap shows the intersection of genes that are differentially expressed in the c-Myc prostate cancer cell line and mouse mammary tumor samples. The p values shown under each prostate cell line heatmap represent the significance of the overlap between the prostate and fibroblast/mammary tumor signatures. (D) Kaplan Meier curves are shown for high (upper 25th percentile) and low (lower 75th percentile) expression populations for the c-Myc overexpression signature used to interrogate the clinical data of (2).
The heatmaps in Fig. 6B depicts the genes shared between c-Myc transduced fibroblasts (Fig. 6B), c-Myc-induced mammary tumors (Fig. 6C) (left-hand heatmaps) and the c-Myc induced prostate oncogene expression signature (right-hand heatmaps). A significant overlap was identified between the c-Myconcogene expression signature (Superset) and the genes differentially regulated by c-Myc transduction in mouse fibroblasts (108 genes, hypergeometric p = 5.84×10⁻¹²) or mammary tumors (363 genes; hypergeometric p = 7.5916e-012). Within the prostate oncogene expression signature, c-Myc cell lines demonstrated the largest proportion of similarity with both the Myc transduced fibroblasts (92%) (Fig. 6B) and the c-Myc-induced mammary tumors (85%) (Fig. 6C).
Kaplan Meier analysis was used to evaluate the difference in recurrence-free survival associated with high expression versus low expression of these genes. Genes that correspond to the 14 most upregulated genes of the c-Myc signature were used to assign the samples as high (upper 25th percentile) or low (lower 75th percentile). Genes that were highly expressed in the c-Myc signature had a significant association with poor outcome when used to interrogate the clinical data set of Taylor et. al. (p<0.005) (Fig. 6D). Comparison was made between the c-Myc signature and a recently described gene prognostic signature (25) by using these signatures to interrogate a clinical data set (2). The comparison of the c-Myc signature identified herein, compared favorably as a discriminator of outcome (Supplemental Fig. 5).
Prostate oncogene induced gene expression and recurrence free survival in human prostate cancer
In order to examine the relationship between genes expressed in the oncogene transformed cell lines and survival rates from human prostate cancer, a previously published microarray dataset of human prostate tumor samples with known clinical recurrence-free survival time was used (7). Figure 7A provides a heatmap showing the expression profiles of genes in the human prostate cancer samples from the Glinsky’s data set, which was upregulated in the c-Myc (Fig. 5A, Group 8) oncogene-transformed prostate cancer cell lines.
Figure 7. The c-Myc-specific expression profile distinguishes tumor from normal tissue.
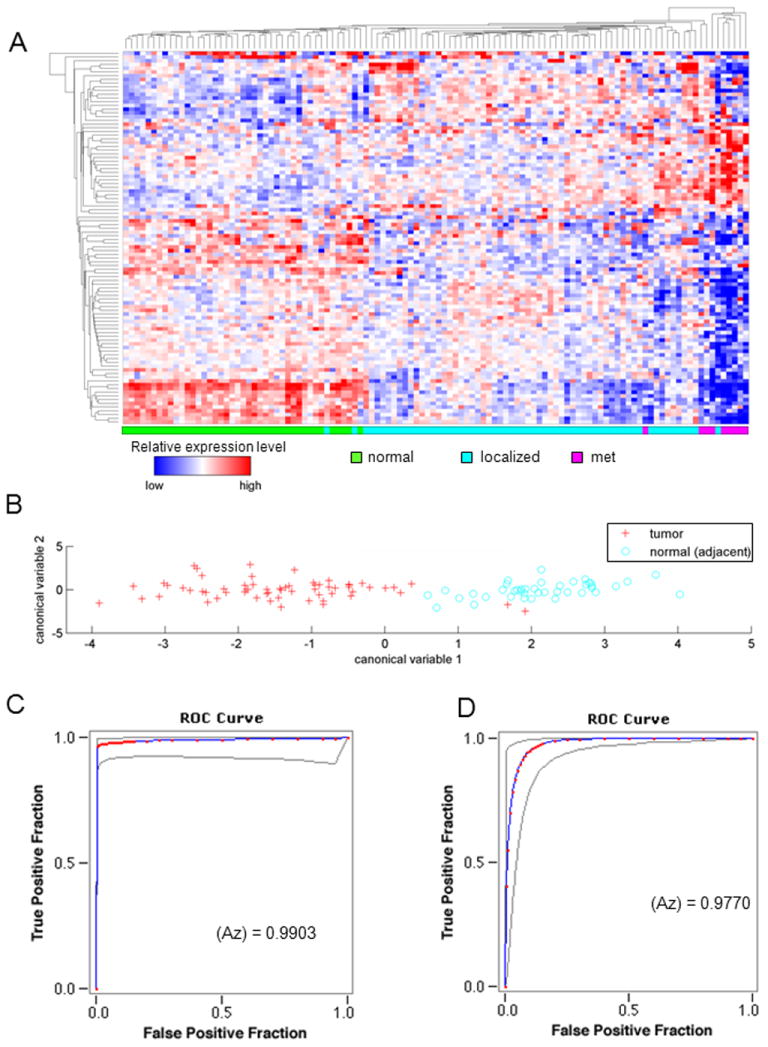
(A) Hierarchical clustering performed in the subset genes exclusively deregulated in the c-Myc cell lines separates normal (green), localized tumor (light blue), and tumor metastasis (pink) samples. (B) A classifier based on canonical analysis of c-Myc signature distinguishes human tumor (red) from normal tissue (light blue), along the x-axis, in the Lapointe 2004 dataset. ROC curves for the classifier performance are shown for (C) the Lapointe 2004 dataset and (D) the Taylor 2010 MSKCC dataset, with AUC values of 0.990 and 0.977, respectively.
Canonical analysis was performed using the c-Myc-specific genes that were also found to be differentially expressed between tumor and normal samples in two human prostate datasets. The first canonical variable, resulting from this analysis, was used to discriminate tumor from normal samples in each human prostate dataset. A plot of tumor and normal samples along the first canonical variable axis revealed a pronounced separation between tumor and normal samples (Fig. 7B). ROC curves have been used previously to evaluate the diagnostic ability of PSA (26, 27) as well as its ability to identify metastatic disease (28). A receiver operating characteristic (ROC) analysis of tumor and normal samples, separated by the first canonical variable, produced area under the curve (AUC) values of 0.977 and 0.990 for the Taylor 2010 (Fig. 7C) and Lapointe 2004 (Fig. 7D) datasets, respectively (2, 4).
DISCUSSION
The relative paucity of murine prostate cell lines that can be grown in immune-competent mice to form metastases has limited pre-clinical studies of prostate cancer therapies in vivo. The immune system plays an important role in the onset and progression of prostate cancer (12). The current studies were conducted in order to generate murine prostate cancer cell lines that could be studied in immune-competent mice. The prostate cancer cell lines generated herein resembled human prostate cancer histologically, and grew in immune-competent mice in a reproducible manner and formed lung metastasis. The gene expression changes and genomic rearrangements resembled human prostate cancer. By more faithfully recapitulating the tumor host environment, these lines provide a valuable advance for preclinical testing new therapies in vivo.
These studies identified patterns of gene expression within newly engineered prostate cancer cell lines that are observed in human prostate cancer and are associated with poor outcome (Supplemental Fig. 5C). The algorithm distinguished recurrence free survival (prognostic signature) and with superior characteristics to several published signatures (23, 25) and Gleason scale. Prior studies have shown a paucity of genes with concordant expression in established prostate cancer cell lines and human prostate cancer (29). Herein, the generation of oncogene-specific transformed prostate cancer cell lines allowed a comparison with the molecular signatures of human prostate cancer. Comparison was made between whole tumor mRNA in our studies and whole tumor mRNA in the clinical studies (not laser capture micro-dissected samples). The prostate oncogene expression signature correlated with a previously defined high grade prostate cancer and with advanced staged in a second patient population. The c-Myc signature correlated with the signature induced by c-Myc when targeted to the prostate gland in transgenic mice (Supplemental Fig. 4A, B) and gene enrichment analysis identified significant overlap with several recent published data sets and transgenic models of prostate cancer (8, 23). The c-Myc signature was used to derive algorithms that distinguished normal from cancerous prostate tissue with ~99% predictive value (diagnostic signature).
Herein, transduction of primary prostate epithelial cells of FVB mice by a single oncogene was sufficient for transformation. Oncogene genomic analysis identified loss of tumor suppressor regions and amplification of additional oncogenic regions that resemble genomic changes in human prostate cancer (Fig. 2). The cell lines reflect both AR-response and AR-unresponse prostate cancers (Supplemental Fig. 6) although each line expresses plasma Kallikrein 1B (PK1B) (Supplemental Fig. 2B). Kallikrein gene expression is regulated by basal and androgen-independent factors, thus PK1B in the tumors may not necessarily be correlated directly with AR expression (Fig. 1D). The tumors all expressed CK8 while the c-Myc and v-Src lines expressed CK5, by Western blot (Fig. 1D) and by immunofluorescence in the primary cell lines (Supplemental Fig. 7A) and in the lung metastasis (Supplemental Fig. 7B). CK5 is considered a marker of basal cell type origin of prostate cancer and is more common in metastatic prostate cancer and after androgen deprivation (30). In previous studies, prostate epithelial cells have been transformed with DNA tumor viruses and murine prostate cancer cell lines have been derived from oncomice (31). hTERT together with SV40T/t immortalizes human PEC and together with either Ha-Ras or c-Myc results in cells that grow in tissue culture. However, unlike the lines developed herein, these PEC lines were unable to grow tumors after subcutaneous implantation or form metastasis in vivo (32).
The transition of normal somatic epithelial cells into an immortalized metastatic cell requires dysregulation of distinct cellular processes including cell survival motility, cell proliferation, altered metabolism and angiogenesis. The transformation of human and murine cells has distinct requirements (33, 34). Human fibroblasts can be transformed by two oncogenes (35). Primary human cells can be immortalized by the introduction of the catalytic subunit of human telomerase reverse transcriptase (hTERT) and SV40 large-T to inactivate the pRb and p53 pathways (36). Immortal human cells are converted into transformed cells with tumorigenic growth by the further induction of an oncogenic Ha-Ras allele and the SV40 early region oncoprotein small t antigen (37, 38, 35). The requirements for transformation are cell type specific (34). Human mammary epithelial cells immortalized by SV40 and hTERT undergo tumorigenic conversion with oncogenic Ras (36) or by the use of a mutant p53, a CDK4 mutant and cyclin D1 overexpression (39). SV40 LT contributes to transformation though inactivation of p53 and pRb, as attested by siRNA analysis. Cautionary caveats to the use of these cell lines include the potential importance of the local prostate microenvironment in progression of prostate cancer, the capacity of the FVB murine strain background to enhance tumor progression (40) and the tendency of human prostate cancer metastasis to target bone rather than lung (41). The mechanisms governing the spontaneous regression of the NeuT lines remains speculative at this time.
The current studies defined oncogene-specific signatures and then mapped these signatures to human prostate cancer. The oncogenes were chosen because of evidence that these oncogenes and/or tumor pathways are activated in human prostate cancer. The c-Myc signature was conserved in prostate, breast and fibroblasts. The c-Myc gene copy number is increased in up to 30% of cases at the preneoplastic stage in patients with Prostatic Intraepithelial Neoplasia (PIN) (42, 43). The v-Src, ErbB2, Ha-Ras oncogenes have also been implicated in human prostate cancer and a truncated version of c-kit identified in primary prostate tumors correlates with activation of the Src pathway (44). Although the role of ErbB2 in human prostate cancer is controversial, a subset of prostate cancer patients express ErbB2 and its pathway, and activated ErbB2 is sufficient to induce prostate cancer in transgenic mice (45, 46). In vivo, the activating Ras mutation (Ha-Ras V12) induced low-grade PIN in mice when directed to prostate epithelial cells under the control of the minimal probasin promoter (47).
The current studies identified oncogene-specific signatures in murine prostate epithelium that were recapitulated within human prostate cancer samples. Oncogene specific signatures have been proposed to exist within human prostate cancer (10). In human breast cancer, the identification of tumor subsets with patterns of transcriptional and biological activity has allowed a deeper understanding of the disease. It has been anticipated that the identification of these patterns of gene function in otherwise heterogeneous biological material may enable the identification of targets for therapies and to thereby improve management of prostate cancer. The development herein of oncogene specific prostate cancer cell lines may be of value in developing targeted therapies for prostate cancer.
Supplementary Material
Acknowledgments
This work was supported in part by R01CA70896, R01CA75503, R01CA107382, R01CA86072 (R.G.P.) and R01CA120876 (M.P.L). The Kimmel Cancer Center was supported by the NIH Cancer Center Core grant P30CA56036 (R.G.P.). This project is funded in part from the Dr. Ralph and Marian C. Falk Medical Research Trust and a grant from Pennsylvania Department of Health (R.G.P.). The Department specifically disclaims responsibility for any analysis, interpretations, or conclusions. We thank David Strahan for the preparation of this manuscript.
Footnotes
Conflicts of Interest: R.G.P. holds minor (< $10,000) ownership interests in, and serves as CSO/Founder of the biopharmaceutical companies ProstaGene, LLC and AAA Phoenix, Inc. R.G.P. additionally holds ownership interests (value unknown) for several submitted patent applications.
References
- 1.Scher HI, Sawyers CL. Biology of progressive, castration-resistant prostate cancer: directed therapies targeting the androgen-receptor signaling axis. Journal of clinical oncology : official journal of the American Society of Clinical Oncology. 2005:8253–8261. doi: 10.1200/JCO.2005.03.4777. [DOI] [PubMed] [Google Scholar]
- 2.Taylor BS, Schultz N, Hieronymus H, Gopalan A, Xiao Y, Carver BS, et al. Integrative genomic profiling of human prostate cancer. Cancer Cell. 2010:11–22. doi: 10.1016/j.ccr.2010.05.026. [DOI] [PMC free article] [PubMed] [Google Scholar]
- 3.Singh D, Febbo PG, Ross K, Jackson DG, Manola J, Ladd C, et al. Gene expression correlates of clinical prostate cancer behavior. Cancer Cell. 2002:203–209. doi: 10.1016/s1535-6108(02)00030-2. [DOI] [PubMed] [Google Scholar]
- 4.Lapointe J, Li C, Higgins JP, van de Rijn M, Bair E, Montgomery K, et al. Gene expression profiling identifies clinically relevant subtypes of prostate cancer. Proc Natl Acad Sci U S A. 2004:811–816. doi: 10.1073/pnas.0304146101. [DOI] [PMC free article] [PubMed] [Google Scholar]
- 5.Dhanasekaran SM, Barrette TR, Ghosh D, Shah R, Varambally S, Kurachi K, et al. Delineation of prognostic biomarkers in prostate cancer. Nature. 2001:822–826. doi: 10.1038/35090585. [DOI] [PubMed] [Google Scholar]
- 6.LaTulippe E, Satagopan J, Smith A, Scher H, Scardino P, Reuter V, et al. Comprehensive gene expression analysis of prostate cancer reveals distinct transcriptional programs associated with metastatic disease. Cancer Res. 2002:4499–4506. [PubMed] [Google Scholar]
- 7.Glinsky GV, Glinskii AB, Stephenson AJ, Hoffman RM, Gerald WL. Gene expression profiling predicts clinical outcome of prostate cancer. J Clin Invest. 2004:913–923. doi: 10.1172/JCI20032. [DOI] [PMC free article] [PubMed] [Google Scholar]
- 8.Ellwood-Yen K, Graeber TG, Wongvipat J, Iruela-Arispe ML, Zhang J, Matusik R, et al. Myc-driven murine prostate cancer shares molecular features with human prostate tumors. Cancer Cell. 2003:223–238. doi: 10.1016/s1535-6108(03)00197-1. [DOI] [PubMed] [Google Scholar]
- 9.Weber MJ, Gioeli D. Ras signaling in prostate cancer progression. J Cell Biochem. 2004:13–25. doi: 10.1002/jcb.10683. [DOI] [PubMed] [Google Scholar]
- 10.Creighton CJ. Multiple oncogenic pathway signatures show coordinate expression patterns in human prostate tumors. PLoS One. 2008:e1816. doi: 10.1371/journal.pone.0001816. [DOI] [PMC free article] [PubMed] [Google Scholar]
- 11.Paronetto MP, Farini D, Sammarco I, Maturo G, Vespasiani G, Geremia R, et al. Expression of a truncated form of the c-Kit tyrosine kinase receptor and activation of Src kinase in human prostatic cancer. Am J Pathol. 2004:1243–1251. doi: 10.1016/S0002-9440(10)63212-9. [DOI] [PMC free article] [PubMed] [Google Scholar]
- 12.De Marzo AM, Platz EA, Sutcliffe S, Xu J, Gronberg H, Drake CG, et al. Inflammation in prostate carcinogenesis. Nature reviews. Cancer. 2007:256–269. doi: 10.1038/nrc2090. [DOI] [PMC free article] [PubMed] [Google Scholar]
- 13.Di Lorenzo G, Buonerba C, Kantoff PW. Immunotherapy for the treatment of prostate cancer. Nature reviews. Clinical oncology. 2011 doi: 10.1038/nrclinonc.2011.72. [DOI] [PubMed] [Google Scholar]
- 14.Bull JH, Ellison G, Patel A, Muir G, Walker M, Underwood M, et al. Identification of potential diagnostic markers of prostate cancer and prostatic intraepithelial neoplasia using cDNA microarray. Br J Cancer. 2001:1512–1519. doi: 10.1054/bjoc.2001.1816. [DOI] [PMC free article] [PubMed] [Google Scholar]
- 15.Thompson TC, Southgate J, Kitchener G, Land H. Multistage carcinogenesis induced by ras and myc oncogenes in a reconstituted organ. Cell. 1989:917–930. doi: 10.1016/0092-8674(89)90625-9. [DOI] [PubMed] [Google Scholar]
- 16.Hensley PJ, Kyprianou N. Modeling Prostate Cancer in Mice: Limitations and Opportunities. Journal of andrology. 2011 doi: 10.2164/jandrol.111.013987. [DOI] [PMC free article] [PubMed] [Google Scholar]
- 17.Ilio KY, Nemeth JA, Lang S, Lee C. The primary culture of rat prostate basal cells. J Androl. 1998:718–724. [PubMed] [Google Scholar]
- 18.Li Z, Wang C, Jiao X, Lu Y, Fu M, Quong AA, et al. Cyclin D1 regulates cellular migration through the inhibition of thrombospondin 1 and ROCK signaling. Mol Cell Biol. 2006:4240–4256. doi: 10.1128/MCB.02124-05. [DOI] [PMC free article] [PubMed] [Google Scholar]
- 19.Liu M, Casimiro MC, Wang C, Shirley LA, Jiao X, Katiyar S, et al. p21CIP1 attenuates Ras- and c-Myc-dependent breast tumor epithelial mesenchymal transition and cancer stem cell-like gene expression in vivo. Proc Natl Acad Sci U S A. 2009:19035–19039. doi: 10.1073/pnas.0910009106. [DOI] [PMC free article] [PubMed] [Google Scholar]
- 20.Holcomb IN, Young JM, Coleman IM, Salari K, Grove DI, Hsu L, et al. Comparative analyses of chromosome alterations in soft-tissue metastases within and across patients with castration-resistant prostate cancer. Cancer Res. 2009:7793–7802. doi: 10.1158/0008-5472.CAN-08-3810. [DOI] [PMC free article] [PubMed] [Google Scholar]
- 21.Robbins CM, Tembe WA, Baker A, Sinari S, Moses TY, Beckstrom-Sternberg S, et al. Copy number and targeted mutational analysis reveals novel somatic events in metastatic prostate tumors. Genome Res. 2011:47–55. doi: 10.1101/gr.107961.110. [DOI] [PMC free article] [PubMed] [Google Scholar]
- 22.Anderson PD, McKissic SA, Logan M, Roh M, Franco OE, Wang J, et al. Nkx3.1 and Myc crossregulate shared target genes in mouse and human prostate tumorigenesis. J Clin Invest. 2012:1907–1919. doi: 10.1172/JCI58540. [DOI] [PMC free article] [PubMed] [Google Scholar]
- 23.Markert EK, Mizuno H, Vazquez A, Levine AJ. Molecular classification of prostate cancer using curated expression signatures. Proc Natl Acad Sci U S A. 2011:21276–21281. doi: 10.1073/pnas.1117029108. [DOI] [PMC free article] [PubMed] [Google Scholar]
- 24.Huang ES, Black EP, Dressman H, West M, Nevins JR. Gene expression phenotypes of oncogenic signaling pathways. Cell Cycle. 2003:415–417. [PubMed] [Google Scholar]
- 25.Ding Z, Wu CJ, Chu GC, Xiao Y, Ho D, Zhang J, et al. SMAD4-dependent barrier constrains prostate cancer growth and metastatic progression. Nature. 2011:269–273. doi: 10.1038/nature09677. [DOI] [PMC free article] [PubMed] [Google Scholar]
- 26.Catalona WJ, Hudson MA, Scardino PT, Richie JP, Ahmann FR, Flanigan RC, et al. Selection of optimal prostate specific antigen cutoffs for early detection of prostate cancer: receiver operating characteristic curves. J Urol. 1994:2037–2042. doi: 10.1016/s0022-5347(17)32300-5. [DOI] [PubMed] [Google Scholar]
- 27.Thompson IM, Chi C, Ankerst DP, Goodman PJ, Tangen CM, Lippman SM, et al. Effect of finasteride on the sensitivity of PSA for detecting prostate cancer. J Natl Cancer Inst. 2006:1128–1133. doi: 10.1093/jnci/djj307. [DOI] [PubMed] [Google Scholar]
- 28.Akimoto S, Furuya Y, Akakura K, Shimazaki J, Ito H. Relationship between prostate-specific antigen, clinical stage, and degree of bone metastasis in patients with prostate cancer: comparison with prostatic acid phosphatase and alkaline phosphatase. Int J Urol. 1997:572–575. doi: 10.1111/j.1442-2042.1997.tb00311.x. [DOI] [PubMed] [Google Scholar]
- 29.Welsh JB, Sapinoso LM, Su AI, Kern SG, Wang-Rodriguez J, Moskaluk CA, et al. Analysis of gene expression identifies candidate markers and pharmacological targets in prostate cancer. Cancer Res. 2001:5974–5978. [PubMed] [Google Scholar]
- 30.Schalken JA, van Leenders G. Cellular and molecular biology of the prostate: stem cell biology. Urology. 2003:11–20. doi: 10.1016/s0090-4295(03)00758-1. [DOI] [PubMed] [Google Scholar]
- 31.Roy-Burman P, Wu H, Powell WC, Hagenkord J, Cohen MB. Genetically defined mouse models that mimic natural aspects of human prostate cancer development. Endocrine-related cancer. 2004:225–254. doi: 10.1677/erc.0.0110225. [DOI] [PubMed] [Google Scholar]
- 32.Berger R, Febbo PG, Majumder PK, Zhao JJ, Mukherjee S, Signoretti S, et al. Androgen-induced differentiation and tumorigenicity of human prostate epithelial cells. Cancer Res. 2004:8867–8875. doi: 10.1158/0008-5472.CAN-04-2938. [DOI] [PubMed] [Google Scholar]
- 33.Hahn WC, Weinberg RA. Rules for making human tumor cells. N Engl J Med. 2002:1593–1603. doi: 10.1056/NEJMra021902. [DOI] [PubMed] [Google Scholar]
- 34.Rangarajan A, Hong SJ, Gifford A, Weinberg RA. Species- and cell type-specific requirements for cellular transformation. Cancer cell. 2004:171–183. doi: 10.1016/j.ccr.2004.07.009. [DOI] [PubMed] [Google Scholar]
- 35.Ruley HE. Adenovirus early region 1A enables viral and cellular transforming genes to transform primary cells in culture. Nature. 1983:602–606. doi: 10.1038/304602a0. [DOI] [PubMed] [Google Scholar]
- 36.Elenbaas B, Spirio L, Koerner F, Fleming MD, Zimonjic DB, Donaher JL, et al. Human breast cancer cells generated by oncogenic transformation of primary mammary epithelial cells. Genes Dev. 2001:50–65. doi: 10.1101/gad.828901. [DOI] [PMC free article] [PubMed] [Google Scholar]
- 37.Hahn WC, Counter CM, Lundberg AS, Beijersbergen RL, Brooks MW, Weinberg RA. Creation of human tumour cells with defined genetic elements. Nature. 1999:464–468. doi: 10.1038/22780. [DOI] [PubMed] [Google Scholar]
- 38.Land H, Parada LF, Weinberg RA. Tumorigenic conversion of primary embryo fibroblasts requires at least two cooperating oncogenes. Nature. 1983:596–602. doi: 10.1038/304596a0. [DOI] [PubMed] [Google Scholar]
- 39.Hahn WC, Dessain SK, Brooks MW, King JE, Elenbaas B, Sabatini DM, et al. Enumeration of the simian virus 40 early region elements necessary for human cell transformation. Mol Cell Biol. 2002:2111–2123. doi: 10.1128/MCB.22.7.2111-2123.2002. [DOI] [PMC free article] [PubMed] [Google Scholar]
- 40.Bianchi-Frias D, Pritchard C, Mecham BH, Coleman IM, Nelson PS. Genetic background influences murine prostate gene expression: implications for cancer phenotypes. Genome Biol. 2007:R117. doi: 10.1186/gb-2007-8-6-r117. [DOI] [PMC free article] [PubMed] [Google Scholar]
- 41.Fabozzi SJ, Schellhammer PF, el-Mahdi AM. Pulmonary metastases from prostate cancer. Cancer. 1995:2706–2709. doi: 10.1002/1097-0142(19950601)75:11<2706::aid-cncr2820751111>3.0.co;2-y. [DOI] [PubMed] [Google Scholar]
- 42.Jenkins RB, Qian J, Lieber MM, Bostwick DG. Detection of c-Myc oncogene amplification and chromosomal anomloies in metastatic prostatic carcinoma by fluorescence in situ hybridization. Cancer Res. 1997:524–531. [PubMed] [Google Scholar]
- 43.Sato K, Qian J, Slezak JM, Lieber MM, Bostwick DG, Bergstralh EJ, et al. Clinical significance of alterations of chromosome 8 in high-grade, advanced, nonmetastatic prostate carcinoma. J Natl Cancer Inst. 1999:1574–1580. doi: 10.1093/jnci/91.18.1574. [DOI] [PubMed] [Google Scholar]
- 44.Mori S, Chang JT, Andrechek ER, Potti A, Nevins JR. Utilization of genomic signatures to identify phenotype-specific drugs. PLoS One. 2009:e6772. doi: 10.1371/journal.pone.0006772. [DOI] [PMC free article] [PubMed] [Google Scholar]
- 45.Casimiro M, Rodriguez O, Pootrakul L, Aventian M, Lushina N, Cromelin C, et al. ErbB-2 induces the cyclin D1 gene in prostate epithelial cells in vitro and in vivo. Cancer Res. 2007:4364–4372. doi: 10.1158/0008-5472.CAN-06-1898. [DOI] [PubMed] [Google Scholar]
- 46.Gioeli D, Kraus S, Weber MJ. Signal Transduction by the Ras-MAP Kinase Pathway in Prostate Cancer Progression. In: Pestell RG, Nevalainen MT, editors. Prostate cancer : signaling networks, genetics, and new treatment strategies. Totowa, NJ: Humana Press; 2008. pp. 223–256. [Google Scholar]
- 47.Scherl A, Li JF, Cardiff RD, Schreiber-Agus N. Prostatic intraepithelial neoplasia and intestinal metaplasia in prostates of probasin-RAS transgenic mice. Prostate. 2004:448–459. doi: 10.1002/pros.20020. [DOI] [PubMed] [Google Scholar]
Associated Data
This section collects any data citations, data availability statements, or supplementary materials included in this article.