

Abstract
Hutchinson-Gilford progeria syndrome (HGPS) is a premature aging disease that is frequently caused by a de novo point mutation at position 1824 in LMNA. This mutation activates a cryptic splice donor site in exon 11, and leads to an in-frame deletion within the prelamin A mRNA and the production of a dominant-negative lamin A protein, known as progerin. Here we show that primary HGPS skin fibroblasts experience genome-wide correlated alterations in patterns of H3K27me3 deposition, DNA-lamin A/C associations, and, at late passages, genome-wide loss of spatial compartmentalization of active and inactive chromatin domains. We further demonstrate that the H3K27me3 changes associate with gene expression alterations in HGPS cells. Our results support a model that the accumulation of progerin in the nuclear lamina leads to altered H3K27me3 marks in heterochromatin, possibly through the down-regulation of EZH2, and disrupts heterochromatin–lamina interactions. These changes may result in transcriptional misregulation and eventually trigger the global loss of spatial chromatin compartmentalization in late passage HGPS fibroblasts.
Hutchinson-Gilford progeria syndrome (HGPS) is a rare premature aging disease that affects one in 4 million live births every year (Capell and Collins 2006; Merideth et al. 2008; Capell et al. 2009). HGPS is usually diagnosed in the first year or two of life and is characterized by a rapid progression of aging phenotypes, including hair loss, growth retardation, extreme lipodystrophy, skin wrinkling, osteoporosis, and arteriosclerosis (Capell and Collins 2006; Merideth et al. 2008). Patients with HGPS usually die from heart attack or stroke at the average age of 13 (Capell and Collins 2006; Capell et al. 2007; Merideth et al. 2008; Gordon et al. 2012a,b). The most common form of HGPS is caused by a de novo, heterozygous point mutation (1824, C≥T) in the human LMNA gene. This mutation activates a cryptic splice site in exon 11, resulting in the production of progerin, a mutant lamin A with an internal deletion of 50 amino acids near its C terminus (Eriksson et al. 2003). Progerin is also detectable, at a low level, in cells and tissues from normal humans (Scaffidi and Misteli 2006; Cao et al. 2007, 2011b; McClintock et al. 2007; Gruenbaum 2009; Olive et al. 2010; H Zhang et al. 2012). A recent study has shown that in normal human fibroblasts, telomere damage during replicative senescence induces progerin production (Cao et al. 2011a).
Lamin A is a major component of the nuclear lamina, a dynamic protein scaffold located underneath the inner nuclear membrane (Goldman et al. 2004; Gruenbaum et al. 2005). The lamina provides mechanical support to the nuclear shape (Gruenbaum et al. 2005; Dechat et al. 2009). It has been proposed that such a scaffold could connect and coordinate a wide range of nuclear activities, such as transcription and DNA replication (Shumaker et al. 2006; Dechat et al. 2008, 2009). Indeed, lamin A has been shown to interact with a variety of nuclear factors, including double-stranded DNA, transcriptional regulators, nuclear membrane associated proteins, and nuclear pore complexes, and the presence of progerin in lamina leads to altered gene expression, genome instability, and other nuclear defects (Capell and Collins 2006; Dechat et al. 2008).
In cultured primary HGPS fibroblasts, progerin accumulates as a function of cellular age (Goldman et al. 2004). The increase in progerin amount correlates with the progressive changes in nuclear shape (defined as nuclear blebbing) and in nuclear architecture, most notably a gradual loss of peripheral heterochromatin (Goldman et al. 2004; Driscoll et al. 2012). Moreover, cell biological analysis has demonstrated that progerin induces progressive alterations in repressive histone marks, especially in the facultative heterochromatin mark trimethylation of histone H3 lysine 27 (H3K27me3) (Shumaker et al. 2006). Importantly, it appears that those changes in H3K27me3 happen before the appearance of nuclear blebbing, suggesting that they are the early events in HGPS phenotype progression that likely represent molecular mechanisms responsible for the rapid manifestation of HGPS disease (Shumaker et al. 2006).
To investigate further the roles of H3K27me3 epigenetic regulation in HGPS disease manifestation, we mapped the locations of H3K27me3 and lamin A/C association in HGPS and normal skin fibroblast cells using chromatin immunoprecipitation followed by sequencing (ChIP-seq). We found that disease-associated changes in H3K27me3 and lamin A/C were correlated with each other and with gene density. Local changes in H3K27me3 at specific gene promoters were significantly associated with changes in gene expression. By use of genome-wide chromosome conformation capture (Hi-C), we then characterized the changes in spatial genome organization between control cells and early and late passage HGPS cells. We observed global loss of spatial chromatin compartmentalization in late passage HGPS cells and found that the changes in compartmentalization were correlated with the observed genomic locations of changes in H3K27me3 and lamin A/C association at an earlier passage. Our data support a model in which the accumulation of progerin in the lamina causes global alterations in the repressive histone mark H3K27me3 and disrupts the associations between heterochromatin and nuclear lamina in HGPS skin fibroblasts. Those changes may then result in loss of compartmentalization of chromosomes.
Results
Patches of decreased H3K27me3 in HGPS occur in gene-poor regions
To analyze the changes of H3K27me3 in HGPS fibroblasts, we mapped the location of H3K27me3 in the human genome in HGPS and control cells, using ChIP-seq (Supplemental Fig. S1; Johnson et al. 2007; Mardis 2007; Robertson et al. 2007). Three primary fibroblast cell lines were used in this study: an HGPS patient fibroblast (HGPS), a normal cell line from the father of the HGPS patient (Father), and an age-matched normal fibroblast line (Age Control). Two biological replicates were performed at different passages, since some changes in HGPS may progress with cell age (Rep1: HGPS-p14 vs. Father-p14; Rep2: HGPS-p17 vs. Father-p19) (for details, see Supplemental Table S1). The concordance between the biological replicates is high (Supplemental Fig. S2). Similar amounts of H3K27me3 were detected in the Input chromatin samples of ChIP experiments for the HGPS and Father control (Supplemental Fig. S3). After filtering and normalizing the sequencing data, we calculated the Log (IP/Input) signal for both HGPS and normal cells. The H3K27me3 data for each cell line across the genome and the comparison between cell lines can be found at http://research.nhgri.nih.gov/manuscripts/Collins/HGPSepigenetics/.
In both Father and Age Control cell lines, we observed broad patches of H3K27me3, as well as more localized signal at CpG island (CGI) promoters, as documented in previous literature (examples from chr14 are shown in Fig. 1A,B; Bracken et al. 2006; Pauler et al. 2009; Soshnikova and Duboule 2009; Deaton and Bird 2011). Genome wide analysis showed that gene-poor, non-CGI regions were more likely to show H3K27me3 enrichment than were gene-rich, CGI-dense regions in control cells (Supplemental Fig S4A,C). However, among regions with H3K27me3 enrichment, CGIs showed higher H3K27me3 signal than non-CGI regions (Supplemental Fig S4B), reflecting H3K27me3 enrichment at specific promoters. The H3K27me3 data in primary skin fibroblasts correlate weakly to moderately, but significantly, with previously published H3K27me3 data sets in lung fibroblast IMR90 cells (Supplemental Fig. S4D; Hawkins et al. 2010). The lack of full correlation potentially reflects the very different sources of these fibroblasts, as well as differences in experimental details such as the H3K27me3 antibody used.
Figure 1.

The correlation between gene density and changes of H3K27me3 signals in HGPS. Three primary fibroblast cell lines used in all experiments were HGADFN167 (HGPS), HGFDFN168 (Father, normal), and AG08470 (Age Control, normal). (A) H3K27me3 signals for Age Control, Father, HGPS, and the difference between Father and HGPS (HGPS-Father) are shown at 25-kb resolution across a region of chromosome 14. Patches of H3K27me3 enrichment are observed in gene-poor regions in control samples (red boxes), and these regions show decreased H3K27me3 in HGPS. RefSeq genes are shown below to indicate gene density, and the locations of CpG islands are noted. (B) A 4-Mb region of chr14 shows enrichment of H3K27me3 in the normal Father fibroblasts at CpG island promoter regions. (C) Distributions of H3K27me3 changes between Father and HGPS [Log(Father/HGPS)] are plotted as a “violin plot” for regions of high gene density (≥20 genes per Mb) and low gene density (≤5 genes per Mb). In all violin plots, the white dot represents the median of the plotted data, the black box indicates the 25% and 75% quartiles, and the gray shape represents the distribution of the plotted signal. Genome wide, H3K27me3 tends to increase in gene-dense regions and decrease in gene-poor regions. This result is significant by a KS test and a circular permutation test of the data (1000 permutations). (D) The genome is divided into bins of differing gene density, with the lower bound of gene density (genes/Mb) indicated below each bar. The fraction of each bin that is covered by 25-kb regions that have at least a 1.5-fold decrease in H3K27me3 in HGPS vs. Father is plotted on the y-axis. The fraction of H3K27me3 depleted regions decreases monotonically as the gene density increases.
To determine changes in H3K27me3, we calculated the difference in the Log (IP/Input) ratios between HGPS and normal cells at 25-kb resolution. To find “high-confidence” changes in H3K27me3 for downstream analyses, we required that a genomic region have an IP signal greater than the background Input sequencing signal in either the HGPS or normal data set. Examining the changes in H3K27me3 in HGPS versus normal cells revealed that the large patches of this histone modification in gene-poor regions of normal cells were often decreased or lost in HGPS (Fig. 1A, red boxes). We found that this trend was significant genome wide—globally, gene-poor, non-CGI regions were enriched for losses of H3K27me3 in HGPS compared with normal cells (Fig. 1C,D; Supplemental Figs. S5, S6).
Such losses of H3K27me3 in HGPS may be associated with the previously reported down-regulation of EZH2, the methyltransferase that is primarily responsible for H3K27 methylation, in HGPS cells (Shumaker et al. 2006; Margueron et al. 2009). Indeed, when we measured the mRNA level of EZH2 using quantitative RT-PCR in HGPS and normal fibroblasts, we found that the mRNA level of EZH2 is significantly reduced in the four HGPS fibroblast cell lines tested, compared with three passage-matched normal control samples (Supplemental Fig. S7). Together, these results suggest that gene-poor regions of HGPS fibroblasts experience a reduction of H3K27me3 compared with the control, possibly influenced by the down-regulation of EZH2 in HGPS.
Localized changes in H3K27me3 correlate with gene expression
In addition to these broad changes in H3K27me3 that correlate with gene density genome wide, we observed changes (both increases and decreases) in H3K27me3 at specific CGI promoters in HGPS fibroblasts (Fig. 1B). As the H3K27me3 mark at such promoters is often associated with repression of gene expression (Bracken et al. 2006; Deaton and Bird 2011), we measured the gene expression changes between the Father, Age Control, and HGPS fibroblasts using an Affymetrix gene expression array. We found a good correlation between gene expression changes in HGPS when comparing either to Father or Age Control cells (Fig. 2A). We focused on the sets of genes that changed expression at least fourfold in both comparisons (Fig. 2A, red and green boxes). Genome wide, we found that down-regulated genes were more likely to have increased H3K27me3 and up-regulated genes were more likely to have decreased H3K27me3 levels (Fig. 2B), consistent with the previously reported effects of H3K27me3 on gene expression (Deaton and Bird 2011). Many of the regions where H3K27me3 changes correlated with gene expression changes occurred at CGI promoters (Fig. 2C). We selected a subset of three genes and confirmed their expression changes using quantitative RT-PCR (Fig. 2D). Genes with correlated expression and H3K27me3 changes between both Father and Age Control fibroblasts and HGPS fibroblasts are listed in Supplemental Table S2.
Figure 2.
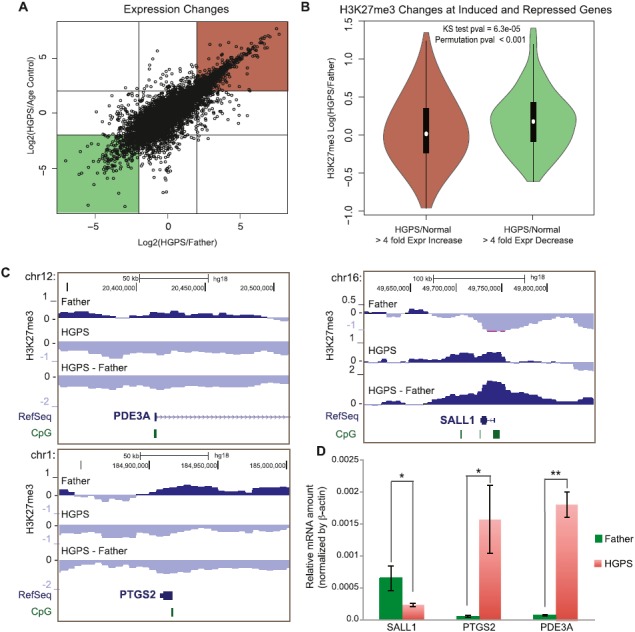
Changes in H3K27me3 associated with changes in gene expression in HGPS. (A) Scatterplot of Log2 ratio expression changes between HGPS and Age Control (y-axis) and HGPS and Father (x-axis). Red and green boxes indicate genes considered “up-regulated” and “down-regulated” (more than fourfold), respectively, for subsequent analyses. (B) H3K27me3 changes between Father and HGPS in the 25-kb bin overlapping each gene are plotted on the y-axis for genes that are up-regulated (left) or down-regulated (right). H3K27me3 tends to decrease in HGPS for up-regulated genes and increase for down-regulated genes. (C) Examples of H3K27me3 changes for genes that are up-regulated (left, PDE3A and PTGS2) and that are down-regulated (right, SALL1) according to the expression microarray data in normal vs. HGPS fibroblasts. (D) Quantitative RT-PCR results confirm expression microarray results for these three example genes (*) P < 0.05; (**) P < 0.01 in unpaired, one-tailed Student's t-tests.
Dissociation of heterochromatin regions from lamin A/C in HGPS cells
We next examined the lamin A/C–chromatin interactions using ChIP in the same HGPS and Father fibroblasts as in the H3K27me3 experiment (at passage 16) (Supplemental Table S1). Two different anti-lamin A/C antibodies, MAB3211 and N18, were used for two biological replicates. The correlation between replicates was high (R = 0.95). After filtering and normalizing the data, we took the log ratio between the lamin A/C IP and Input signal at 100-kb resolution, reflecting the broad domains of lamin association previously reported (Fig. 3A; Guelen et al. 2008). We found that the locations of lamin A/C association in normal skin fibroblasts was significantly associated with previously determined lamin-associated domains (LADs) in human lung Tig3 fibroblasts (Fig. 3B; Guelen et al. 2008). The changes in lamin A/C binding between normal and HGPS samples were calculated in a similar manner to the H3K27me3 changes (a section of chromosome 1 is shown in Fig. 3A; data for the whole genome are available at http://research.nhgri.nih.gov/manuscripts/Collins/HGPSepigenetics/). As with the H3K27me3 comparisons, we only considered changes to be “reliable” in regions in which either normal or HGPS cells showed a higher IP than Input signal. Though HGPS lamin-associated regions still showed a correlation with normal fibroblast LADs (Supplemental Fig. S8), we found that lamin associations were often reduced in the same gene-poor genomic regions that showed decreased H3K27me3 levels in HGPS cells (Fig. 3A). Genome wide, we found a weak but significant correlation between the changes in lamin A/C interaction and changes in H3K27me3 (Supplemental Fig. S9).
Figure 3.

Dissociation of lamin A/C from heterochromatin regions in HGPS fibroblasts. (A) Regions of lamin A/C binding are shown as log (IP/Input) at 100-kb resolution for Father and HGPS fibroblasts along the left arm of chromosome 1. The previously classified LADs are shown above Father data (Tig3 LADs). Changes in lamin A/C binding and H3K27me3 association between Father and HGPS are shown below. (B) The distributions of lamin association signal in Father fibroblasts are shown for regions that were previously classified as LADs or non-LADs in Tig3 human lung fibroblasts. Lamin A/C ChIP-seq log ratios are significantly higher in LADs than in non-LADs as evaluated by a KS test and a circular permutation of the data (1000 permutations). (C) Western blotting analysis with anti-lamin A/C and anti-histone H3 antibodies in the immunoprecipitates with indicated antibodies. One percent of the Input and 10% of the immunoprecipitated proteins were run in each indicated lane. Three independent experiments were performed. One representative set is shown. (D) Quantification of the ratio of lamin A/C /Histone H3 of three independent replicates. There is a significant enrichment of lamin A/C in H3K27me3 ChIP compared with H3K4me3 ChIPs. P = 0.023.
We hypothesized that the loss of lamin A/C binding and loss of H3K27me3 were mechanistically linked, possibly through physical association of chromatin enriched in H3K27me3 with the nuclear lamina. To test this idea, we performed immunoprecipitation (IP) experiments with an anti-H3K27me3 antibody in normal cells. As controls, we performed parallel IPs with IgG control and an antibody against the trimethylated histone H3 lysine 4 (H3K4me3), a mark enriched at actively transcribed genes (Pinskaya and Morillon 2009). The precipitates were probed with anti-lamin A/C and anti-histone H3 antibodies for Western blotting analysis. While similar amounts of histone H3 were immunoprecipitated by either H3K4me3 or H3K27me3 antibodies in nuclear lysates from normal fibroblasts, we found that lamin A/C was preferentially enriched in the anti-H3K27me3 IP (Fig. 3C). Quantification of three independent experiments showed a significant increase of more than twofold in the amount of lamin A/C bound to H3K27me3 compared with H3K4me3, suggesting H3K27me3-modified repressive chromatin has a higher affinity to the nuclear lamina than open chromatin (Fig. 3D).
Loss of spatial compartments in HGPS fibroblasts
In normal cells, heterochromatic, gene-poor, inactive regions of chromatin tend to spatially cluster together near the nuclear periphery, while open, active, gene-dense regions cluster together in the nuclear interior (Cremer and Cremer 2010). Based on the above observation that reduction in H3K27me3 modification and in lamin A/C-chromatin associations primarily occur in gene-poor regions in HGPS fibroblasts, we predicted that the spatial arrangement of these normal compartments would be disrupted in HGPS cells. To test this idea, we characterized the three-dimensional genome architecture in normal and HGPS cells using Hi-C (Lieberman-Aiden et al. 2009). Hi-C was performed on the same HGPS cell line as used in the previous ChIP experiments at two passages (p17 and p19), as well as on the two normal fibroblast cell lines (Father and Age Control) at similar passages (Father-p18 and Age Control-p20). The HGPS fibroblasts exhibited severe nuclear abnormality (blebbing) at passage 17 and showed a slight increase in the nuclear blebbing at passage 19 (Supplemental Fig S10). However, most HGPS fibroblasts at passage 17 were still proliferating, and those at passage 19 were approaching senescence.
After correcting the Hi-C interaction maps for systematic biases as previously described (Imakaev et al. 2012; X Zhang et al. 2012), we observed that, in normal cells (Age Control and Father), structured patterns of interaction are evident between proximal and distal regions of the same chromosome (patterns of weaker and stronger interaction between a given chromosomal bin and all other bins on a chromosome are visible in each row or column of the heatmaps in Supplemental Fig. S11A). As described in a previous study (Lieberman-Aiden et al. 2009), when we find the correlations between the interaction patterns of each genomic bin (Fig. 4A), we find two unique patterns of interaction, which were previously found to represent two spatial compartments where open (“A compartment”) and closed (“B compartment”) chromatin domains associate. The red and blue plaid pattern (Fig. 4A) shows this spatial compartmentalization by indicating, for a given chromosomal bin (row or column), which regions share a similar set of interactions (red, same compartments) or have an anti-correlated interaction pattern (blue, different compartments). Along a row, regions that are red are more likely to interact with each other than with regions that are blue, and vice versa. This compartmentalization pattern in Hi-C data represents the well-characterized spatial separation of active and inactive chromosomal domains as observed by microscopy. When principal component analysis (PCA) is used to partition these Hi-C interaction maps, the first principal component captures the plaid pattern, with positive values corresponding to the open chromatin interaction pattern and negative values corresponding to the closed chromatin interaction pattern (Fig. 5A).
Figure 4.

Loss of compartments in prematurely senescent HGPS fibroblast cells. (A) Pearson correlation maps of chromosome 7 reveal the compartment structure of the genome (red and blue “plaid” pattern). Compartments are clearly visible in Father control fibroblasts at passage 18 (left) and show subtle changes in HGPS cells at passage 17 (middle), but compartments are lost in senescing HGPS cells at passage 19 (right). (B) The percentage of the Hi-C data explained by the compartment eigenvector (first principal component) is shown for each chromosome. The compartment signal explains a large proportion of the variance in normal cells (blue; average of % explained from Father and Age Control samples tested). This percentage explained decreases slightly in HGPS-p17 cells (red) and then global decreases in HGPS-p19 cells (green). (C) Electron microscopic observations of HGPS-p18 and Father-p18 fibroblasts. A high-magnification view showed a normal array of heterochromatin adjacent to the nuclear envelope (Father, left). A higher-magnification view of an HGPS cell showed a loss of peripheral heterochromatin (right). Compared with Father control, the chromosomes in HGPS nucleus exhibit a loss of higher-order genome organization (scale bars, 500 nm). (N) Nucleus; (C) cytoplasm.
Figure 5.

H3K27me3 and lamin changes correspond with compartment changes from control to HGPS cells. (A) Comparison of compartment structure in control and HGPS cells with changes in H3K27me3 and lamin A/C binding between control and patient on chromosome 7. Compartment tracks are at 1-Mb resolution, smoothed with a 200-kb step size while lamin and H3K27me3 change tracks are at 200-kb resolution, plotted as in Figures 1 through 3. Positive values of the compartment eigenvector (derived from principal component analysis) correspond to domains of open chromatin, while negative values correspond to the closed chromatin compartment. (Red boxes) Examples of closed compartment regions with a decrease in H3K27me3 or lamin A/C binding in HGPS cells. (B) Comparison of the distribution of H3K27me3 change at sites of compartment change. The distribution of H3K27me3 log ratios (control/HGPS) are shown in a violin plot for 1-Mb bins that changed from open to closed (“AtoB,” left) or closed to open (“BtoA,” right). The H3K27me3 values show significantly higher increases for AtoB regions than for BtoA regions as evaluated by a KS test and a circular permutation of the data (1000 permutations). (C) The distributions of lamin A/C binding log ratios (control/HGPS) are displayed vs. compartment change as in B. Lamin A/C binding increases at genomic regions that change from open to closed and decreases at regions that change from closed to open.
The compartment pattern is well defined in both normal samples (Father sample is shown in Fig. 4A, and Age Control is shown in Supplemental Fig. S11B). A high percentage (92%) of genomic bins have the same compartment assignment (A or B) in both normal cell lines. Consistent regions in both normal samples (“normal”) were used for further statistical comparisons with HGPS samples.
Interestingly, in HGPS samples, we observed clear compartment signals in passage 17 cells, but in passage 19 cells, most genomic regions exhibited a loss of compartmentalization. Visual inspection of the Hi-C interaction map confirms a dramatic loss of the plaid pattern, indicating loss of compartment formation (Fig. 4A). This compartment loss can be quantified by finding the proportion of the Hi-C interaction map variance that is explained by the first principal component (the “compartment eigenvector”). The compartmentalization of active and inactive domains explains 50%–80% of the Hi-C signal in normal cells (Fig. 4B). This proportion of variance explained by compartments decreases only slightly on average (2% less) for HGPS p17 cells. However, the compartment signature accounts for only 5%–20% of the Hi-C data variance for HGPS p19 cells. Thus, even though some compartment structure can be still identified in the HGPS p19 cells, this structure is very weak in these late passage cells (Fig. 4B). These results suggest that global loss of chromosome compartments occurs catastrophically throughout the genome when HGPS cells approach a prematurely senescent stage.
To visualize the chromatin compaction changes in HGPS cells, we performed high-resolution electron microscopy on the nuclei of HGPS and Father control cells at passage 18. Consistent with a previous study (Goldman et al. 2004), we found that the dark-staining areas of heterochromatin near the nuclear lamina in normal cells are lost in HGPS cells (Fig. 4C), which is in line with the findings on the reduced lamin A/C–heterochromatin interaction in HGPS cells, as described in Figure 3. In addition, compared with the Father nucleus, the HGPS nucleus has less high-order, electron-dense structures, and its chromatin appears to be more uniformly compacted to form a “thread-like” conformation (Fig. 4C). These high-resolution imaging observations are in agreement with Hi-C results on the global changes in genome structure in HGPS cells.
Correlation of changes in H3K27me3 localization and lamin A/C binding with 3D organization changes
We next compared the patterns of compartmentalization and compartment changes (as classified by the first principal component eigenvector as above) with changes in H3K27me3 and lamin interactions. Regions that showed a decrease in H3K27me3 or lamin A/C binding in HGPS cells tended to correspond to the closed and gene-poor chromatin spatial compartment in normal cells (Fig. 5A, examples are shown in red boxes), consistent with the observation that both normal compartmentalization and changes in H3K27me3 and lamin A/C correlate with gene density.
Even though the most evident change in late passage HGPS cells is an overall loss of compartmentalization, the first principal component can still assign genomic regions to compartments based on some remaining weak signal. We thus compared compartment assignments between normal and HGPS cells to identify which regions of chromatin experience reorganization during the overall compartment loss. Genome-wide analysis indicated that compared with the controls, 3% of 1-Mb genomic regions showed a compartment change in HGPS-p17 samples compared with regions consistent between the two controls, while 12% of regions changed in HGPS-p19 samples (here, the compartment changes include both “open to closed” and “closed to open”). In addition, the changes in eigenvector values (HGPS/normal) were markedly greater in passage 19 cells than in passage 17 cells (Supplemental Fig. S12).
Next, we compared the changes in spatial compartments with the changes in H3K27me3 modification and lamin A/C association. We compared the H3K27me3 changes and lamin A/C changes at the 1-Mb bins that change spatial compartment assignment between the controls and HGPS-p19 according to the Hi-C analysis. Compartment change was defined as both a change in the sign of the eigenvector and a change of at least 0.03 in the value of the eigenvector.
We found that regions that change from open in normal cells to a closed spatial compartment in HGPS cells associate with increased H3K27me3 signals and increased lamin binding, while changes from closed in normal cells to open in HGPS cells occur where there are decreases in H3K27me3 modification and lamin binding (Fig. 5B,C). These associations are statistically significant (P < 0.001) according to a circular permutation test. Similar, though somewhat less strong, results were also obtained from the early passage HGPS-p17 cells (Supplemental Fig. S13) and from analyzing these data using an average signature plot (Supplemental Fig. S14).
In summary, the Hi-C analysis revealed two phenomena in the patterns of genome organization change as HGPS cells progress to later passages. First, there is a global decrease in the strength of active and inactive chromatin compartmentalization in HGPS cells as they senesce. Very preliminary Hi-C study on normal senescent cells suggests that some compartment changes take place, though the changes do not appear to be as drastic as in HGPS (data not shown). Future work will be required to determine the extent to which this compartment loss is unique to HGPS or related to normal senescence. Second, there are certain genomic regions that change compartment identity in HGPS compared with normal cells, and these compartment changes are in consistent directions with the changes in repressive histone mark H3K27me3 and in lamin A/C association with chromatin. These correlated changes could be directly relevant to progerin accumulation, though their significance cannot be completely ascertained without further investigation of normal senescing cells.
Discussion
A previous study showed that progerin alters H3K27me3 modifications in the interphase nucleus, and the change in H3K27me3 occurs before the nuclear blebbing phenotype appears, implicating the epigenetic changes as upstream events during the cellular HGPS phenotype progression (Shumaker et al. 2006).
To explore the potential consequences of H3K27me3 alterations in HGPS, we mapped the chromosome regions with enriched or depleted H3K27me3 in HGPS fibroblast cells. Our analysis indicates that the loss or gain of H3K27me3 in a genomic region correlates strongly with its gene density: Gene-poor regions tend to lose H3K27me3, and gene-rich regions gain (Fig. 1). We also observe a significant but globally weak relationship between H3K27me3 changes and gene expression alterations in HGPS. The observation that not all regions with altered gene expression show correlated changes in H3K27me3 is in line with a previous report that loss of H3K27me3 is not always required for gene up-regulation (Guelen et al. 2008; Sen et al. 2008). Future functional studies on those genes whose expression changes are correlated with loss or gain of H3K27me3 at their promoters in HGPS may reveal molecular insights about HGPS phenotypes.
The lamina network is known to play a role in facilitating nuclear organization, at least partially through interactions with chromosomes (Gruenbaum et al. 2005; Dechat et al. 2009). We find that chromatin associations with lamin A/C, a major component of the nuclear lamina, are altered in HGPS fibroblast cells (Fig. 3). The detachment of chromatin from the lamina, visible under electron microscopy (Fig. 4C), often occurs in the gene-poor genomic regions with decreased H3K27me3 in HGPS cells (Fig. 3A; Supplemental Fig. S9). In vitro biochemical analysis demonstrated a stronger physical interaction of H3K27me3-modified chromatin with lamin A/C compared with the H3K4me3-modified regions (Fig. 3C,D). These results suggest that lamina detachments in HGPS could potentially be caused by the disruption of lamin A/C structure and/or a reduction of H3K27me3 in those regions. We note that we cannot in this study distinguish between chromatin associations with lamin A/C at the periphery and at internal nucleoplasmic foci, which are also known to decrease in HGPS (Musich and Zou 2009). Nor can we specifically characterize the role of decreased levels of wild-type lamin A/C in HGPS (Goldman et al. 2004) in the changes in lamin–chromatin associations we observe. How these factors relate to our observations will require future study.
To further characterize the chromosome structure changes in HGPS, we applied Hi-C (Lieberman-Aiden et al. 2009). As expected, we find that in control cells, genome organization is characterized by prominent compartmentalization where active and inactive chromatin domains cluster in different spatial compartments. During early passages of HGPS cells, we find similar compartmentalization, but interestingly, we also find that some compartments have changed; i.e., some loci moved from the A-compartment to the B-compartment and vice versa. At a later passage, when most HGPS cells have entered premature senescence, we observe a global loss of compartmentalization (Fig. 4). Importantly, the changes in spatial genome organization correlate with changes in H3K27me3 and lamin A/C binding that have already occurred at an earlier passage (Fig. 5). Thus, changes in H3K27me3 and lamin A/C binding precede and could have a causal influence on later major chromatin structure changes.
Our study supports a model in which progerin accumulation leads to a disruption of the normal nuclear envelope scaffold. As a consequence, correlated changes occur in chromatin associations with the nuclear lamina and the distribution of the heterochromatin mark H3K27me3, which may be influenced by the down-regulation of EZH2. Localized changes in H3K27me3 at CpG promoters lead to changes in gene expression at early passages, while larger-scale changes in H3K27me3 and lamin associations eventually trigger the global loss of spatial chromatin compartmentalization at late passages. Future work will be needed to establish whether these events are causally related, as this proposed model suggests.
Reduction of H3K27me3 and loss of heterochromatin–lamina association have been previously shown to be relevant in the progression of HGPS (Shumaker et al. 2006). However, our results also show evidence of regions that gain H3K27me3 (Figs. 1, 2), increase association with lamin A/C (Fig. 3), and change compartment identity from open to closed (Figs. 4, 5). These observations may suggest that the changes in chromatin structure during HGPS progression involve some heterochromatin formation as well as heterochromatin loss. Further work will be necessary to determine the potential biological importance of these regions with increased repressive marks. Moreover, it was surprising that the loss of compartmentalization revealed by Hi-C between HGPS-p17 and HGPS-p19 is much more significant than the change in nuclear shape. The relationship between these two phenomena will need further investigation.
It is known that tissue aging and cellular senescence in normal cells is accompanied by redistribution of heterochromatin from constitutive heterochromatin to other normally euchromatic sites (Sedivy et al. 2008). In addition, EZH2 down-regulation in human fibroblasts is associated with stress-induced cellular senescence (Bracken et al. 2007). Moreover, moderate perturbation of the EZH2 silencing can increase longevity (Siebold et al. 2010). All of these phenomena are closely aligned with the considerably more dramatic findings reported here in HGPS cells. Future experiments may elucidate the changes of chromosome structure and nuclear organization during normal aging with a combination of both genomic approaches and high-resolution imaging methods. As has been previously demonstrated for other molecular details (Scaffidi and Misteli 2006; Cao et al. 2007, 2011b; McClintock et al. 2007; Gruenbaum 2009; Olive et al. 2010), the study of HGPS may open a window into the normal aging process, providing an opportunity to understand relevant pathways and even potential interventions.
Methods
Cell lines
The three primary fibroblast cell lines used in the ChIP, expression microarray, and Hi-C experiments were HGADFN167 (HGPS), HGFDFN168 (Father, normal), and AG08470 (Age Control, normal). Additional fibroblast lines were used in EZH2 RT-qPCR analysis, and these cell lines were HGADFN169 (HGPS), HGADFN164 (HGPS), HGADFN155 (HGPS), and HGFDFN090 (normal). AG08470 was obtained from Coriell, and the other cell lines were obtained from the Progeria Research Foundation. These primary human dermal fibroblasts were cultured in MEM (Invitrogen/GIBCO) supplemented with 15% fetal bovine serum (FBS; Invitrogen) and 2 mM L-glutamine.
Antibodies
The antibodies used in the study included a mouse anti-lamin A/C antibody (MAB3211, Chemicon), a goat anti-lamin A/C antibody (N18, Santa Cruz), a mouse anti-H3K27me3 antibody (Abcam) for chromatin IP, a rabbit anti-H3K27me3 (Millipore) for Western blotting, a rabbit anti-H3K4me3 (Abcam), a control rabbit IgG antibody (Santa Cruz), and a rabbit anti-histone H3 antibody (Abcam).
Statistical analysis
Unless otherwise specified, results are presented as mean ± SD for RT-PCR analysis and quantification of Western signals. Data were analyzed using unpaired, one-tailed Student's t-tests, and a P-value less than 0.05 was considered significant.
For full details of other methods, see Supplemental Information.
Data access
Raw and processed expression array, ChIP-seq, and Hi-C data have been submitted to the NCBI Gene Expression Omnibus (GEO) (http://www.ncbi.nlm.nih.gov/geo/) under accession number GSE41764. The processed and binned lamin A/C and H3K27me3 ChIP-seq data for each cell line across the genome and the comparison between cell lines can be found at http://research.nhgri.nih.gov/manuscripts/Collins/HGPSepigenetics/.
Acknowledgments
We thank Dr. Michelle Olive, Dr. Elizabeth Nabel, and members in the Cao lab for informative discussions, the bioinformatics core at NHGRI for technical help, Dr. Alice Young at NHGRI for sequencing support, and Dr. Norma Andrews at the University of Maryland College Park for sharing her lab equipment and for helpful discussions. This work was supported by NIH Grants R00AG029761 (K.C.), HG003143 (J.D.), F32GM100617 (R.P.M.), a diversity research supplement to R00AG029761 (A.N-T. and K.C.), a W.M. Keck Foundation Distinguished Young Scholar in Medical Research Award (J.D.), a UMD Research and Scholarship award (K.C.), and the intramural program of the National Human Genome Research Institute (F.S.C.).
Footnotes
[Supplemental material is available for this article.]
Article published online before print. Article, supplemental material, and publication date are at http://www.genome.org/cgi/doi/10.1101/gr.138032.112.
References
- Bracken AP, Dietrich N, Pasini D, Hansen KH, Helin K 2006. Genome-wide mapping of Polycomb target genes unravels their roles in cell fate transitions. Genes Dev 20: 1123–1136 [DOI] [PMC free article] [PubMed] [Google Scholar]
- Bracken AP, Kleine-Kohlbrecher D, Dietrich N, Pasini D, Gargiulo G, Beekman C, Theilgaard-Monch K, Minucci S, Porse BT, Marine JC, et al. 2007. The Polycomb group proteins bind throughout the INK4A-ARF locus and are disassociated in senescent cells. Genes Dev 21: 525–530 [DOI] [PMC free article] [PubMed] [Google Scholar]
- Cao K, Capell BC, Erdos MR, Djabali K, Collins FS 2007. A lamin A protein isoform overexpressed in Hutchinson-Gilford progeria syndrome interferes with mitosis in progeria and normal cells. Proc Natl Acad Sci 104: 4949–4954 [DOI] [PMC free article] [PubMed] [Google Scholar]
- Cao K, Blair CD, Faddah DA, Kieckhaefer JE, Olive M, Erdos MR, Nabel EG, Collins FS 2011a. Progerin and telomere dysfunction collaborate to trigger cellular senescence in normal human fibroblasts. J Clin Invest 121: 2833–2844 [DOI] [PMC free article] [PubMed] [Google Scholar]
- Cao K, Graziotto JJ, Blair CD, Mazzulli JR, Erdos MR, Krainc D, Collins FS 2011b. Rapamycin reverses cellular phenotypes and enhances mutant protein clearance in hutchinson-gilford progeria syndrome cells. Sci Transl Med 3: 89ra58. [DOI] [PubMed] [Google Scholar]
- Capell BC, Collins FS 2006. Human laminopathies: Nuclei gone genetically awry. Nat Rev Genet 7: 940–952 [DOI] [PubMed] [Google Scholar]
- Capell BC, Collins FS, Nabel EG 2007. Mechanisms of cardiovascular disease in accelerated aging syndromes. Circ Res 101: 13–26 [DOI] [PubMed] [Google Scholar]
- Capell BC, Tlougan BE, Orlow SJ 2009. From the rarest to the most common: Insights from progeroid syndromes into skin cancer and aging. J Invest Dermatol 129: 2340–2350 [DOI] [PubMed] [Google Scholar]
- Cremer T, Cremer M 2010. Chromosome territories. Cold Spring Harb Perspect Biol 2: a003889. [DOI] [PMC free article] [PubMed] [Google Scholar]
- Deaton AM, Bird A 2011. CpG islands and the regulation of transcription. Genes Dev 25: 1010–1022 [DOI] [PMC free article] [PubMed] [Google Scholar]
- Dechat T, Pfleghaar K, Sengupta K, Shimi T, Shumaker DK, Solimando L, Goldman RD 2008. Nuclear lamins: Major factors in the structural organization and function of the nucleus and chromatin. Genes Dev 22: 832–853 [DOI] [PMC free article] [PubMed] [Google Scholar]
- Dechat T, Adam SA, Goldman RD 2009. Nuclear lamins and chromatin: When structure meets function. Adv Enzyme Regul 49: 157–166 [DOI] [PMC free article] [PubMed] [Google Scholar]
- Driscoll MK, Albanese JL, Xiong ZM, Mailman M, Losert W, Cao K 2012. Automated image analysis of nuclear shape: What can we learn from a prematurely aged cell? Aging 4: 119–132 [DOI] [PMC free article] [PubMed] [Google Scholar]
- Eriksson M, Brown WT, Gordon LB, Glynn MW, Singer J, Scott L, Erdos MR, Robbins CM, Moses TY, Berglund P, et al. 2003. Recurrent de novo point mutations in lamin A cause Hutchinson-Gilford progeria syndrome. Nature 423: 293–298 [DOI] [PMC free article] [PubMed] [Google Scholar]
- Goldman RD, Shumaker DK, Erdos MR, Eriksson M, Goldman AE, Gordon LB, Gruenbaum Y, Khuon S, Mendez M, Varga R, et al. 2004. Accumulation of mutant lamin A causes progressive changes in nuclear architecture in Hutchinson-Gilford progeria syndrome. Proc Natl Acad Sci 101: 8963–8968 [DOI] [PMC free article] [PubMed] [Google Scholar]
- Gordon LB, Cao K, Collins FS 2012a. Progeria: Translational insights from cell biology. J Cell Biol 199: 9–13 [DOI] [PMC free article] [PubMed] [Google Scholar]
- Gordon LB, Kleinman ME, Miller DT, Neuberg DS, Giobbie-Hurder A, Gerhard-Herman M, Smoot LB, Gordon CM, Cleveland R, Snyder BD, et al. 2012b. Clinical trial of a farnesyltransferase inhibitor in children with Hutchinson-Gilford progeria syndrome. Proc Natl Acad Sci 109: 16666–16671 [DOI] [PMC free article] [PubMed] [Google Scholar]
- Gruenbaum Y 2009. The curious case of the ageing cells. Nat Rev Mol Cell Biol 10: 242. [DOI] [PubMed] [Google Scholar]
- Gruenbaum Y, Margalit A, Goldman RD, Shumaker DK, Wilson KL 2005. The nuclear lamina comes of age. Nat Rev Mol Cell Biol 6: 21–31 [DOI] [PubMed] [Google Scholar]
- Guelen L, Pagie L, Brasset E, Meuleman W, Faza MB, Talhout W, Eussen BH, de Klein A, Wessels L, de Laat W, et al. 2008. Domain organization of human chromosomes revealed by mapping of nuclear lamina interactions. Nature 453: 948–951 [DOI] [PubMed] [Google Scholar]
- Hawkins RD, Hon GC, Lee LK, Ngo Q, Lister R, Pelizzola M, Edsall LE, Kuan S, Luu Y, Klugman S, et al. 2010. Distinct epigenomic landscapes of pluripotent and lineage-committed human cells. Cell Stem Cell 6: 479–491 [DOI] [PMC free article] [PubMed] [Google Scholar]
- Imakaev M, Fudenberg G, McCord RP, Naumova N, Goloborodko A, Lajoie BR, Dekker J, Mirny LA 2012. Iterative correction of Hi-C data reveals hallmarks of chromosome organization. Nat Methods 9: 999–1003 [DOI] [PMC free article] [PubMed] [Google Scholar]
- Johnson DS, Mortazavi A, Myers RM, Wold B 2007. Genome-wide mapping of in vivo protein-DNA interactions. Science 316: 1497–1502 [DOI] [PubMed] [Google Scholar]
- Lieberman-Aiden E, van Berkum NL, Williams L, Imakaev M, Ragoczy T, Telling A, Amit I, Lajoie BR, Sabo PJ, Dorschner MO, et al. 2009. Comprehensive mapping of long-range interactions reveals folding principles of the human genome. Science 326: 289–293 [DOI] [PMC free article] [PubMed] [Google Scholar]
- Mardis ER 2007. ChIP-seq: Welcome to the new frontier. Nat Methods 4: 613–614 [DOI] [PubMed] [Google Scholar]
- Margueron R, Justin N, Ohno K, Sharpe ML, Son J, Drury WJ III, Voigt P, Martin SR, Taylor WR, De Marco V, et al. 2009. Role of the polycomb protein EED in the propagation of repressive histone marks. Nature 461: 762–767 [DOI] [PMC free article] [PubMed] [Google Scholar]
- McClintock D, Ratner D, Lokuge M, Owens DM, Gordon LB, Collins FS, Djabali K 2007. The mutant form of lamin A that causes Hutchinson-Gilford progeria is a biomarker of cellular aging in human skin. PLoS ONE 2: e1269. [DOI] [PMC free article] [PubMed] [Google Scholar]
- Merideth MA, Gordon LB, Clauss S, Sachdev V, Smith AC, Perry MB, Brewer CC, Zalewski C, Kim HJ, Solomon B, et al. 2008. Phenotype and course of Hutchinson-Gilford progeria syndrome. N Engl J Med 358: 592–604 [DOI] [PMC free article] [PubMed] [Google Scholar]
- Musich PR, Zou Y 2009. Genomic instability and DNA damage responses in progeria arising from defective maturation of prelamin A. Aging (Albany NY) 1: 28–37 [DOI] [PMC free article] [PubMed] [Google Scholar]
- Olive M, Harten I, Mitchell R, Beers J, Djabali K, Cao K, Erdos MR, Blair C, Funke B, Smoot L, et al. 2010. Cardiovascular pathology in Hutchinson-Gilford Progeria: Correlation with the vascular pathology of aging. Arterioscler Thromb Vasc Biol 30: 2301–2309 [DOI] [PMC free article] [PubMed] [Google Scholar]
- Pauler FM, Sloane MA, Huang R, Regha K, Koerner MV, Tamir I, Sommer A, Aszodi A, Jenuwein T, Barlow DP 2009. H3K27me3 forms BLOCs over silent genes and intergenic regions and specifies a histone banding pattern on a mouse autosomal chromosome. Genome Res 19: 221–233 [DOI] [PMC free article] [PubMed] [Google Scholar]
- Pinskaya M, Morillon A 2009. Histone H3 lysine 4 di-methylation: A novel mark for transcriptional fidelity? Epigenetics 4: 302–306 [DOI] [PubMed] [Google Scholar]
- Robertson G, Hirst M, Bainbridge M, Bilenky M, Zhao Y, Zeng T, Euskirchen G, Bernier B, Varhol R, Delaney A, et al. 2007. Genome-wide profiles of STAT1 DNA association using chromatin immunoprecipitation and massively parallel sequencing. Nat Methods 4: 651–657 [DOI] [PubMed] [Google Scholar]
- Scaffidi P, Misteli T 2006. Lamin A-dependent nuclear defects in human aging. Science 312: 1059–1063 [DOI] [PMC free article] [PubMed] [Google Scholar]
- Sedivy JM, Banumathy G, Adams PD 2008. Aging by epigenetics—a consequence of chromatin damage? Exp Cell Res 314: 1909–1917 [DOI] [PMC free article] [PubMed] [Google Scholar]
- Sen GL, Webster DE, Barragan DI, Chang HY, Khavari PA 2008. Control of differentiation in a self-renewing mammalian tissue by the histone demethylase JMJD3. Genes Dev 22: 1865–1870 [DOI] [PMC free article] [PubMed] [Google Scholar]
- Shumaker DK, Dechat T, Kohlmaier A, Adam SA, Bozovsky MR, Erdos MR, Eriksson M, Goldman AE, Khuon S, Collins FS, et al. 2006. Mutant nuclear lamin A leads to progressive alterations of epigenetic control in premature aging. Proc Natl Acad Sci 103: 8703–8708 [DOI] [PMC free article] [PubMed] [Google Scholar]
- Siebold AP, Banerjee R, Tie F, Kiss DL, Moskowitz J, Harte PJ 2010. Polycomb Repressive Complex 2 and Trithorax modulate Drosophila longevity and stress resistance. Proc Natl Acad Sci 107: 169–174 [DOI] [PMC free article] [PubMed] [Google Scholar]
- Soshnikova N, Duboule D 2009. Epigenetic temporal control of mouse Hox genes in vivo. Science 324: 1320–1323 [DOI] [PubMed] [Google Scholar]
- Zhang H, Kieckhaefer JE, Cao K 2012. Mouse models of laminopathies. Aging Cell. doi: 10.1111/acel.12021 [DOI] [PubMed] [Google Scholar]
- Zhang X, Abreu JG, Yokota C, Macdonald BT, Singh S, Coburn KL, Cheong SM, Zhang MM, Ye QZ, Hang HC, et al. 2012. Tiki1 is required for head formation via Wnt cleavage-oxidation and inactivation. Cell 149: 1565–1577 [DOI] [PMC free article] [PubMed] [Google Scholar]