

Abstract
Gene overexpression beyond a permissible limit causes defects in cellular functions. However, the permissible limits of most genes are unclear. Previously, we developed a genetic method designated genetic tug-of-war (gTOW) to measure the copy number limit of overexpression of a target gene. In the current study, we applied gTOW to the analysis of all protein-coding genes in the budding yeast Saccharomyces cerevisiae. We showed that the yeast cellular system was robust against an increase in the copy number by up to 100 copies in >80% of the genes. After frameshift and segmentation analyses, we isolated 115 dosage-sensitive genes (DSGs) with copy number limits of 10 or less. DSGs contained a significant number of genes involved in cytoskeletal organization and intracellular transport. DSGs tended to be highly expressed and to encode protein complex members. We demonstrated that the protein burden caused the dosage sensitivity of highly expressed genes using a gTOW experiment in which the open reading frame was replaced with GFP. Dosage sensitivities of some DSGs were rescued by the simultaneous increase in the copy numbers of partner genes, indicating that stoichiometric imbalances among complexes cause dosage sensitivity. The results obtained in this study will provide basic knowledge about the physiology of chromosomal abnormalities and the evolution of chromosomal composition.
Intracellular biochemical parameters, such as gene expression levels and protein activities, are highly optimized to maximize the performance of biological systems (Zaslaver et al. 2004; Dekel and Alon 2005; Wagner 2005). These parameters, however, have certain permissive ranges to protect the function of the system against perturbations such as environmental changes, mutations, and noise in biochemical reactions. This robustness against fluctuations in parameters is considered a common design principle of biological systems (Alon et al. 1999; Little et al. 1999; von Dassow et al. 2000). When gene expression fluctuates beyond the robustness of cellular systems, various defects occur in the systems. However, the differences in the expression limits of different genes and the factors influencing these differences are unclear.
We previously developed the genetic tug-of-war (gTOW) method to measure the limit of gene overexpression (Moriya et al. 2006, 2011, 2012). Using gTOW, we can assess the limit of gene overexpression as the copy number limit (CNL) of the target gene as follows. A target gene with its native regulatory sequences is cloned into a plasmid for gTOW. The plasmid carries a 2-micron origin, URA3, and LEU2 with a truncated promoter (leu2d). Yeast cells are transformed by the plasmid, and the transformants are first selected in medium lacking uracil (−Ura). The cells are then transferred into medium lacking both uracil and leucine (−Leu−Ura). In this medium, leu2d becomes a selection bias to increase the plasmid copy number in the cells because the cells with higher leu2d (plasmid) copy numbers grow faster. As the copy number increases, the copy number of the target gene also increases, and the gene becomes proportionally overexpressed according to the increased copy number. If the gene has an overexpression limit at which cellular function is halted when the limit is crossed (i.e., inducing cellular death), then the plasmid copy number must be less than the limit, and the target gene becomes a selection bias to decrease the plasmid copy number. Biases arising from leu2d (that increases the plasmid copy number) and the target gene (that decreases the plasmid copy number) determine the plasmid copy number in the cells (thus, we designated this method “genetic tug-of-war”). Because the bias to increase the plasmid copy number by leu2d is always the same, the copy number should be associated with the CNL of overexpression of the target gene. The plasmid copy number determined under the −Leu−Ura condition is considered the CNL of overexpression of the target gene if the copy number is significantly lower than that of the empty vector control (which is usually ∼100 copies per haploid genome). As the plasmid copy number and the cellular max growth rate under the −Leu−Ura condition are correlated with each other, max growth rate can also be an indicator of the CNL of the target gene. Ideally, in gTOW, the protein level expressed from the target gene increases according to the copy number increase. However, if the transcription factors for the target gene are diluted or if there is feedback in expression regulation, then the copy number increase might not be linearly reflected in the protein level. In this study, we thus designated it on the basis of the overexpression limit measured by gTOW as the “CNL of overexpression” to distinguish the limit of protein overexpression. We previously determined the CNLs of cell cycle regulatory genes in the budding yeast and fission yeast and found that their CNLs were diverse, ranging from less than two to more than 100 (Moriya et al. 2006, 2011).
Several genome-wide analyses revealed the genes that cause cellular dysfunction upon overexpression (Gelperin et al. 2005; Sopko et al. 2006). These analyses were performed using promoter swapping in which each target open reading frame (ORF)/protein is highly expressed by the strong inducible GAL1 promoter. The results obtained by promoter swapping and gTOW are known to be different (Moriya et al. 2006; Krantz et al. 2009) because the former technique causes absolute overexpression and the latter causes relative overexpression from the native level. The promoter swapping approach is useful for determining what happens when a target protein abundantly exists within the cell. Conversely, it is difficult to argue how much the target is overexpressed when cellular dysfunction is observed. As gTOW increases the copy number of the target gene with its native promoter, this argument is possible. We thus consider that gTOW is a useful method for evaluating the robustness of cellular systems by assessing how much gene expression is fluctuated from the native level when the system halts (Moriya et al. 2012). The advantage of gTOW is that one cannot only isolate genes causing cellular dysfunctions upon overexpression but also quantitate the limits of gene overexpression that are associated with cellular robustness. In addition, we consider that gTOW is useful for evaluating cellular dysfunction triggered by the fluctuation of the gene copy number.
In this study, we performed a genome-wide CNL measurement of genes of the budding yeast Saccharomyces cerevisiae using gTOW to reveal the profile of CNLs of all genes in this organism and determine why the yeast cellular systems are sensitive to minor increases in the copy numbers of those genes. First, we isolated 786 genes with significantly low CNLs. Further, we isolated genes with extremely low CNLs (10 or fewer copies per haploid genome), which we designated “yeast dosage-sensitive genes” (DSGs). Our results indicated that the yeast cellular system was robust against copy number variations (overexpression) in most genes but fragile against variations in a specific set of genes. Yeast DSGs tended to encode protein complex components, as well as proteins involved in cytoskeletal organization and intracellular transport. Our experimental evidence suggested that protein burden and stoichiometric imbalance are the primary causes of dosage sensitivity. These findings may have an interesting evolutionary implication in that DSGs function to constrain and secure the integrity of eukaryotic genomes during evolution.
Results
gTOW6000: Analysis of all protein-coding genes in S. cerevisiae using gTOW
To analyze all protein-coding genes in the S. cerevisiae genome using gTOW, we performed a series of experiments as summarized in Figure 1 (for details, see the Methods). We amplified all protein-coding genes (5806) with their native regulatory regions in the yeast strain BY4741 chromosome using polymerase chain reaction (PCR) and then cloned the genes into pTOWug2-836 (Supplemental Fig. S1; Moriya et al. 2012). Because not all promoter regions were identified, we cloned genes with their upstream and downstream sequences up to their neighboring genes (as an example, see Supplemental Fig. S2A,B). Cells harboring the gTOW plasmids with each target gene were cultivated in −Ura and −Leu−Ura media. We then measured max growth rate under the −Leu−Ura condition using online monitoring of cellular growth, and the plasmid copy numbers under the −Ura and −Leu−Ura conditions using quantitative PCR. We analyzed at least two independent plasmid clones for each gene. The reproducibility between each duplicate is shown in Supplemental Figure S3. To this point, we have succeeded in analyzing >95% of the genes in the yeast genome (the entire data can be found in Supplemental Table S1). Hereafter, we will refer to this analysis as “gTOW6000.”
Figure 1.

Scheme of genome-wide analysis of protein-coding genes in S. cerevisiae with gTOW (gTOW6000). Each step of gTOW6000 is shown. For steps 2–7, the representative data of plate no. 13 are given as an example. The details of each step are described in Methods.
Figure 2 shows the copy number under the −Leu−Ura condition determined in gTOW6000. gTOW6000 was performed using 96-well microplates. We handled 244 plates, as we analyzed two clones under two culture conditions for each gene. For the purpose of data quality control and to obtain a negative control, several empty vector experiments were performed for each plate (a total of 230 measurements) (Supplemental Table S2). The average of the empty vector experiments is shown as the orange line in Figure 2. To identify genes with significantly lower limits than the empty vector control, we evaluated the copy number data under the −Leu−Ura condition using Student's t-test. In total, 919 genes had P-values <0.05, and 786 of them had lower copy numbers than the vector average (genes surrounded by a blue-dotted rectangle in Fig. 2). We thus considered the copy numbers of these genes under the −Leu−Ura condition to be their CNLs of overexpression. The average copy number of these genes was less than 85. This finding conversely indicates that the other 5000 genes have similar or higher CNLs than the detectable CNL in gTOW using pTOWug2-836, and suggests that the yeast cellular system is generally robust against a nearly 100-fold increase in the copy number of any one of 80% of its genes. Although some genes displayed much higher limits than the vector average, there was no reproducibility between the two clones (Pearson's correlation coefficient between the duplicates of genes with average copy numbers of >250 was −0.26). We thus concluded that the findings were reflective of experimental errors.
Figure 2.

Copy number limits (CNLs) of S. cerevisiae genes determined by gTOW analysis. Genes were ordered according to their average copy number determined by gTOW under the −Leu−Ura condition. Each gene has two data points because of the duplication of the experiment. The orange line and the transparent zone around the line indicate the average copy number with the empty vector and the standard deviation, respectively. Genes that showed significantly lower limits than those observed in the vector experiments (786 genes, P < 0.05) are surrounded by the blue dotted rectangle. Genes with CNLs of 10 and less (dosage-sensitive genes [DSGs]) are surrounded by the red-dotted rectangle. A confident set of DSGs isolated after frameshift and segmentation analyses (Fig. 4) is shown. The entire data set is given in Supplemental Table S1.
In gTOW, there should be a correlation between the CNLs and max growth rates of low limit genes (Moriya et al. 2006, 2012). In addition, there should be a correlation between the copy numbers under the −Ura and −Leu−Ura conditions (Moriya et al. 2006). These expectations were confirmed in gTOW6000 (Supplemental Table S3). We next calculated the copy number causing 50% growth inhibition in gTOW6000. To reduce the effect of experimental errors, we first calculated the moving averages of max growth rates and CNLs for 100 of the 786 genes with significantly low CNLs (Supplemental Fig. S4A). To approximate the relationship between CNL and max growth rate (Supplemental Fig. S4B), we derived a first dimension equation as follows: CNL = 49.24 × [max growth rate] (R2 = 0.98). From the equation, the copy number that gave 50% growth inhibition (max growth rate = 1.11) was calculated to be 54.7 copies. If the target gene has a very low limit, then the cells expressing the gTOW plasmid cannot grow under the −Leu−Ura condition because they cannot produce sufficient amounts of leucine (Moriya et al. 2006). We next evaluated the lower limit copy number resulting in no growth in gTOW6000. We calculated the moving averages of max growth rates as described previously in this section. For each bin, we then counted the number of genes displaying no growth (max growth rate is set as 0.1; see Methods) in both of the duplicated experiments (i.e., frequency of no-growth) (Supplemental Fig. S5A). To approximate the relationship between frequency of no-growth and CNL (Supplemental Fig. S5B), we derived the following equation: [frequency of no-growth] = −0.0002 × CNL3 + 0.0476 × CNL2 − 3.6046 × CNL + 101.53 (R2 = 0.996). We used this equation to calculate that a gene with a CNL of 18.4 could not grow in 50% of cases in the gTOW experiment.
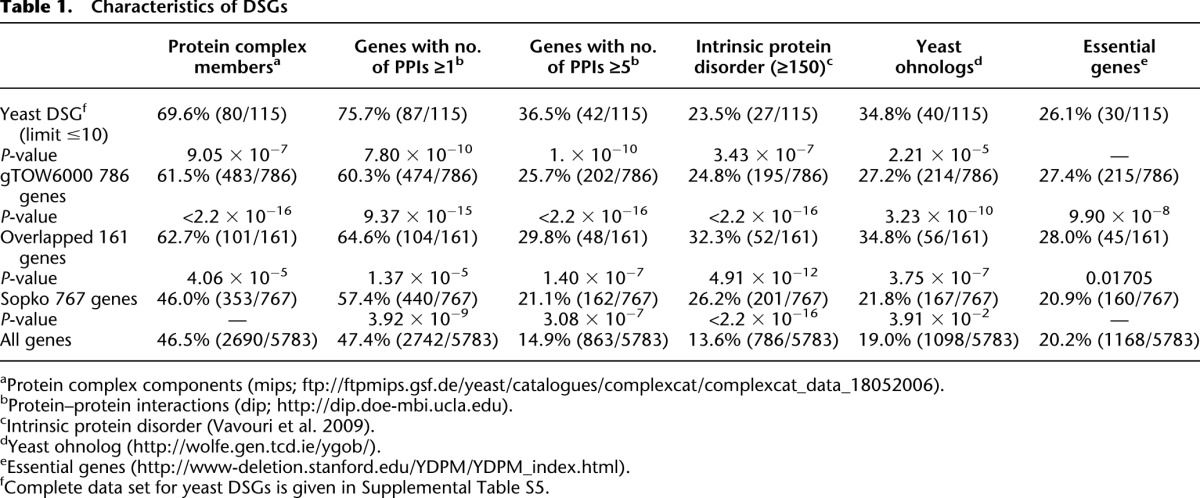
By use of genome-wide screening, Sopko et al. (2006) previously isolated 767 S. cerevisiae genes that caused cellular growth defects when overexpressed by the GAL1 promoter. As we isolated a similar number of genes with low CNLs (786 genes), we compared two data sets. As shown in Figure 3A, only 161 of the 786 genes isolated by gTOW6000 overlapped with those in the study by Sopko et al. (2006), although the overlap was significant (P < 1.5 × 10⁻⁸, chi-square test). The difference possibly arose from the difference in the experimental systems for overexpressing genes, as is discussed in the Introduction. The difference was significant when we separated isolated genes by their native expression levels (Fig. 3B). Highly expressed genes were significantly isolated as genes with low CNLs in gTOW6000 (P = 1.322 × 10⁻¹⁵ in the Mann-Whitney U-test), whereas this finding was not replicated in the study by Sopko et al. (2006) (P = 0.7378 in the Mann-Whitney U-test). Another difference between the two experiments was the proportions of protein complex members. The 786 genes isolated by gTOW contained significant numbers of protein complex members (Table 1), whereas the 767 genes isolated by Sopko et al. (2006) did not contain many protein complex members (Table 1). This might reflect the fact that protein complex members tend to be highly expressed (Supplemental Fig. S6). From these results, we considered that gTOW6000 would provide additional clues to understand the cellular effects of gene overexpression, as this method isolated a different subset of genes from previous promoter swapping experiments. Of the 161 overlapped genes (Fig. 3A), the highly expressed genes among the 786 gTOW6000 genes were excluded (Fig. 3B), and the complex members of 767 genes isolated by Sopko et al. (2006) were enriched (Table 1), probably due to the characteristics of the opposite data sets.
Figure 3.

Comparison of gTOW6000 data with data of another overexpression analysis performed using promoter swapping. (A) Overlap of genes identified by the overexpression analyses performed by Sopko et al. (2006) and in this study. (B) Distribution of genes identified by overexpression analysis ordered by their native protein levels. Each bin contains genes ordered by their native protein levels (Ghaemmaghami et al. 2003). The protein abundance unit is molecules per cell. Error bars, SEM.
Table 1.
Characteristics of DSGs
Isolation of low limit genes (yeast DSGs)
To further understand the characteristics of low limit genes, we performed additional experiments to isolate a confident set of genes with CNLs of 10 or less. We introduced a frameshift mutation in each of the 182 genes to confirm whether the expression of the protein but not that of the DNA and RNA elements determined the limit (Fig. 4A). Frameshift analysis could also determine whether either of the bidirectionally overlapped genes was the cause of the low CNL (for example, see Supplemental Fig. S7A). Among the 155 genes with CNLs of 20 or less, the frameshift mutants of 140 of these genes displayed more than fivefold higher CNLs than the wild-type genes or their CNLs increased to the vector level (∼100 copies) (Fig. 4B; Supplemental Table S4). We thus verified that the original target ORFs of these 140 genes determined the CNLs (denoted as “fs verified” in Supplemental Tables S1, S4).
Figure 4.

Frameshift and segmentation analyses of candidate low limit genes. (A) Structure of the plasmid used in frameshift analysis and segmentation analysis. (Red letters) The nucleotide inserted to generate frameshift. The introduced FspI site in the mutant is underlined. (B) A scatter plot of the CNLs of the wild-type genes and the frameshift mutants of low limit genes. (Black circles) Genes that displayed increased CNLs when frameshift was introduced. (Red circles) Genes that did not display increased CNLs even when frameshift was generated. Note that the frameshift mutants of AUA1, GAT1, and FHL1 could not be obtained, probably because their frameshift mutants also have very low limits. The raw data can be found in Supplemental Table S4. (C) CNLs of segmented genes. Genes underlined with a blue line are those that displayed increased CNLs upon segmentation. Genes underlined with a red line indicate genes that did not display increased CNLs upon segmentation.
We further analyzed the 15 genes in frameshift mutants that did not exhibit increased limits (12 of them are indicated by red circles in Fig. 4B). They were categorized as four different types of genes as follows. (1) One of the overlapping ORFs appeared to cause the low limits. The cloned regions contained two overlapping ORFs in cases of YFL010C/WWM1–YFL010W-A/AUA1 and YGL167C/PMR1–YGL168W/HUR1. Because the frameshift mutants of WWM1 and PMR1 displayed increased CNLs, we concluded that these genes were responsible for the low CNLs. The result for YGL167C is shown in Supplemental Figure S7A as an example. (2) Because both clones containing one of the two neighboring genes (YNL024C-A/KSH1–YNL025C/SSN8) exhibited low CNLs but the frameshift mutations did not increase the CNL of either gene (Supplemental Fig. S7B), we concluded that an RNA gene (NME1) caused the low limits. (3) For genes for which the frameshift mutations did not increase their CNLs but the cause could not be ascertained from their genome annotations, we segmented the fragments into 5′ UTR and ORF-3′ UTR fragments and measured their limits (Fig. 4A). Both the 5′ and 3′ segmented fragments of CPS1, FHL1, GRX3, HOM3, TPK1, and TPK3 (underlined in blue in Fig. 4C) displayed increased copy numbers. These ORFs may have been expressed from ATGs other than the annotated ones. (4) The segmented fragments (ORF-3′ UTR) of ASE1, DIE2, IRC8, and SFP1 did not exhibit increased CNLs (underlined in red, Fig. 4C). For DIE2 and IRC8, we performed additional segmentation analysis (Supplemental Fig. S8). The 3′ regions of both genes had elements causing the low limits, although their functions are still unknown (Supplemental Fig. S8).
By use of the aforementioned analysis, we isolated 115 DSGs by removing the overlapping genes (AUA1 and HUR1), the RNA gene (NME1), the genes for which their low limits were not caused by their annotated ORFs (DIE2 and IRC8), and a real-time PCR reference gene (LEU3) from the list of genes with CNLs of 10 or less (Fig. 2; Supplemental Table S5). Among the yeast DSGs, 88 genes were previously isolated in screenings of genes causing toxicity upon overexpression by promoter swapping (Liu et al. 1992; Espinet et al. 1995; Akada et al. 1997; Stevenson et al. 2001; Boyer et al. 2004; Gelperin et al. 2005; Sopko et al. 2006; Niu et al. 2008; Yoshikawa et al. 2011). According to the Saccharomyces Genome Database (SGD; http://www.yeastgenome.org), the overexpression of ∼1900 genes was reported to cause lethality or decreased cell growth. This study isolated another set of genes causing growth defects after only a minor increase in copy number (overexpression relative to the native level). Jones et al. (2008) created a comprehensive overlap DNA library of the S. cerevisiae genome using a 2-micron–based multicopy vector. They tested the toxicity of each clone to yeast cells and identified 23 toxic DNA segments. We can assume that the yeast DSGs isolated in our study are responsible for the toxicity of the DNA segments. In total, 12 of the 23 toxic clones actually contained DSGs isolated in this study (Supplemental Table S6). At present, it is unclear why clones without yeast DSGs are toxic. The toxicities of these clones might be explained by the additive effect of weak DSGs within the same clone, or we may have failed to clone the promoters of target genes that were present beyond the neighboring genes.
We next analyzed the characteristics of isolated DSGs (Table 1). DSGs significantly contain protein complex members, proteins with many interaction partners, and proteins containing higher intrinsic disordered regions. Although it was not significant, the percentage of essential genes among yeast DSGs was higher than that within the entire genome. DSGs also tended to be highly expressed (P = 4.696 × 10⁻⁶ in the Mann-Whitney U-test) (Supplemental Fig. S9), as did the 786 low limit genes (Fig. 3B). Yeast DSGs contain significantly higher percentages of genes in the gene ontology categories of cytoskeletal organization and intracellular transport (Table 2), whereas transcription factors and signaling molecules (protein kinase and phosphatase) were not concentrated (data not shown). Figure 5 presents a gene network constituted according to the functional category of each gene and their physical (protein–protein and protein–DNA) interactions that were described in SGD.
Table 2.
Gene Ontology analysis of yeast DSGs
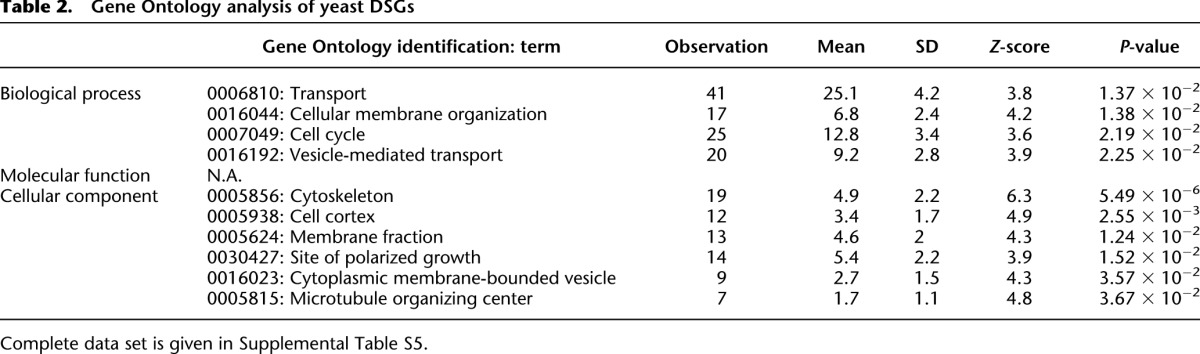
Figure 5.
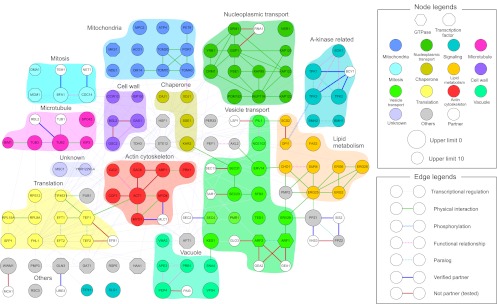
Molecular interactions between DSGs. Yeast DSGs were colored according to their functional category annotated in the Saccharomyces Genome Database (SGD). Genes were connected by their protein–protein interactions (solid lines), functional relationships (dotted lines), and protein–DNA interactions (thin lines). The interaction data were obtained from BioGRID (http://thebiogrid.org/). White-colored genes and bold lines denote the candidate partners and their interactions experimentally tested by 2D-gTOW, respectively (Fig. 7; Supplemental Figs. S11, S12; Table 3; Supplemental Table S7). The network was created using Cytoscape 2.8.1 (http://www.cytoscape.org/) and modified using Illustrator CS5 (Adobe) and PowerPoint 2011 (Microsoft).
Protein burden causes dosage sensitivity
The fact that DSGs tended to be highly expressed suggests that the increased copy number of a highly expressed gene exerts a burden on protein turnover (Stoebel et al. 2008; Sheltzer and Amon 2011), which causes the dosage sensitivities of yeast DSGs. We thus selected six highly expressed genes (Partow et al. 2010) and replaced each ORF with the green fluorescent protein (GFP) (Fig. 6A; Cormack et al. 1997). TEF1 and TDH3 were the DSGs isolated in this study. If the overproduction of an unnecessary protein, but not the specific function of the protein, determines the limit of a gene, then the copy number of the artificial gene should also be limited. As shown in Figure 6B, five out of six GFP constructs exhibited significantly lower limits compared with the vector control (P < 0.05, Student's t-test); moreover, the CNLs (the copy numbers under the −Leu−Ura condition) of native and GFP replaced genes were highly correlated (Pearson's correlation = 0.90) (Fig. 6C). In addition, acceleration of GFP degradation by adding a degradation signal (Fig. 6A; Jungbluth et al. 2010) further reduced the CNLs (Fig. 6B) and increased the correlation (Pearson's correlation = 0.94) (Fig. 6D), indicating that the accumulated GFP itself does not cause gene toxicity. These observations suggest that a minor increase in the copy number of highly expressed genes causes a protein turnover burden that leads to dosage sensitivity. If the protein expressed from the gene is unstable, then the dosage sensitivity could be accelerated because of the increased protein turnover burden.
Figure 6.
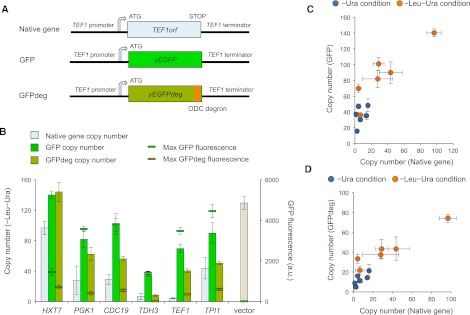
Protein burden causes dosage sensitivity. (A) Plasmid constructs to examine the protein burden. TEF1 is shown as an example of highly expressed target genes. We constructed these artificial genes using pTOW40836, introduced the plasmids into yeast strain BY4741, and then measured the upper CNLs and the maximal GFP fluorescence. ODC degron indicates the degron from the mouse ornithine decarboxylase gene (Jungbluth et al. 2010). (B) CNLs of native and GFP replaced genes. The gene names on the horizontal axis indicate that their ORFs were replaced by GFP, as shown in A. (C) Comparison of the copy numbers of native- and GFP-replaced genes. (D) Comparison of the copy numbers of native- and GFPdeg-replaced genes.
Dosage imbalance causes dosage sensitivity
Although protein burden causes the dosage sensitivities of some DSGs as demonstrated in this study, it is apparently not the only mechanism to explain the dosage sensitivities of all yeast DSGs, because the upper limit of native TEF1, e.g., was far lower than that of the GFP construct (Fig. 6B), and some yeast DSGs encoded lowly expressed proteins (Supplemental Fig. S10). As indicated above, protein complex components were highly concentrated among yeast DSGs (Table 1). It is thus possible that stoichiometric imbalance (Papp et al. 2003; Torres et al. 2007; Veitia and Birchler 2010) is another mechanism leading to the dosage sensitivities of yeast DSGs. Ohnologs are genes created by ancient whole-genome duplication events and are retained in the genome. Previous studies and we proposed that they are dosage balanced (Veitia et al. 2008; Makino and McLysaght 2010). Thus, we compared the yeast DSGs and ohnologs and found that they overlapped significantly (Table 1; Supplemental Table S5). This also supports the idea that dosage imbalance causes the dosage sensitivity of DSGs. In fact, we previously demonstrated that the dosage sensitivity of one DSG, CDC14, arose from a dosage imbalance against NET1 (Kaizu et al. 2010). We also demonstrated a similar dosage balance between the GTPase gene spg1 and its GAP byr4 in fission yeast (Moriya et al. 2011).
To test the assumption that stoichiometry imbalance causes the toxicity of DSGs, we attempted to identify DSGs that are dosage balanced with their partner genes. We first created a list of potential dosage partners for DSGs using information about protein–protein interactions and their functional effects described in SGD (Supplemental Table S7). We then performed a series of experiments that examined whether the partner candidate could rescue the toxicity of individual DSGs as shown in Figure 7. A gTOW plasmid carrying DSG and another plasmid (pRS423ks) with the candidate partner were simultaneously introduced into yeast cells, and the cells were then grown under −Ura and −Leu−Ura conditions (Fig. 7A). If the candidate is the partner, then the toxicity of DSG is rescued and the cells can grow on −Leu−Ura plates. If both DSG and the partner are in dosage balance, then the copy numbers of both genes in survived cells must be conserved. The case of GLN3 (DSG) and URE2 (candidate partner) is shown as an example in Figure 7, B, C, and D. Among the 49 pairs tested, 13 were demonstrated to be in dosage balance (Supplemental Table S7; Supplemental Figs. S11, S12). We note that previously suggested dosage balance between tubulin genes TUB2 and TUB1 (Weinstein and Solomon 1990) were hardly detected in our experiment, and we detected the one between TUB2 and RBL2 (Supplemental Fig. S13). Analyzed interactions and confirmed dosage-balanced interactions are indicated by bold lines and blue bold lines in Figure 5, respectively. We thus concluded that dosage imbalance was a cause of the dosage sensitivity of at least some yeast DSGs.
Figure 7.
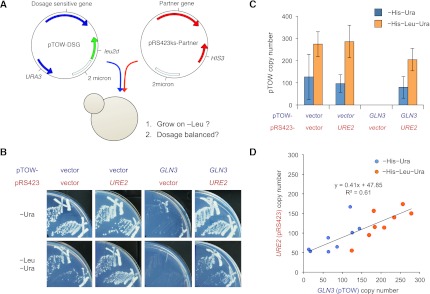
Testing dosage balance between DSGs and their candidate partners. (A) The experimental design of 2D-gTOW to determine whether two genes are dosage partners (Kaizu et al. 2010). First, we transformed a yeast strain with two plasmids expressing DSG and its candidate partner and then tested whether the transformant could grow under the −Leu condition and whether both the plasmids were balanced. (B,C,D) Examples of 2D-gTOW experiments with GLN3 (DSG) and its partner URE2. (B) Plate assay: High copy URE2 supports the growth of yeast cells with high-copy GLN3. (C) Copy numbers of pTOW-GLN3 and pRS423ks-URE2 under the low-copy (−His−Ura) and high-copy (−His−Leu−Ura) conditions. (D) The copy numbers of GLN3 and URE2 in 2D-gTOW experiments are balanced. Other experimental results can be found in Supplemental Figures S11, S12, and S13.
Discussion
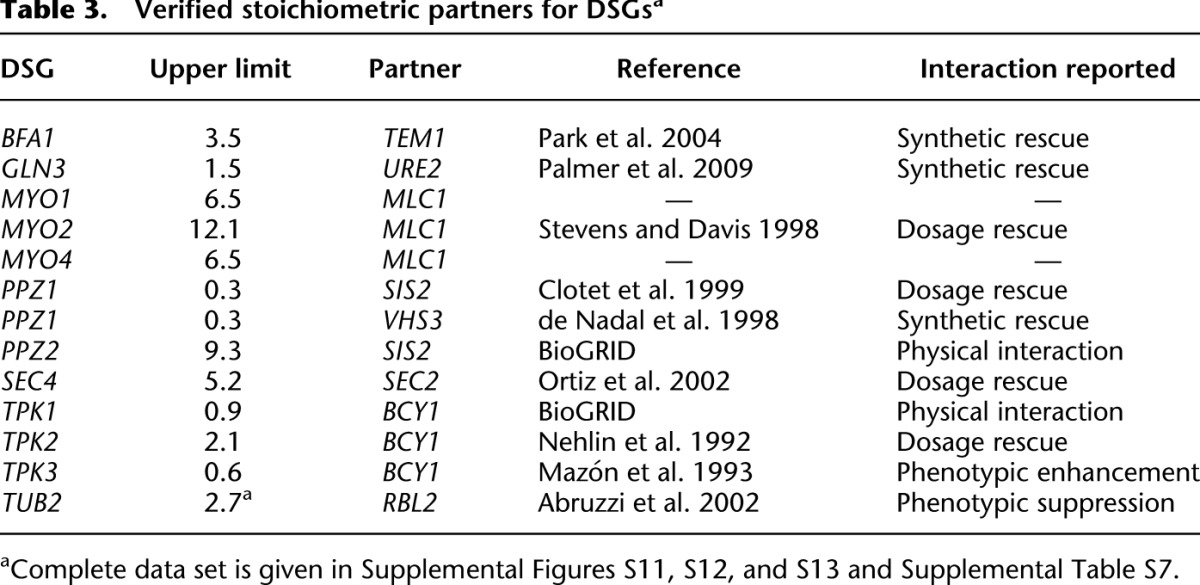
In this study, we applied gTOW to measure the CNLs of overexpression of nearly all protein-coding genes in S. cerevisiae and identified 115 DSGs with CNLs of 10 or less. From the characteristics of the genes (e.g., they tended to be highly expressed and complex members), we speculated that protein burden and stoichiometry imbalance caused the dosage sensitivity of these genes. We further experimentally verified the hypothesis using gTOW experiments. The results indicated that there are at least two different causes of dosage sensitivity: specific and nonspecific causes related to gene function. We currently think that for some DSGs, the dosage imbalance by itself causes severe dosage sensitivities. We have isolated some DSGs where the dosage sensitivities were suppressed by the simultaneous overexpressions of their partners (Table 3). The copy numbers of these DSGs can increase (their proteins are further overexpressed) when their partners are abundant, and hence, their protein turnover does not appear to cause their dosage sensitivities.
Table 3.
Verified stoichiometric partners for DSGsa
Disomy of any of the 16 S. cerevisiae chromosomes causes cellular growth defects resulting from the overexpression of particular genes on the disomic chromosome (Torres et al. 2007). Several possible mechanisms by which aneuploidy can cause cellular dysfunction have been proposed (Sheltzer and Amon 2011). Because disomy causes the duplication of all genes on the chromosome, it is difficult to identify specific genes, and consequently the specific mechanisms, causing dosage sensitivity. The mechanisms causing dosage sensitivity that were inspected in this study should have some shared features with aneuploidy.
Although we focused on DSGs in this study, yeast cellular systems were robust against ∼100-fold overexpression in >80% of their genes (Fig. 2). According to the characteristics of DSGs found in this study, genes with low expression without dosage balance were conversely considered dosage insensitive. Genes with tightly controlled expression or enzymes with regulation that is not subunit dependent (e.g., regulated by intramolecular interactions) will be robust against copy number increase. The domain organization of proteins, e.g., a catalytic domain and a regulatory domain in the same protein, could have evolved to avoid dosage sensitivity.
Why do DSGs remain in the present yeast genome? In addition, why have not cellular systems evolved to avoid the existence of DSGs? One possibility is that dosage sensitivity has its own important function; if DSGs and their dosage partners are reasonably scattered around chromosomal regions, then they will constitute a dosage balance network (the network identified in this study is shown in Fig. 8). This network potentially constrains and secures the composition of an organism's chromosomes because chromosomal abbreviation in a cell disrupts the balance within the network, which reduces the fitness of the cell. The reason why the genomic composition of current organisms is stable could be that the dosage balance network functions as a sentinel of abnormality. This could explain how and why the eukaryotic chromosomes were established and maintained during evolution in a relatively stable manner. If our hypothesis is true, the DSGs and their partners should be located on different chromosomes. In S. cerevisiae, all the DSGs and their partners identified in this study were actually distributed on different chromosomes (Fig. 8). Analyzing the distributions of DSGs and their partners in species related to S. cerevisiae (before and after genome duplication) is one way of obtaining further evidence for this hypothesis.
Figure 8.

Intrachromosomal interactions connected with DSGs and their partner genes. Locations of DSGs and their partner genes and their interactions identified in this study are visualized using Circos software (Krzywinski et al. 2009). The locations of 115 yeast DSGs are also shown.
Methods
Strains, growth conditions, and yeast transformation
S. cerevisiae strain BY4741 (MATa his3Δ1 leu2Δ0 met15Δ0 ura3Δ0) (Brachmann et al. 1998) was used for gTOW6000 analysis. Yeast cultivation and transformation were performed as previously described (Amberg et al. 2005). Synthetic complete (SC) medium without indicated amino acids were used for the cultivation of yeast.
Plasmids used in this study
pTOWug2-836 (Supplemental Fig. S1; Moriya et al. 2012) was used for gTOW6000 analysis. pTOW40836 (a pTOWug2-836 derivative but it does not contain the GFP gene in the backbone) (Moriya et al. 2012), was used for the GFP replacement experiments in Figure 6. pRS423ks, which was used to clone partner genes for two-dimensional gTOW experiments, is a derivative of pRS423 (Christianson et al. 1992), and it has two additional primer sites outside the multicloning site (indicated as K_primer and S_primer in Supplemental Fig. S14). The K and S priming sites allowed us to selectively amplify the insert of pRS423ks from the cells harboring pTOW and pRS423ks. gTOW6000 plasmid clones were constructed as described below. The plasmids used for the frameshift analysis, the segmentation analysis, and the GFP replacement analysis were constructed as shown in Supplemental Figures S15, S16, and S17, respectively. Primer sequences used to construct the gTOW6000 plasmids are listed in Supplemental Table S8. Other primer sequences are available upon request. Individual plasmid in gTOW6000 is available from National BioResource Project-Yeast (http://yeast.lab.nig.ac.jp/).
PCR
All DNA fragments were amplified by PCR using the high-fidelity DNA polymerase KODplus (Toyobo) according to the method described in the manufacturer's protocol.
DNA extraction and determination of the plasmid copy number
DNA samples were prepared according to the method described previously (Moriya et al. 2006). The copy numbers of pTOWug2-836, pTOW40836 and pRS423ks were measured using real-time PCR according to the method described previously (Moriya et al. 2006; Kaizu et al. 2010) using Lightcycler480 (Roche). LEU2 (LEU2-2F: 5′-GCTAATGTTTTGGCCTCTTC-3′; LEU2-2R: 5′-ATTTAGGTGGGTTGGGTTCT-3′) and HIS3 primer sets (HIS3-1F: 5′-TTCCGGCTGGTCGCTAAT-3′; HIS3-1R: 5′-GCGCAAATCCTGATCCAAAC-3′) were used to measure the copy numbers of pTOW vectors and pRS423ks, respectively. The LEU3 primer set (LEU3-3F: 5′-CAGCAACTAAGGACAAGG-3′; LEU3-3R: 5′-GGTCGTTAATGAGCTTCC-3′) was used to amplify the genomic DNA. Because we used LEU3 as a reference gene for the genome in the copy number determination using real-time PCR, the calculated CNL of LEU3 is always one.
Measuring GFP fluorescence
GFP fluorescence of cell culture was measured using Infinite F200 microplate reader (TECAN)
Construction of gTOW6000 clones and the analysis
The entire scheme of gTOW6000 analysis is shown in Figure 1. The gTOW6000 analysis was separated into eight steps as follows.
Design primers to amplify each target gene (step1), and amplify the target genes using PCR (step 2)
In this study, we attempted to analyze all protein-coding genes on the S. cerevisiae chromosome. To clone all genes with their regulatory regions for “Characterized” and “Uncharacterized” ORFs, we amplified a DNA fragment containing each target ORF with upstream and downstream regions spanning the neighboring ORFs. We ignored “Dubious ORF,” autonomous replicating sequence (ARS), and other RNA elements. Supplemental Figure S2A presents an example of the analysis. Each region shown in blue was cloned into individual pTOW plasmids. It is thus possible that the plasmid CNL is determined by the effect of non-ORF elements within each clone instead of the cloned protein-coding genes. This possibility will be solved using a frameshift mutation analysis, as described in another section. Supplemental Figure S2B shows the design of the primers used to amplify the regions containing target genes by PCR. The primers consist of 23-bp priming sequences of the neighboring ORFs and 25-bp adaptor sequences of the vector for gap-repair cloning. The adaptor sequences of the up primer and the down primer were 5′-cggccgctctagaactagtGGATCC…-3′ and 5′-attgggtaccgggccccccCTCGAG…-3′, respectively. The sequences shown in capital letters in the up and down primer sequences are the BamHI and XhoI sites, respectively. The primer sequences of pTOWug2-836 are shown in Supplemental Figure S1B. According to the annotation of SGD (released on July 28, 2007), primers for amplifying 5806 genes were designed using a Perl script. Each gene was amplified by PCR using each primer set and the BY4741 genome as a template (first PCR). Via PCR, 98.4% of the obtained PCR products had the correct size. For the genes for which we could not obtain PCR products, we redesigned the primers. If the distance to the neighboring gene was too large, then we shortened the length of the noncoding region to 1 kb. If the target ORF was too large, we designed primers as listed in Supplemental Table S9 to amplify segments of the gene and connected the segments by gap repair (see below). We thus redesigned primers for 90 genes. The primer sets for genes next to each of the 16 centromeres were first designed to ensure that the amplified fragments contain the centromeres. As expected, all 32 of the DNA fragments containing centromeres expressed one copy of the gTOW plasmid per cell (data not shown). We thus redesigned primers to remove the centromeres.
Transformation (gap-repair cloning; step 3) and selecting two independent clones for each gene (step 4)
The PCR products amplified using the aforementioned primers and pTOWug2-836 digested with BamHI and XhoI were simultaneously introduced into BY4741 yeast cells. Each gene was inserted via the homologous recombination activity of yeast cells (gap-repair cloning) (Oldenburg et al. 1997). Each transformed colony contained plasmids with an insert of the same target gene but an independent PCR product (or self-ligated plasmids without any insert). Two independent colonies (clones) were thus selected and cultivated in SC medium without uracil (SC–Ura).
Measurement of growth (step 5) and measurement of plasmid copy numbers (step 6)
Each clone was cultivated as described in step 4 in both SC–Ura and SC–Leu–Ura at 30°C. The max growth rate of the clone cultivated in SC–Leu–Ura was measured according to the method described previously (Moriya et al. 2006). Strains for which no growth was observed were assigned a growth rate of 0.1 for descriptive purposes. After 50 h of cultivation, the plasmid copy number in the cultured cells was measured. From the principle of gTOW, the plasmid copy number determined in –Leu–Ura condition is considered to be the CNL of overexpression of each target gene.
Validation of the inserts by PCR (Step 7)
The insert of each clone was examined by PCR (insert-check PCR; icPCR) using primers OSBI0873 (5′-GGCGAAAGGGGGATGTGCTG-3′) and OSBI0870 (5′-GGAAAGCGGGCAGTGAGCGC-3′) (Supplemental Fig. S1B). The size of the insert was determined using Agarose gel electrophoresis. We validated the icPCR products to ensure that the target genes were correctly cloned as follows: “NI” meant the PCR product was the same size as the vector (No-Insert). In this case, we considered that the cloning was unsuccessful, and we did not adopt the max growth rate and copy number data. “N” meant No PCR product was amplified. “W” meant the PCR product had the wrong size (different from the expected size). “D” meant two PCR products were amplified. One of them had the expected size. In these cases, we adopted the max growth rate and copy number data because it was possible that there were problems with icPCR (e.g., the target was too large). We obtained two independent clones for 88.9% of the genes in the first cycle.
Isolation of missing clones (step 8)
For genes for which we could not obtain two clones in step 7, we redesigned primers as described in step 1 or selected more colonies as described in step 4. We finally obtained two clones for 5548 genes (95.6%) and one clone for 203 genes (3.5%). We could not obtain any positive clones for 55 genes (5.5%).
Genes that were difficult to clone
We could not obtain any positive clones for YFL037W/TUB2 and YFL039C/ACT1, probably because they are too toxic. We thus made plasmids with those genes in Escherichia coli and confirmed that they were too toxic for the transformants to form colonies (data not shown). We thus concluded that they were very low limit genes. In addition, for TUB2, we created a promoter-deletion series and obtained a TUB2 allele with a 100-bp promoter (tub2d-100, its CNL was 2.7). We thus used these data for TUB2. As mentioned above, we could not obtain any clones for 55 genes. Approximately half of them were retrotransposons and helicases encoded near telomeres.
Acknowledgments
We thank Yuki Shimizu-Yoshida (Sony CSL), Kazunari Kaizu (Riken), Ayako Chino, and Masataka Sasabe (Okayama University) for valuable discussions about this work, and Naomi Fujimoto (ERATO Kawaoka Project, JST) and Kazuko Matsubara (Keio University, Medical School) for their experimental support. This work was supported in part by the ERATO-SORST Kitano Symbiotic Systems Project of the Systems Biology Institute, the PRESTO program of the Japan Science and Technology Agency, the Special Coordination Fund for Promoting Sciences and Technology, Grants-in-Aid for Scientific Research (B), and Grants-in-Aid for Scientific Research on Innovative Areas of the Ministry of Education, Culture, Sports, Science, and Technology.
Author contributions: K.M. mainly performed the gTOW6000 experiments. R.K. performed the partner-seeking experiments. T.M. performed bioinformatics analysis. H.K. supervised the project. H.M. mainly designed the experiments, analyzed the data, and wrote the paper.
Footnotes
[Supplemental material is available for this article.]
Article published online before print. Article, supplemental material, and publication date are at http://www.genome.org/cgi/doi/10.1101/gr.146662.112.
Freely available online through the Genome Research Open Access option.
References
- Abruzzi KC, Smith A, Chen W, Solomon F 2002. Protection from free β-tubulin by the β-tubulin binding protein Rbl2p. Mol Cell Biol 22: 138–147 [DOI] [PMC free article] [PubMed] [Google Scholar]
- Akada R, Yamamoto J, Yamashita I 1997. Screening and identification of yeast sequences that cause growth inhibition when overexpressed. Mol Gen Genet 254: 267–274 [DOI] [PubMed] [Google Scholar]
- Alon U, Surette MG, Barkai N, Leibler S 1999. Robustness in bacterial chemotaxis. Nature 397: 168–171 [DOI] [PubMed] [Google Scholar]
- Amberg DC, Burke D, Strathern JN 2005. Methods in yeast genetics: A Cold Spring Harbor Laboratory Course Manual. Cold Spring Harbor Laboratory Press, New York [Google Scholar]
- Boyer J, Badis G, Fairhead C, Talla E, Hantraye F, Fabre E, Fischer G, Hennequin C, Koszul R, Lafontaine I, et al. 2004. Large-scale exploration of growth inhibition caused by overexpression of genomic fragments in Saccharomyces cerevisiae. Genome Biol 5: R72. [DOI] [PMC free article] [PubMed] [Google Scholar]
- Brachmann CB, Davies A, Cost GJ, Caputo E, Li J, Hieter P, Boeke JD 1998. Designer deletion strains derived from Saccharomyces cerevisiae S288C: A useful set of strains and plasmids for PCR-mediated gene disruption and other applications. Yeast 14: 115–132 [DOI] [PubMed] [Google Scholar]
- Christianson TW, Sikorski RS, Dante M, Shero JH, Hieter P 1992. Multifunctional yeast high-copy-number shuttle vectors. Gene 110: 119–122 [DOI] [PubMed] [Google Scholar]
- Clotet J, Garí E, Aldea M, Ariño J 1999. The yeast ser/thr phosphatases sit4 and ppz1 play opposite roles in regulation of the cell cycle. Mol Cell Biol 19: 2408–2415 [DOI] [PMC free article] [PubMed] [Google Scholar]
- Cormack BP, Bertram G, Egerton M, Gow NA, Falkow S, Brown AJ 1997. Yeast-enhanced green fluorescent protein (yEGFP): A reporter of gene expression in Candida albicans. Microbiology 143: 303–311 [DOI] [PubMed] [Google Scholar]
- Dekel E, Alon U 2005. Optimality and evolutionary tuning of the expression level of a protein. Nature 436: 588–592 [DOI] [PubMed] [Google Scholar]
- de Nadal E, Clotet J, Posas F, Serrano R, Gomez N, Ariño J 1998. The yeast halotolerance determinant Hal3p is an inhibitory subunit of the Ppz1p Ser/Thr protein phosphatase. Proc Natl Acad Sci 95: 7357–7362 [DOI] [PMC free article] [PubMed] [Google Scholar]
- Espinet C, de la Torre MA, Aldea M, Herrero E 1995. An efficient method to isolate yeast genes causing overexpression-mediated growth arrest. Yeast 11: 25–32 [DOI] [PubMed] [Google Scholar]
- Gelperin DM, White MA, Wilkinson ML, Kon Y, Kung LA, Wise KJ, Lopez-Hoyo N, Jiang L, Piccirillo S, Yu H, et al. 2005. Biochemical and genetic analysis of the yeast proteome with a movable ORF collection. Genes Dev 19: 2816–2826 [DOI] [PMC free article] [PubMed] [Google Scholar]
- Ghaemmaghami S, Huh WK, Bower K, Howson RW, Belle A, Dephoure N, O'Shea EK, Weissman JS 2003. Global analysis of protein expression in yeast. Nature 425: 737–741 [DOI] [PubMed] [Google Scholar]
- Jones GM, Stalker J, Humphray S, West A, Cox T, Rogers J, Dunham I, Prelich G 2008. A systematic library for comprehensive overexpression screens in Saccharomyces cerevisiae. Nat Methods 5: 239–241 [DOI] [PubMed] [Google Scholar]
- Jungbluth M, Renicke C, Taxis C 2010. Targeted protein depletion in Saccharomyces cerevisiae by activation of a bidirectional degron. BMC Syst Biol 4: 176. [DOI] [PMC free article] [PubMed] [Google Scholar]
- Kaizu K, Moriya H, Kitano H 2010. Fragilities caused by dosage imbalance in regulation of the budding yeast cell cycle. PLoS Genet 6: e1000919. [DOI] [PMC free article] [PubMed] [Google Scholar]
- Krantz M, Ahmadpour D, Ottosson LG, Warringer J, Waltermann C, Nordlander B, Klipp E, Blomberg A, Hohmann S, Kitano H 2009. Robustness and fragility in the yeast high osmolarity glycerol (HOG) signal-transduction pathway. Mol Syst Biol 5: 281. [DOI] [PMC free article] [PubMed] [Google Scholar]
- Krzywinski M, Schein J, Birol I, Connors J, Gascoyne R, Horsman D, Jones SJ, Marra MA 2009. Circos: An information aesthetic for comparative genomics. Genome Res 19: 1639–1645 [DOI] [PMC free article] [PubMed] [Google Scholar]
- Little JW, Shepley DP, Wert DW 1999. Robustness of a gene regulatory circuit. EMBO J 18: 4299–4307 [DOI] [PMC free article] [PubMed] [Google Scholar]
- Liu H, Krizek J, Bretscher A 1992. Construction of a GAL1-regulated yeast cDNA expression library and its application to the identification of genes whose overexpression causes lethality in yeast. Genetics 132: 665–673 [DOI] [PMC free article] [PubMed] [Google Scholar]
- Makino T, McLysaght A 2010. Ohnologs in the human genome are dosage balanced and frequently associated with disease. Proc Natl Acad Sci 107: 9270–9274 [DOI] [PMC free article] [PubMed] [Google Scholar]
- Mazón MJ, Behrens MM, Morgado E, Portillo F 1993. Low activity of the yeast cAMP-dependent protein kinase catalytic subunit Tpk3 is due to the poor expression of the TPK3 gene. Eur J Biochem 213: 501–506 [DOI] [PubMed] [Google Scholar]
- Moriya H, Shimizu-Yoshida Y, Kitano H 2006. In vivo robustness analysis of cell division cycle genes in Saccharomyces cerevisiae. PLoS Genet 2: e111. [DOI] [PMC free article] [PubMed] [Google Scholar]
- Moriya H, Chino A, Kapuy O, Csikász-Nagy A, Novák B 2011. Overexpression limits of fission yeast cell-cycle regulators in vivo and in silico. Mol Syst Biol 7: 556. [DOI] [PMC free article] [PubMed] [Google Scholar]
- Moriya H, Makanae K, Watanabe K, Chino A, Shimizu-Yoshida Y 2012. Robustness analysis of cellular systems using the genetic tug-of-war method. Mol Biosyst 8: 2513–2522 [DOI] [PubMed] [Google Scholar]
- Nehlin JO, Carlberg M, Ronne H 1992. Yeast SKO1 gene encodes a bZIP protein that binds to the CRE motif and acts as a repressor of transcription. Nucleic Acids Res 20: 5271–5278 [DOI] [PMC free article] [PubMed] [Google Scholar]
- Niu W, Li Z, Zhan W, Iyer VR, Marcotte EM 2008. Mechanisms of cell cycle control revealed by a systematic and quantitative overexpression screen in S. cerevisiae. PLoS Genet 4: e1000120. [DOI] [PMC free article] [PubMed] [Google Scholar]
- Oldenburg KR, Vo KT, Michaelis S, Paddon C 1997. Recombination-mediated PCR-directed plasmid construction in vivo in yeast. Nucleic Acids Res 25: 451–452 [DOI] [PMC free article] [PubMed] [Google Scholar]
- Ortiz D, Medkova M, Walch-Solimena C, Novick P 2002. Ypt32 recruits the Sec4p guanine nucleotide exchange factor, Sec2p, to secretory vesicles; evidence for a Rab cascade in yeast. J Cell Biol 157: 1005–1015 [DOI] [PMC free article] [PubMed] [Google Scholar]
- Palmer LK, Baptiste BA, Fester JC, Perkins JC, Keil RL 2009. RRD1, a component of the TORC1 signalling pathway, affects anaesthetic response in Saccharomyces cerevisiae. Yeast 26: 655–661 [DOI] [PubMed] [Google Scholar]
- Papp B, Pál C, Hurst LD 2003. Dosage sensitivity and the evolution of gene families in yeast. Nature 424: 194–197 [DOI] [PubMed] [Google Scholar]
- Park JE, Park CJ, Sakchaisri K, Karpova T, Asano S, McNally J, Sunwoo Y, Leem SH, Lee KS 2004. Novel functional dissection of the localization-specific roles of budding yeast polo kinase Cdc5p. Mol Cell Biol 24: 9873–9886 [DOI] [PMC free article] [PubMed] [Google Scholar]
- Partow S, Siewers V, Bjørn S, Nielsen J, Maury J 2010. Characterization of different promoters for designing a new expression vector in Saccharomyces cerevisiae. Yeast 27: 955–964 [DOI] [PubMed] [Google Scholar]
- Sheltzer JM, Amon A 2011. The aneuploidy paradox: Costs and benefits of an incorrect karyotype. Trends Genet 27: 446–453 [DOI] [PMC free article] [PubMed] [Google Scholar]
- Sopko R, Huang D, Preston N, Chua G, Papp B, Kafadar K, Snyder M, Oliver SG, Cyert M, Hughes TR, et al. 2006. Mapping pathways and phenotypes by systematic gene overexpression. Mol Cell 21: 319–330 [DOI] [PubMed] [Google Scholar]
- Stevens RC, Davis TN 1998. Mlc1p is a light chain for the unconventional myosin Myo2p in Saccharomyces cerevisiae. J Cell Biol 142: 711–722 [DOI] [PMC free article] [PubMed] [Google Scholar]
- Stevenson LF, Kennedy BK, Harlow E 2001. A large-scale overexpression screen in Saccharomyces cerevisiae identifies previously uncharacterized cell cycle genes. Proc Natl Acad Sci 98: 3946–3951 [DOI] [PMC free article] [PubMed] [Google Scholar]
- Stoebel DM, Dean AM, Dykhuizen DE 2008. The cost of expression of Escherichia coli lac operon proteins is in the process, not in the products. Genetics 178: 1653–1660 [DOI] [PMC free article] [PubMed] [Google Scholar]
- Torres EM, Sokolsky T, Tucker CM, Chan LY, Boselli M, Dunham MJ, Amon A 2007. Effects of aneuploidy on cellular physiology and cell division in haploid yeast. Science 317: 916–924 [DOI] [PubMed] [Google Scholar]
- Vavouri T, Semple JI, Garcia-Verdugo R, Lehner B 2009. Intrinsic protein disorder and interaction promiscuity are widely associated with dosage sensitivity. Cell 138: 198–208 [DOI] [PubMed] [Google Scholar]
- Veitia RA, Birchler JA 2010. Dominance and gene dosage balance in health and disease: Why levels matter! J Pathol 220: 174–185 [DOI] [PubMed] [Google Scholar]
- Veitia RA, Bottani S, Birchler JA 2008. Cellular reactions to gene dosage imbalance: Genomic, transcriptomic and proteomic effects. Trends Genet 24: 390–397 [DOI] [PubMed] [Google Scholar]
- von Dassow G, Meir E, Munro EM, Odell GM 2000. The segment polarity network is a robust developmental module. Nature 406: 188–192 [DOI] [PubMed] [Google Scholar]
- Wagner A 2005. Energy constraints on the evolution of gene expression. Mol Biol Evol 22: 1365–1374 [DOI] [PubMed] [Google Scholar]
- Weinstein B, Solomon F 1990. Phenotypic consequences of tubulin overproduction in Saccharomyces cerevisiae: Differences between α-tubulin and β-tubulin. Mol Cell Biol 10: 5295–5304 [DOI] [PMC free article] [PubMed] [Google Scholar]
- Yoshikawa K, Tanaka T, Ida Y, Furusawa C, Hirasawa T, Shimizu H 2011. Comprehensive phenotypic analysis of single-gene deletion and overexpression strains of Saccharomyces cerevisiae. Yeast 28: 349–361 [DOI] [PubMed] [Google Scholar]
- Zaslaver A, Mayo AE, Rosenberg R, Bashkin P, Sberro H, Tsalyuk M, Surette MG, Alon U 2004. Just-in-time transcription program in metabolic pathways. Nat Genet 36: 486–491 [DOI] [PubMed] [Google Scholar]