

Abstract
Comparisons of gene trees and species trees are key to understanding major processes of genome evolution such as gene duplication and loss. Because current methods to reconstruct phylogenies fail to model the two-way dependency between gene trees and the species tree, they often misrepresent gene and species histories. We present a new probabilistic model to jointly infer rooted species and gene trees for dozens of genomes and thousands of gene families. We use simulations to show that this method accurately infers the species tree and gene trees, is robust to misspecification of the models of sequence and gene family evolution, and provides a precise historic record of gene duplications and losses throughout genome evolution. We simultaneously reconstruct the history of mammalian species and their genes based on 36 completely sequenced genomes, and use the reconstructed gene trees to infer the gene content and organization of ancestral mammalian genomes. We show that our method yields a more accurate picture of ancestral genomes than the trees available in the authoritative database Ensembl.
The reconstruction of gene phylogenies based on sequences alone is difficult. First, homologous sequences are often hard to align unambiguously (Wong et al. 2008), which leads to incorrect gene trees and erroneous predictions of events of duplications and losses. Second, sequence alignments generally contain insufficient information to accurately model gene evolution and thus understand their history, as suggested by the positive correlation found between sequence length and congruence to the species tree (Galtier 2007). However, knowing the relationships among the species in which these sequences have evolved can improve gene tree inference. Several methods have successfully implemented this idea by combining sequence evolution models with a model of gene evolution that accounts for duplication and loss (DL) (Vilella et al. 2008; Akerborg et al. 2009; Flicek et al. 2010; Rasmussen and Kellis 2010, 2012). Provided the species tree is known, these methods yield significantly better gene trees than other molecular phylogenetic methods. However, because reference species trees themselves generally rely on molecular data, they can be also affected by phylogenetic reconstruction uncertainties and unidentified events of gene duplication and loss. This reveals a circular problem: the reconstruction of a species tree requires identifying events of gene family evolution such as DLs, and both the reconstruction of gene trees and the identification of duplications and losses requires a known species tree. The solution to the conundrum is to explicitly consider this two-way dependence and jointly reconstruct the species phylogeny and the histories of all gene families present in their genomes.
The coestimation of gene and species trees requires that several gene families be analyzed simultaneously. This represents a significant departure from existing methods (Vilella et al. 2008; Akerborg et al. 2009; Flicek et al. 2010; Rasmussen and Kellis 2010, 2012) that analyze one gene family at a time, but is similar in principle to methods that jointly estimate the species tree and gene trees using coalescent models (Liu and Pearl 2007; Heled and Drummond 2010). However, while these methods use models of incomplete lineage sorting and a Bayesian MCMC algorithm not targeted at genome-scale data sets, the study of genome and gene family evolution requires using a model of gene DL, and algorithms able to handle virtually the complete repertoire of genes present in these species. Coestimating genes and species trees with a model of DL in a maximum likelihood framework provides an opportunity to obtain accurate estimates of the species tree and of the DL parameters based on large amounts of data from complete genome sequences that are becoming increasingly common.
Here we present the first probabilistic model for coestimating gene trees and the species tree in the presence of DLs. During the course of the inference, expected numbers of DLs are also estimated for each branch of the species tree, providing ways to contrast genomic evolution among lineages in the tree of life. We have implemented this model in a parallel algorithm to analyze genome-size data sets for dozens of species. Using extensive simulations, we show that our method accurately estimates the gene trees, the species tree, and the parameters of DLs, and that it is robust to moderate levels of incomplete lineage sorting in gene histories. We apply our algorithm to a data set of nearly 7000 gene families from 36 mammalian genomes from the Ensembl database v57 and show that we can reconstruct a rooted species tree, which corresponds to state of the art knowledge of the phylogeny of mammals, even in the presence of low-coverage genomes. We discuss our results in terms of the dynamics of evolution of these genomes and show that the gene trees reconstructed with our approach yield estimates of the content and organization of ancestral mammalian genomes that are much more realistic than other methods commonly used on genomic data.
Coestimation of gene and species trees
We introduce PHYLDOG, a probabilistic model that, given a set of gene alignments A, can reconstruct a species tree S and all corresponding gene trees T along with their DL scenarios, as well as branchwise expected numbers of duplications and losses N. PHYLDOG searches for the species tree that maximizes L(T, S, N|A), defined as the product, over all gene families Gi, of two likelihood functions on Gi. We assume that gene families evolve independently according to a shared set of DL parameters. In other words, we want to find S, T, and N that maximize:
with
where  is the set of all gene families, Ti and Ai are the gene tree and alignment for family Gi, respectively. L(Ti|Ai) is the likelihood of a phylogeny given an alignment, and can be computed using any probabilistic model of sequence evolution (Felsenstein 2003). In practice, all models implemented in the Bio++ library (Dutheil et al. 2006) for nucleotide, codon, and amino acid sequences are available in our implementation. L(S, N|Ti) is the likelihood of the reconciliation of a gene tree with a species tree according to DL rates. It is computed using a model similar to the one described by Akerborg et al. (2009), but with parameters for events of DL that are shared among families and branch specific on the species tree, thus accommodating heterogeneities in rates of DLs among lineages. In the Supplemental Material we show that the function L(T, S, N|A) that we optimize is proportional to the posterior probability P(T, S, N|A), if we assume a uniform prior on S, N.
A notable difference between our model and previous works (Arvestad 2003; Dubb 2005; Akerborg et al. 2009; Rasmussen and Kellis 2010; Górecki et al. 2011) is that our model does not require divergence time estimates in addition to rates of gene DL. Instead, we directly estimate expected numbers of DLs for each branch of the species tree. These expected numbers correspond to the product of branch lengths on the species tree, in units of time, by the rates of DL, respectively. We use the same strategy as used in methods of phylogenetic reconstruction without a clock, where branch lengths are estimated in expected numbers of substitutions (Felsenstein 2003). This allows us to avoid the difficult estimation of divergence times on the species tree.
Implementing this model for coestimating gene and species trees requires dedicated algorithms. Previous works (Arvestad 2003; Dubb 2005; Akerborg et al. 2009; Rasmussen and Kellis 2010; Górecki et al. 2011) have described the search for a single gene tree under similar models, with a fixed species tree, fixed divergence times, and fixed rates of gene DL. However, our algorithm handles a large number of gene families simultaneously, while also searching for the species tree and branch-specific parameters of DL. To achieve this, PHYLDOG is implemented in a parallel architecture (Fig. 1), where for a given species tree and a given set of gene trees, client processes compute L(Gi), send the values to a server process, which then computes L(T, S, N|A). In addition to computing the scores, client and server processes are in charge of optimizing gene and species trees, respectively, using local rearrangement heuristics (see Methods; Supplemental Material sections S1–S5).
Figure 1.

Genome-scale joint reconstruction of the species and gene trees. PHYLDOG is using a parallel server–client architecture. The server (in red) is in charge of the species tree search, and computes L(T, S, N|A). It communicates with clients (in boxes), each one in charge of one or more gene families, for which they search the gene tree maximizing L(Gi) = L(S, N|Ti) × L(Ti|Ai), using sequence alignments. (a) The server sends the current species tree as well as other parameters to the clients. (b) The clients compute L(Ti|Ai), i.e., the likelihood of a sequence alignment given the gene tree. ( c) The clients compute L(S, N|Ti), and send L(Gi) to the server.
Results
Simulations
We tested the ability of PHYLDOG to correctly infer the species tree, the gene trees, and the numbers of DLs by running a large-scale simulation (40 species, 2000 gene families). We intended to emulate the relative complexity of real data by introducing heterogeneity in rates of DL among families and by using a relatively complex model of sequence evolution in the simulations, and attempting to reconstruct their history with a homogeneous, simple model (see Supplemental Material section S6).
The program reconstructed the correct rooted tree topology for the species tree (Supplemental Fig. S2), despite starting from a random topology. Figure 2 shows that PHYLDOG provides accurate estimates of branchwise expected numbers of duplications and losses per gene. These parameters were more difficult to estimate for branches with small expected numbers of events, because events with frequencies on the order of 10−3 have too few realizations in our data set of 2000 gene families. Gene trees reconstructed by PHYLDOG were more accurate than those reconstructed independently from alignments using standard maximum likelihood methods implemented in PhyML (Guindon et al. 2010). This was the case even when PhyML was run with the model of sequence evolution used for simulation. In addition, we found that PHYLDOG was able to correctly infer the root of the gene trees for 1981 gene families out of 2000 (99% of the trees).
Figure 2.

(A) Correlation between the expected and reconstructed numbers of duplications and losses per gene and per branch of the species tree. The x = y line is in gray. (B) Topological (RF) (Robinson and Foulds 1979) distance to the true gene family trees of the trees reconstructed by PHYLDOG under a simpler model of sequence evolution (JC69) than that used in the simulation (HKY85 with rate heterogeneity among sites) and by PhyML under the same simple model and under the correct model of evolution. For PHYLDOG, the median RF distance to the true tree is at 0.
Reconstructing the evolutionary history of mammalian genomes
We used PHYLDOG to analyze the history of the mammalian genomes represented in the Ensembl database v. 57 (Flicek et al. 2010) (Supplemental Material section S7). The mammalian phylogeny has been the focus of intense research, and many groupings in the species tree have now been resolved, although some are still contentious. Our data set included 6966 gene families from 36 mammalian species with widely different sequence coverages (Supplemental Table S1). Genomes with low coverage share by chance a number of unsequenced or unannotated genes, making this data set challenging for studying genomic evolution (Milinkovitch et al. 2010). We introduced a correction to account for genome coverage to prevent PHYLDOG from interpreting these artifactual “shared losses” as a signal for clustering low-coverage genomes together in the species tree. More precisely, we added a component to the expected number of gene losses on terminal branches that depended on genome coverage (Supplemental Material section S8). For this analysis, we benefited from a French national supercomputing resource for research, JADE, currently the 43rd largest supercomputer in the world (Top500 November 2011 supercomputer list, http://www.top500.org), and used 3000 processes in parallel.
We started PHYLDOG from a random species tree topology, and obtained the tree shown in Figure 3. For comparison, we also reconstructed the species trees using two alternative approaches: iGTP (DL parsimony method) (Chaudhary et al. 2010), and duptree (gene tree parsimony method) (Wehe et al. 2008). These two approaches differ from ours by their use of a parsimony framework and the fact that the gene trees need to be reconstructed a priori (here we used these methods with gene trees inferred by PhyML). We also compared the species tree inferred by Phyldog with the species tree that is used by Ensembl to build the Compara database (which is based on a synthesis of the current literature on mammalian phylogeny). Overall, the four species trees agree on most well-established relationships and, for instance, support the Atlantogenata hypothesis for the root of the placental phylogeny (Fig. 3; Supplemental Figs. S5, S6, S7; Waddell et al. 1999; Murphy et al. 2007). However, iGTP does not recover the consensus mammalian root between monotremes and Eutheria. Most incongruences among the four trees appear in Laurasiatheria, notably regarding the position of bats, a problem still highly controversial (McCormack et al. 2012; Zhou et al. 2012), possibly made difficult by effects of incomplete lineage sorting (McCormack et al. 2012). Interestingly, the PHYLDOG tree and the tree used by Ensembl place the tree shrew Tupaia belangeri as a sister to primates, as in a previous study based on rare genomic events (Janecka et al. 2007), but the two parsimony-based methods place it next to or within rodents. Although the question of the position of tree shrews remains largely open, these results suggest that the simultaneous inference of gene trees and the species tree such as implemented in PHYLDOG may be an important step toward resolving difficult phylogenetic questions such as this one.
Figure 3.
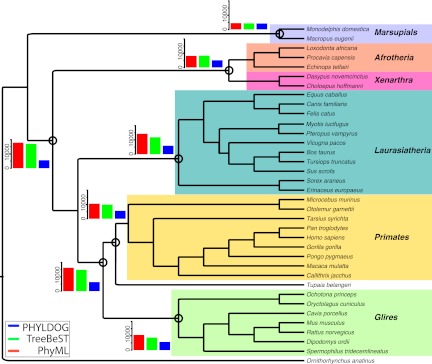
Mammalian tree reconstructed by PHYLDOG, with arbitrary branch lengths. Ancestral gene contents obtained using PhyML (red), TreeBeST (green), and PHYLDOG (blue) are shown for several nodes (circled).
For those nodes that are common between our phylogeny of mammals and the one used in Ensembl Compara, we estimated ancestral genome sizes using gene trees reconstructed by PHYLDOG and two widely used methods to reconstruct gene trees at the genomic scale, PhyML (Guindon et al. 2010) and TreeBeST (Vilella et al. 2008). We used only the 5039 gene trees that had identical sequence content in our analysis and the trees provided by Ensembl (see Supplemental Material section S10). Figure 3 shows these estimates for some key ancestral nodes. They suggest striking differences in the reconstructed dynamics of mammalian genomes: According to TreeBeST and PhyML, mammalian genomes have consistently reduced in gene numbers from a large genome ancestor. In contrast, PHYLDOG suggests more stable genome sizes throughout the evolution of mammals.
We compared the quality of the gene trees reconstructed by PHYLDOG with those reconstructed using PhyML (Guindon et al. 2010) and TreeBeST (Figs. 3, 4; and Supplemental Material section S10; Vilella et al. 2008). First, for each of these sets of reconciled gene trees, we compared the number of gene duplications and the reconstructed ancestral genome sizes. As noted by Hahn (2007), errors in gene tree reconstruction are expected to inflate the number of inferred duplications on internal branches of the species tree and to produce larger ancestral genomes. Second, because more accurate gene trees are expected to give more reliable predictions of orthology, and orthologs are usually found in the same genomic locus across species, the neighborhoods between predicted orthologs should also be conserved (Vilella et al. 2008). From reconstructed gene trees and adjacencies between extant couples of genes (immediate proximity, with no other gene between the two in the data set), we inferred adjacencies between ancestral genes (Supplemental Material section S9). Like extant genes, most ancestral genes should have exactly two adjacent neighbors, one on each side. However, erroneous gene trees tend to introduce spurious duplications, and because the corresponding locus has not been duplicated in the genome, the “duplicates” will be mapped to the exact same position. Direct neighbors will therefore have at least three adjacencies: two with these spurious duplicates on one side, and one with their true neighbor on the other side. Poor reconstruction methods will therefore show fewer genes with exactly two adjacent neighbors because they contain many erroneous gene trees.
Figure 4.

Quality of ancestral chromosome reconstruction inferred from gene tree reconciliations. We used the species tree and reconciliations from Compara to analyze TreeBeST trees, and the most parsimonious reconciliation using the species tree in Figure 3 for PhyML and PHYLDOG trees. (A) Genome content corresponds to the total number of genes from 5039 families (selected for comparison purposes, see Supplemental Material section S10), for all ancestral nodes in the species phylogeny. “Extant” corresponds to the observed numbers of genes in our data set for extant species. Gene contents reconstructed from PHYLDOG trees are significantly smaller than those reconstructed from TreeBeST trees: paired Wilcoxon test P-value = 4.10−4. (B) Number of adjacencies per ancestral gene. The proportion of genes with two adjacencies is higher for PHYLDOG (blue) than for PhyML (red) and TreeBeST (green) (paired Wilcoxon test P-value = 3.10−11 for the comparison with TreeBeST).
According to trees reconstructed using PhyML, the set of gene families that we used has undergone 43,483 duplication events during the history of mammals. Using trees built and reconciled using TreeBeST, this number is much smaller (14,868) but still significantly higher than with PHYLDOG trees, which yield 9869 gene duplications. Overall, PhyML trees and TreeBeST trees show more duplications on internal branches than on external branches (paired Wilcoxon test P-values: P < 10−16), as expected from gene trees that contain errors (Hahn 2007), but for PHYLDOG trees, internal branches show fewer duplications than external branches (paired Wilcoxon test P-value: P < 10−16).
Figure 4 shows genome sizes and the distribution of ancestral gene adjacencies inferred with different sets of gene trees. As expected, PhyML trees, which are reconstructed in the absence of any information on the species tree, yield relatively poor results in terms of ancestral genome content (8263 genes on average, compared with 4144 genes for the genomes of extant species) (Fig. 4A; Supplemental Fig. S8). TreeBeST trees, built using a species tree to choose among a set of possible gene trees, are better, in part because duplication nodes with low support in gene trees are discarded by TreeBeST reconciliations (7814 genes on average, Supplemental Figs. S8, S9, S10). Compared with PHYLDOG (5074 genes on average), both algorithms lead to much larger ancestral genomes for deeper nodes in the species tree (Fig. 3), showing that the gene trees that they reconstruct contain more errors than PHYLDOG gene trees (Hahn 2007). This is confirmed by the distribution of ancestral gene adjacencies (Fig. 4B). Fully annotated gene families and error-free gene trees would give exactly two neighbors to almost all ancestral genes. Genes with fewer or more neighbors are due to unassembled genomes, but also reflect the quality of gene tree reconstruction. PHYLDOG trees provide more complete (fewer genes with 0 or one neighbor) and less erroneous (more genes with two neighbors and fewer with three or more) reconstructions of ancestral genome organizations. Overall, trees built using our model yield better estimates of ancestral genomes. Interestingly, although the number of duplications is much lower with PHYLDOG than with TreeBeST, we find cases where PHYLDOG proposes a gene tree with a larger number of duplications than TreeBeST, and which is more compatible with ancestral genome reconstructions (e.g., Fig. 5). This confirms that the most likely scenario of gene family evolution according to PHYLDOG is different from the most parsimonious scenario, thanks to the use of a probabilistic model.
Figure 5.
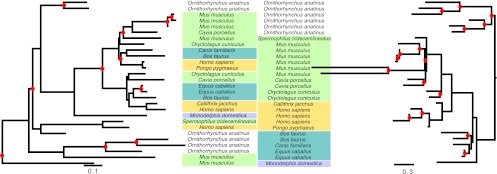
Reconciled trees reconstructed by TreeBeST (left) and by PHYLDOG (right) for gene family containing human gene coding for protein ENSP00000391561, “T-cell receptor, gamma, variable region V9.” Gene names have been replaced by species names (see Supplemental Fig. S11 for original gene names). Although PHYLDOG predicts more duplications (red dots) than TreeBeST, it proposes a scenario more consistent with ancestral chromosomal organizations (proportion of ancestral genes with two neighbors: TreeBeST: 0.29, PHYLDOG: 0.54).
Because ancestral genomes are not expected to be systematically larger than extant genomes, the comparison of ancestral genome sizes with extant genome sizes provides an (upper) estimate of the amount of remaining reconstruction errors in gene trees (Fig. 4). The difference between extant and ancestral genome sizes can be attributed to several sources: errors in annotations and family clustering, remaining errors in gene trees, and correctly reconstructed gene trees in which instances of incomplete lineage sorting are interpreted as duplication events. Regarding reconstruction errors, although PHYLDOG allows correcting for a large fraction of phylogenetic artifacts (Fig. 5), we find that gene alignments with low quality reduce gene tree accuracy, as shown by a negative correlation between the quality of a sequence alignment (Supplemental Material section S11) and the amount of error in the corresponding gene tree (measured as the proportion of ancestral genes with fewer or more than two adjacencies: R = −20, P < 10−16).
Sensitivity to incomplete lineage sorting
Although PHYLDOG seems relatively robust to misspecifications of sequence evolutionary models and heterogeneity in rates of DL among families, its model evidently does not account for the full complexity of the gene evolutionary process. In particular, lateral gene transfer, gene conversion of paralogs, or incomplete lineage sorting (ILS) are not yet included in the model. In the case of the mammalian phylogeny, the role of ILS seems particularly problematic and could yield PHYLDOG to overestimate the number of DLs in gene histories. In order to evaluate the impact of ILS on the inference made by PHYLDOG, we performed two additional experiments: first, we used the simulated data set of gene trees from Rasmussen and Kellis (2012) to simulate sequences and run PHYLDOG (Supplemental subsection S6.2). This data set simulates the joint effect of ILS and DL on the evolution of gene families, under 24 conditions spanning a large range of parameters. Each set of parameters is used to simulate 500 gene families along a species tree of 12 species, and the range of ancestral population size (from 106 to 500 * 106) ensures varying levels of gene tree/species tree incongruences due to ILS.
In this case, we observe that PHYLDOG accurately reconstructs gene trees (Supplemental Fig. S3; Supplemental subsection S13.1), even in cases of severe ILS, and that the species tree inferred is correct for ancestral population sizes below 100 million individuals. However, the number of erroneous duplications increases steadily with increasing levels of ILS (Supplemental Fig. S3). Hence, these simulations suggest that except in situations of extreme ILS, gene tree and species tree reconstruction remain accurate, but that higher degrees of gene tree/species tree incongruences can only be interpreted by PHYLDOG as high numbers of DL.
Second, we focused on the case of Homo sapiens, Pan troglodytes, and Gorilla gorilla, in which ILS has been described as prevalent (Supplemental Material section S13). We used the measures of ILS established by Scally et al. (2012) to see how PHYLDOG had interpreted this signal in our analysis of mammalian genes. Contrary to PhyML and TreeBeST, PHYLDOG seems insensitive to ILS in this data, and recovers a topology identical to the species tree even in gene families reported to have been affected by ILS (Scally et al. 2012). It should be noticed that the amount of ILS depends on the effective population size and on the length of the branch between two speciation events. In the case of primates, which have relatively small effective population sizes, ILS is expected to impact only short branches. For example, 30% of the genome was affected by ILS during the gorilla/(human, chimpanzee) divergence (about 2 MYRS between the two cladogenesis events) (Scally et al. 2012), whereas the comparison of orangutan with human and chimpanzee genomes revealed that only 1% of the orangutan genome was affected by ILS (about 6 MYRS between the two cladogenesis events) (Hobolth et al. 2011). Short branches are expected to leave little phylogenetic signal. Moreover, different exons of a same gene may have different ILS histories, which would further weaken the signal of ILS. Thus, even though the comparison of human, chimpanzee, and gorilla genomes revealed a high prevalence of ILS (Scally et al. 2012), this process did not leave a strong signal in individual gene phylogenies and, therefore, PHYLDOG systematically forced the gene trees to match the species tree. However, simulations show that when population sizes are very large, ILS can affect long branches and, hence, leave a strong phylogenetic signal in gene trees. In such cases, PHYLDOG correctly recovers the species trees and gene trees, but incorrectly interprets cases of ILS as events of DLs (see Supplemental section S13 for further discussion).
Discussion
Both simulations and biological data analyses show that it is possible to simultaneously infer accurate species and gene trees with a probabilistic model of gene family and sequence evolution. We use simulations to show that the inference of the species tree and gene trees are robust to violations of the model implemented in PHYLDOG, and especially misspecification of the model of sequence evolution, heterogeneity of rates of DL among gene families, and various degrees of ILS. However, because PHYLDOG provides reconciled trees invoking only speciations and DLs, the scenarios of evolution it outputs can be wrong in the case of a strong signal for ILS. In such cases, the numbers of DL can be widely overestimated. This means that one should be careful on the interpretation of reconciliation scenarios in regions of the species tree where PHYLDOG infers particularly high numbers of DL. On the contrary, we observe that PHYLDOG can also erase a weak signal for ILS in gene trees. Refinements such as proposed in Rasmussen and Kellis (2012), in which a model of DL is combined with a model of incomplete lineage sorting could be implemented in PHYLDOG to study both population-level phenomena as well as the dynamics of gene family evolution.
The inference presented here is achieved by our method in a few days on a cluster of computers, and is robust to violations of the models of sequence and gene family evolution and to strong heterogeneities in genome coverages among species.The fact that PHYLDOG can be run on thousands of gene families to reconstruct more accurate gene trees than other approaches (Fig. 4; Vilella et al. 2008; Guindon et al. 2010) makes it particularly useful for comparative genomic studies and for building genomic databases (Penel et al. 2009; Flicek et al. 2010; Huerta-Cepas et al. 2011). Its ability to reconstruct the species tree should also be key to recent projects (e.g., G10K, Genome 10K Community of Scientists 2009; i5K, Robinson et al. 2011 projects) that sequence genomes in groups that have been understudied thus far, for which reference species trees and estimates of divergence times and DL rates are not available.
Recent studies have shown that the coestimation of alignments and phylogenies provides better alignments and trees than separate reconstructions (e.g., Liu et al. 2009). The results presented here now show that the joint reconstruction of species and gene trees improves upon competing two-step approaches for phylogenomics. Overall, integrative approaches such as these are superior in terms of quality and are conceptually more rigorous than established two-phase methods. Therefore, it seems reasonable to predict that a method capable of jointly inferring the gene alignments, the gene trees and the species tree for dozens of whole-genome sequences will be proposed in the next few years, and will provide improved inferences. PHYLDOG's parallel framework seems naturally suited for such an endeavor.
Methods
We devised a method, named PHYLDOG (joint inference of Organism and Gene PHYlogenies modeling gene Duplications and Losses), which is able to run with thousands of gene families and dozens of species for the joint inference of gene trees and species trees. In this section we introduce the model of gene family evolution and some of the algorithms that we use. More details can be found in the Supplemental Material.
Probabilistic models and inference
We jointly model gene family evolution and sequence evolution. We assume that gene family evolution only involves events of gene duplications and gene losses, and that sequence evolution only involves events of substitutions between nucleotides or amino-acids. The probabilistic modeling of sequence evolution has been the subject of a large body of literature, and algorithms are available to compute the likelihood of the gene family tree given the alignment, L(Ti|Ai) (Felsenstein 1981). The probabilistic modeling of gene DL is more recent. Parsimony reconstructions of gene family evolution were first developed in 1979 (Goodman et al. 1979), and since then have been the object of several articles attempting to improve the algorithms (Mirkin et al. 1995; Guigó et al. 1996; Zmasek and Eddy 2001; Dufayard et al. 2005; Bansal and Eulenstein 2008; Wehe et al. 2008; Bansal et al. 2010). More recently, probabilistic models of gene family evolution have been developed (Arvestad 2003; Dubb 2005; Akerborg et al. 2009; Rasmussen and Kellis 2010; Górecki et al. 2011). In most of these cases, gene DLs are modeled by a birth–death process running along a species tree, and algorithms have been developed to compute the likelihood of a species tree (and in our case parameters of DL given a gene tree [L(S, N|Ti)].
It is natural to integrate these two models of sequence and gene family evolution into a hierarchical model, where gene trees are generated from a species tree through a birth–death process, and gene sequences are generated from gene trees through a substitution model. First, we define a gene family likelihood L(Gi) as in equation 2.
As both L(S, N|Ti) and L(Ti|Ai) can be computed, L(Gi) can also be computed, and one can devise algorithms to search for the best gene tree or sample gene trees according to this formula. For instance, Akerborg et al. (2009) devised a bayesian procedure to sample gene trees for a single gene family according to a similar equation, assuming a known species tree.
Previous works (Arvestad 2003; Dubb 2005; Akerborg et al. 2009; Rasmussen and Kellis 2010; Górecki et al. 2011) have all taken the species tree, divergence times, and rates of DL as given, and have considered one gene family at a time. We extend upon these approaches by considering several gene families at a time, and by searching for the species tree and the expected numbers of DLs.
As is commonly done in models of sequence evolution that assume that sites of a molecule evolve independently of each other, we assume that all gene families evolve independently of each other. We therefore obtain the formula shown in equation 1 for the overall score of the hierarchical model.
Using this equation and devoted algorithms, one can search for the best gene trees and species tree by maximizing over gene trees, species tree, and branch-wise expected numbers of DLs. Our algorithms are tuned to achieve efficiency: In the first step of the algorithm, where the species tree is not accurate but gene trees can be obtained with algorithms that only use the information contained in the gene sequences, only the species tree is rearranged. In later steps, when the species tree has been improved, both the species tree, the parameters of DL, and the gene trees are jointly optimized. In the final step, when the topology of the species tree cannot be further improved, an extra round of more extensive gene tree exploration with optimization of the parameters of DL is done to further improve these estimates. Detailed descriptions of the algorithms can be found in the Supplemental Material, section 4.
In this work, we use classical models of sequence evolution to compute L(Ti|Ai) and rely on a birth–death model to compute L(S, N|Ti) (as in Arvestad 2003; Dubb 2005; Akerborg et al. 2009; Rasmussen and Kellis 2010). However, our birth–death model differs from theirs in two important respects. First, we do not assume that DL rates have been constant over the whole species phylogeny, and we choose instead to associate a particular pair of DL parameters {λb, μb} to each branch b of the species tree. Second, previously published approaches (Arvestad 2003; Dubb 2005; Akerborg et al. 2009; Rasmussen and Kellis 2010; Górecki et al. 2011) require a time-anchored species tree, where each branch length corresponds to the amount of time elapsed between the beginning and the end of the branch. In practice, these strategies therefore require that a time-calibrated species tree be estimated before computing the likelihood of a gene family. Instead, we use the same trick as is used in classical phylogenetic inference without a clock: We reason in terms of expected numbers of events and not in terms of rates and times. We thus bypass the need to estimate node ages in the species tree, and estimate branchwise expected numbers of DLs {λb, μb} instead of branchwise rates of DL.
An important difference between our approach and previous approaches to reconstruct species trees and gene trees in the coalescent framework (e.g., Liu and Pearl 2007; Heled and Drummond 2010) is that we estimate trees and parameters by maximizing the likelihood of our model instead of sampling them in the Bayesian framework through a Markov Chain Monte Carlo (MCMC) algorithm. Although the latter procedure provides confidence intervals on its estimates, we favored the former because it avoids the difficulty to sample parameters inherent to hierarchical models. Indeed, in the case of the joint reconstruction of species and gene trees, the acceptance rate for proposed changes in the species tree can be reduced by the fact that any change in the species tree has an impact on thousands of gene trees, which need to be updated accordingly. A solution to this difficulty might be to propose simultaneous changes in the species tree and gene trees, and constitutes an interesting direction for future work.
Efficient implementation of the algorithms
As PHYLDOG was implemented with large-scale genomic data sets in mind, efficiency was a guiding principle throughout the design of the algorithms. First, the program is implemented in C++ and is based on the Bio++ libraries (Dutheil et al. 2006). Second, we parallelized the computations (see next section) using the Message Passing Interface (MPI) as implemented in the Boost libraries (Boost C++ source libraries, http://www.boost.org). Third, we made several approximations to improve time efficiency, which turn out to be harmless, as shown in simulations (see Supplemental Material, section 6). We here focus on two pieces of the algorithm: the computation of L(S, N|Ti), and the estimation of the expected numbers of DLs per gene per branch.
It is possible to compute the exact likelihood L(S, N|Ti) for a rooted binary species tree and a rooted binary gene tree through a complex dynamic programming algorithm as explained in (Akerborg et al. 2009). We rely on a simpler algorithm to compute an approximate likelihood, highly correlated to the true likelihood (r2 = 0.96, Supplemental Fig. S13). In short, we map nodes of the gene tree to nodes of the species tree, and use this mapping to cut the gene tree into subtrees. We then compute the likelihood of each of these subtrees according to our branchwise birth–death model, and then approximate the likelihood of the whole gene tree as the product of the subtree likelihoods (see Supplemental Material, section 2).
Our program assumes branchwise pairs of parameters describing the expected numbers of DLs per gene. Estimating parameters through numerical optimization can be costly. Instead, we use analytical formulas to estimate the expected numbers of DLs based on counts obtained from the gene trees, according to the most parsimonious reconciliation (see Supplemental Material, section 3).
Parallelization of the computations
Computations associated to the model described in equation 1 can be parallelized over several processes, as schematized in Supplemental Figure S1. In this framework, for a given species tree and a given set of gene trees, client processes compute L(Gi), send the values to a server process, which then computes L(T, S, N|A). In addition to computing the scores, client and server processes are in charge of optimizing the genes and species trees, respectively. The server process runs an algorithm to search for the best species tree according to L(T, S, N|A), and the client processes search for the best gene trees according to L(Gi). These algorithms rely on subtree prunings and regraftings, re-rootings, and nearest neighbor interchanges to explore tree space. The only communications are between the server and the clients, and are kept to a minimum, ensuring efficiency (see Supplemental Material, section 2).
Overall algorithm
PHYLDOG takes as its input gene alignments, a mapping between gene names and species names, and a list of species names. Based on these elements only, it can infer gene trees, species tree, and branchwise numbers of DLs.
The overall algorithm aims at maximizing L(T, S, N|A). The server explores the species tree space and, for each species tree explored, sends the species tree and parameters of DLs to the clients. The clients use the species tree and the parameters sent by the server to explore gene tree space, they maximize L(Gi), and return the maximum L(Gi) they found to the server as well as counts obtained from the gene trees. The server can then compute L(T, S, N|A) and update the species tree and parameters of DLs before sending these to the clients. The algorithm stops when L(T, S, N|A) can no longer be improved (see Supplemental Material, section 4).
Data access
Our implementation of PHYLDOG is available at: http://pbil.univ-lyon1.fr/software/phyldog/.
Acknowledgments
B.B. was supported by a postdoctoral fellowship from the Human Frontier Science Program and the CNRS. G.J.S. is supported by the Marie Curie Fellowship 253642 “GENEFOREST.” This project was supported by the French Agence Nationale de la Recherche (ANR) through Grants ANR-08-EMER-011-03 PhylAriane and ANR-10-BINF-01-01 Ancestrome. Computations were performed at the IN2P3 computing center and on JADE (CINES) in the DARI project c2011076436. We thank Matthew D. Rasmussen for his help with simulation data and J. Dutheil for his help with primate ILS data.
Footnotes
[Supplemental material is available for this article.]
Article published online before print. Article, supplemental material, and publication date are at http://www.genome.org/cgi/doi/10.1101/gr.141978.112.
Freely available online through the Genome Research Open Access option.
References
- Akerborg O, Sennblad B, Arvestad L, Lagergren J 2009. Simultaneous Bayesian gene tree reconstruction and reconciliation analysis. Proc Natl Acad Sci 106: 5714–5719 [DOI] [PMC free article] [PubMed] [Google Scholar]
- Arvestad L 2003. Bayesian gene/species tree reconciliation and orthology analysis using MCMC. Bioinformatics 19: i7–i15 [DOI] [PubMed] [Google Scholar]
- Bansal MS, Eulenstein O 2008. The multiple gene duplication problem revisited. Bioinformatics 24: i132–i138 [DOI] [PMC free article] [PubMed] [Google Scholar]
- Bansal MS, Burleigh JG, Eulenstein O 2010. Efficient genome-scale phylogenetic analysis under the duplication-loss and deep coalescence cost models. BMC Bioinformatics 11: S42 [DOI] [PMC free article] [PubMed] [Google Scholar]
- Chaudhary R, Bansal M, Wehe A, Fernandez-Baca D, Eulenstein O 2010. igtp: A software package for large-scale gene tree parsimony analysis. BMC Bioinformatics 11: 574. [DOI] [PMC free article] [PubMed] [Google Scholar]
- Dubb L. 2005. “A likelihood model of gene family evolution.” PhD thesis, University of Washington. [Google Scholar]
- Dufayard JF, Duret L, Penel S, Gouy M, Rechenmann F, Perrière G 2005. Tree pattern matching in phylogenetic trees: Automatic search for orthologs or paralogs in homologous gene sequence databases. Bioinformatics 21: 2596–2603 [DOI] [PubMed] [Google Scholar]
- Dutheil J, Gaillard S, Bazin E, Glémin S, Ranwez V, Galtier N, Belkhir K 2006. Bio++: A set of C++ libraries for sequence analysis, phylogenetics, molecular evolution and population genetics. BMC Bioinformatics 7: 188. [DOI] [PMC free article] [PubMed] [Google Scholar]
- Felsenstein J 1981. Evolutionary trees from DNA sequences: A maximum likelihood approach. J Mol Evol 17: 368–376 [DOI] [PubMed] [Google Scholar]
- Felsenstein J. 2003. Inferring phylogenies, 2nd ed. Sinauer Associates, Sunderland, MA. [Google Scholar]
- Flicek P, Amode MR, Barrell D, Beal K, Brent S, Chen Y, Clapham P, Coates G, Fairley S, Fitzgerald S, et al. 2010. Ensembl 2011. Nucleic Acids Res 39: D800–D806 [DOI] [PMC free article] [PubMed] [Google Scholar]
- Galtier N 2007. A model of horizontal gene transfer and the bacterial phylogeny problem. Syst Biol 56: 633–642 [DOI] [PubMed] [Google Scholar]
- Genome 10K Community of Scientists 2009. Genome 10K: A proposal to obtain whole-genome sequence for 10 000 vertebrate species. J Hered 100: 659–674 [DOI] [PMC free article] [PubMed] [Google Scholar]
- Goodman M, Czelusniak J, Moore GW, Romero-Herrera A, Matsuda G 1979. Fitting the gene lineage into its species lineage, a parsimony strategy illustrated by cladograms constructed from globin sequences. Syst Zool 28: 132–163 [Google Scholar]
- Górecki P, Burleigh GJ, Eulenstein O 2011. Maximum likelihood models and algorithms for gene tree evolution with duplications and losses. BMC Bioinformatics 12: S15. [DOI] [PMC free article] [PubMed] [Google Scholar]
- Guigó R, Muchnik I, Smith TF 1996. Reconstruction of ancient molecular phylogeny. Mol Phylogenet Evol 6: 189–213 [DOI] [PubMed] [Google Scholar]
- Guindon S, Dufayard JF, Lefort V, Anisimova M, Hordijk W, Gascuel O 2010. New algorithms and methods to estimate maximum-likelihood phylogenies: Assessing the performance of PhyML 3.0. Syst Biol 59: 307–321 [DOI] [PubMed] [Google Scholar]
- Hahn MW 2007. Bias in phylogenetic tree reconciliation methods: Implications for vertebrate genome evolution. Genome Biol 8: R141. [DOI] [PMC free article] [PubMed] [Google Scholar]
- Heled J, Drummond A 2010. Bayesian inference of species trees from multilocus data. Mol Biol Evol 27: 570. [DOI] [PMC free article] [PubMed] [Google Scholar]
- Hobolth A, Dutheil JY, Hawks J, Schierup MH, Mailund T 2011. Incomplete lineage sorting patterns among human, chimpanzee, and orangutan suggest recent orangutan speciation and widespread selection. Genome Res 21: 349–356 [DOI] [PMC free article] [PubMed] [Google Scholar]
- Huerta-Cepas J, Capella-Gutierrez S, Pryszcz LP, Denisov I, Kormes D, Marcet-Houben M, Gabaldon T 2011. PhylomeDB v3.0: An expanding repository of genome-wide collections of trees, alignments and phylogeny-based orthology and paralogy predictions. Nucleic Acids Res 39: D556–D560 [DOI] [PMC free article] [PubMed] [Google Scholar]
- Janecka J, Miller W, Pringle T, Wiens F, Zitzmann A, Helgen K, Springer M, Murphy W 2007. Molecular and genomic data identify the closest living relative of primates. Science 318: 792. [DOI] [PubMed] [Google Scholar]
- Liu L, Pearl DK 2007. Species trees from gene trees: Reconstructing bayesian posterior distributions of a species phylogeny using estimated gene tree distributions. Syst Biol 56: 504–514 [DOI] [PubMed] [Google Scholar]
- Liu K, Raghavan S, Nelesen S, Linder C, Warnow T 2009. Rapid and accurate large-scale coestimation of sequence alignments and phylogenetic trees. Science 324: 1561. [DOI] [PubMed] [Google Scholar]
- McCormack JE, Faircloth BC, Crawford NG, Gowaty PA, Brumfield RT, Glenn TC 2012. Ultraconserved elements are novel phylogenomic markers that resolve placental mammal phylogeny when combined with species-tree analysis. Genome Res 22: 746–754 [DOI] [PMC free article] [PubMed] [Google Scholar]
- Milinkovitch MC, Helaers R, Depiereux E, Tzika AC, Gabaldon T 2010. 2X genomes - depth does matter. Genome Biol 11: R16. [DOI] [PMC free article] [PubMed] [Google Scholar]
- Mirkin B, Muchnik I, Smith TF 1995. A biologically consistent model for comparing molecular phylogenies. J Comput Biol 2: 493–507 [DOI] [PubMed] [Google Scholar]
- Murphy WJ, Pringle TH, Crider TA, Springer MS, Miller W 2007. Using genomic data to unravel the root of the placental mammal phylogeny. Genome Res 17: 413–421 [DOI] [PMC free article] [PubMed] [Google Scholar]
- Penel S, Arigon AM, Dufayard JF, Sertier AS, Daubin V, Duret L, Gouy M, Perrière G 2009. Databases of homologous gene families for comparative genomics. BMC Bioinformatics (Suppl 6) 10: S3. [DOI] [PMC free article] [PubMed] [Google Scholar]
- Rasmussen M, Kellis M 2010. A Bayesian approach for fast and accurate gene tree reconstruction. Mol Biol Evol 28: 273–290 [DOI] [PMC free article] [PubMed] [Google Scholar]
- Rasmussen MD, Kellis M 2012. Unified modeling of gene duplication, loss, and coalescence using a locus tree. Genome Res 22: 755–765 [DOI] [PMC free article] [PubMed] [Google Scholar]
- Robinson D, Foulds L 1979. Comparison of weighted labeled trees. Isomorphic factorisations VI: Automorphisms. In Combinatorial mathematics, No. 748 in Lecture Notes in Mathematics (ed. AF Horadam and WD Wallis), pp. 119–126. Springer, Berlin [Google Scholar]
- Robinson GE, Hackett KJ, Purcell-Miramontes M, Brown SJ, Evans JD, Goldsmith MR, Lawson D, Okamuro J, Robertson HM, Schneider DJ 2011. Creating a buzz about insect genomes. Science 331: 1386 [DOI] [PubMed] [Google Scholar]
- Scally A, Dutheil J, Hillier L, Jordan G, Goodhead I, Herrero J, Hobolth A, Lappalainen T, Mailund T, Marques-Bonet T, et al. 2012. Insights into hominid evolution from the gorilla genome sequence. Nature 483: 169–175 doi. [DOI] [PMC free article] [PubMed] [Google Scholar]
- Vilella AJ, Severin J, Ureta-Vidal A, Heng L, Durbin R, Birney E 2008. EnsemblCompara GeneTrees: Complete, duplication-aware phylogenetic trees in vertebrates. Genome Res 19: 327–335 [DOI] [PMC free article] [PubMed] [Google Scholar]
- Waddell PJ, Okada N, Hasegawa M 1999. Towards resolving the interordinal relationships of placental mammals. Syst Biol 48: 1–5 [PubMed] [Google Scholar]
- Wehe A, Bansal MS, Burleigh JG, Eulenstein O 2008. DupTree: A program for large-scale phylogenetic analyses using gene tree parsimony. Bioinformatics 24: 1540–1541 [DOI] [PubMed] [Google Scholar]
- Wong KM, Suchard MA, Huelsenbeck JP 2008. Alignment uncertainty and genomic analysis. Science 319: 473–476 [DOI] [PubMed] [Google Scholar]
- Zhou X, Xu S, Xu J, Chen B, Zhou K, Yang G 2012. Phylogenomic analysis resolves the interordinal relationships and rapid diversification of the laurasiatherian mammals. Syst Biol 61: 150–164 [DOI] [PMC free article] [PubMed] [Google Scholar]
- Zmasek CM, Eddy SR 2001. A simple algorithm to infer gene duplication and speciation events on a gene tree. Bioinformatics 17: 821–828 [DOI] [PubMed] [Google Scholar]