

Abstract
Spatial organization of different epigenomic marks was used to infer functions of the epigenome. It remains unclear what can be learned from the temporal changes of the epigenome. Here, we developed a probabilistic model to cluster genomic sequences based on the similarity of temporal changes of multiple epigenomic marks during a cellular differentiation process. We differentiated mouse embryonic stem (ES) cells into mesendoderm cells. At three time points during this differentiation process, we used high-throughput sequencing to measure seven histone modifications and variants—H3K4me1/2/3, H3K27ac, H3K27me3, H3K36me3, and H2A.Z; two DNA modifications—5-mC and 5-hmC; and transcribed mRNAs and noncoding RNAs (ncRNAs). Genomic sequences were clustered based on the spatiotemporal epigenomic information. These clusters not only clearly distinguished gene bodies, promoters, and enhancers, but also were predictive of bidirectional promoters, miRNA promoters, and piRNAs. This suggests specific epigenomic patterns exist on piRNA genes much earlier than germ cell development. Temporal changes of H3K4me2, unmethylated CpG, and H2A.Z were predictive of 5-hmC changes, suggesting unmethylated CpG and H3K4me2 as potential upstream signals guiding TETs to specific sequences. Several rules on combinatorial epigenomic changes and their effects on mRNA expression and ncRNA expression were derived, including a simple rule governing the relationship between 5-hmC and gene expression levels. A Sox17 enhancer containing a FOXA2 binding site and a Foxa2 enhancer containing a SOX17 binding site were identified, suggesting a positive feedback loop between the two mesendoderm transcription factors. These data illustrate the power of using epigenome dynamics to investigate regulatory functions.
An epigenome consists of chemical modifications and protein variations to the DNA and histones, and some of these modifications and variations can be passed down to an organism's offspring (Bernstein et al. 2007). Epigenomes are dynamic, and epigenetic modifications are associated with changes in gene expression (Creyghton et al. 2010; Hawkins et al. 2011). Thus, the epigenome adds an extra layer of information onto the genomic sequence and enables a genome to dynamically orchestrate gene expression in different cell types (Karlic et al. 2010; Maunakea et al. 2010). It is argued that organismal development can be viewed as a progression of epigenomic states (Bernstein et al. 2007; Hawkins et al. 2010). To gain mechanistic support for this view, a number of challenges have to be addressed. First, when presented with genome-wide distributions of epigenetic modifications at multiple time points during a developmental or differentiation process, how can we find the genomic (cis-) regulatory sequences that regulate gene expression? What are the combinatorial functions of epigenetic modifications and regulatory sequences? Here, we present experimental data and a probabilistic model that utilizes the temporal changes of the epigenome to annotate the regulatory sequences. This approach classifies regulatory sequences by their temporal epigenomic patterns, and thus it can identify subclasses of cis-regulatory sequences with different regulatory functions.
Two types of associations were observed between the epigenome and gene expression. First, in a given cell type, the transcription levels of different genes are associated with the epigenomic modifications in the genomic neighborhoods of these genes. In other words, without changing cell types, epigenomic modifications at different chromosomal locations are indicative of the relative abundance of RNAs transcribed from these locations (Fig. 1A, spatial correlation [S]; Karlic et al. 2010). Second, for a given gene, the temporal change in its expression during a developmental or differentiation process is associated with temporal epigenomic changes (Fig. 1A, temporal correlation [T]; Rada-Iglesias et al. 2011). The first type of association facilitated the use of invariant epigenomic signatures in a static cellular condition to annotate genomic features (Ernst and Kellis 2010). However, genes are dynamically regulated in nearly all biological processes. It is important to incorporate the dynamic aspect of gene regulation into the annotation of the regulatory sequences. Here, we jointly model the position effect and the temporal effect of the epigenome, thus achieving ab initio identification and functional annotation of regulatory sequences.
Figure 1.

The genomic annotation based on the time-course epigenomic data (GATE) model. (A) Two types of correlations between the epigenome and gene expression. Spatial correlation (S) examines different genes in a fixed cell type, and temporal correlation (T) examines different differentiation stages or cell types for a fixed gene. Spatial correlation is often much more pronounced than temporal correlation. (B–C) GATE models the genome as equal-sized genomic segments, and each segment is associated with temporal epigenomic data. The model assumes that there are shared temporal epigenomic patterns among different genomic segments. GATE is a hierarchical model. The top layer is a finite mixture model for clustering genomic segments. The bottom layer models the temporal changes within each cluster as a hidden Markov model. The hidden variables (circles) are binary variables, indicating the time of a change of regulatory activities. Emitted (vertical arrows) from the hidden variable are the intensities of each epigenomic mark.
The regulatory functions of a number of epigenetic modifications remain elusive. A case in point is DNA hydroxymethylation (Wyatt and Cohen 1952). Methylated cytosine (5-mC) can be converted to an oxidized form 5-hydroxymethylcytosine (5-hmC) by a family of ten-eleven translocation (TET) proteins (Tahiliani et al. 2009; Ito et al. 2010). In embryonic stem (ES) cells, 5-hmC is enriched in gene bodies of actively transcribed genes (Wu et al. 2011a), promoters of inactive genes (Ficz et al. 2011; Pastor et al. 2011; Wu et al. 2011a), and active enhancers (Stroud et al. 2011). These seemingly conflicting data are thought-provoking for analyzing epigenetic modifications in a combinatorial manner, such that the function of each modification is investigated in the context of other modifications as well as the underlying genomic sequence. By modeling the co-appearance of different epigenetic modifications in each cell type, a pioneering method demonstrated the power in predicting different genomic features, including enhancers and genes (Ernst and Kellis 2010). However, epigenomic co-appearance in static cell types does not reveal all epigenetic mechanisms of gene regulation. Two major questions remain unsolved. First, what are the upstream signals that guide specific epigenomic modifications, such as 5-hmC, to appear in specific genomic regions? Second, the regulatory functions for several epigenomic marks, including 5-hmC and H2A.Z, remain elusive. New ideas for combinatorial epigenomic analyses beyond the co-appearance in static cell types are needed. A natural extension in this direction is to utilize a dynamic process in which both the epigenome and the transcriptome have changes. Ideally, we need some methods that can capture combinatorial patterns of temporal epigenomic changes and correlate them with gene expression changes.
A major difficulty in analyzing epigenomic dynamics lies in the asynchronous nature of epigenomic changes in different genomic regions. Suppose a type of epigenomic change, for example, the induction of H3K4me1 and 5-hmC, is a recurring pattern shared by many genomic regions. Such a pattern can be difficult to find because different genomic regions can accumulate either modification at different times. Furthermore, the corresponding changes in gene expression are not synchronized, making it difficult to associate epigenomic dynamics with gene expression changes. To reveal the hidden rules of epigenomic dynamics and gene expression, we developed a spatiotemporal clustering model. This model clusters genomic regions by shared epigenomic changes but does not require the changes to be synchronized among a cluster of genomic regions. This was achieved by allowing each region to have its own time-specific epigenomic states and then integrating out the time of transition between the epigenomic states in the clustering model.
To investigate the functions of epigenetic modifications in a dynamic process, we differentiated mouse ES cells into mesendoderm cells (Yasunaga et al. 2005), the common precursor of mesoderm and endoderm. At three time points during this differentiation process, we mapped the genomic distributions of nine epigenetic modifications, including DNA methylation (5-mC), hydroxymethylation (5-hmC), histone variant H2A.Z, and histone modifications H3K4me1, H3K4me3, H3K27ac, H3K27me3, and H3K36me3. At the same time points, we also assayed the expression of small noncoding RNAs (ncRNAs) and total RNAs (Supplemental Fig. S1). Our model-based analysis of these temporal data revealed several fundamental properties of epigenome dynamics, characterizing regulatory roles for functionally elusive epigenomic modifications. As an analogy to the sequence “rules” of gene regulation (Buchler et al. 2003; Beer and Tavazoie 2004), these discoveries may provide epigenomic “rules” of gene regulation.
Results
A model for genome annotation using temporal epigenomic data
We developed a probabilistic model to annotate the genome using temporal epigenomic data. Two main features of this model include explicit treatment of combinatorial epigenomic changes and detecting similar but asynchronous epigenomic changes in different genomic segments.
As input data to the model, the genome is represented as consecutive genomic segments, with a typical segment size of 200 nucleotides (nt) (for the impact of segment sizes, see Supplemental Fig. S5). Each segment is associated with the time-specific intensities of a set of epigenetic modifications. The model clusters the genomic segments, such that each cluster shares a similar combination of epigenetic modifications as well as their temporal changes. We call the combination of epigenetic modifications shared by a cluster of genomic segments at a given time an epigenomic state. Each cluster represents a time-series of related epigenomic states. Essentially this model assigns epigenomic states based on time-series epigenomic data.
We call this model genomic annotation using temporal epigenomic data (GATE). GATE is a hierarchical model (Pearl 1985) with two layers (Fig. 1B). The top layer is a finite mixture model (FMM) (Equihua 1988), in which each component of the mixture represents a cluster of genomic segments that share temporal epigenomic patterns. Without considering the time factor, each component (cluster) degenerates into a set of genomic segments sharing an epigenomic state. The bottom layer models the epigenomic data in each cluster. Each cluster is modeled as a hidden Markov model (HMM) (Durbin et al. 1998) that represents the temporal changes of epigenetic modification intensities. The hidden states are binary activity states (inactive and active), which are allowed to change with respect to time. For example, if an enhancer changes from an active enhancer into an inactive enhancer during differentiation, the hidden states for this enhancer would change from 0 (inactive) to 1 (active). In a differentiation process, state 0 can be interpreted as the initial state before differentiation (undifferentiated [U]), whereas state 1 can be regarded as the other state in differentiated cells (differentiated [D]). The observed data are the epigenetic modification intensities for each genomic segment at every time point (Fig. 1B). The sequencing reads from chromatin immunoprecipitation followed by sequencing (ChIP-seq) experiments for each epigenetic modification on a genomic segment are modeled with a Poisson distribution, with the Poisson parameter reflecting the cluster and time-dependent epigenomic state. Thus, GATE has been completely specified as a generative probabilistic model (see Methods). In short, GATE is a finite mixture of HMMs. Distinguishing itself from a previous method that predicts chromatin states based on static epigenetic data (Ernst and Kellis 2010), GATE models epigenomic data as a dynamic continuum and directly utilizes temporal information to annotate epigenomic states. This feature facilitates the discovery of cis-regulatory sequences and the annotation of their regulatory functions (Supplemental Fig. S6).
We implemented an expectation–maximization (EM) method (Dempster et al. 1977) to estimate model parameters from data (Supplemental Fig. S1; Supplemental Methods). At every maximization step, we embedded a Baum-Welch algorithm (Durbin et al. 1998) to estimate the HMM parameters. We provide GATE as a fully documented program at http://biocomp.bioen.uiuc.edu/GATE. GATE was tested with simulated cell differentiation processes (Supplemental Data 1; Supplemental Tables S2–S4).
Epigenomic landscape during the differentiation of ES cells to mesendoderm
Mesendoderm is the diverging point of definitive endoderm and mesoderm (Yasunaga et al. 2005), which represents an important cell lineage besides the neural lineage (ectoderm) during the early stages of ES cell differentiation. We differentiated mouse ES cells to mesendoderm using Activin and a previously described culture medium (Yasunaga et al. 2005). On the sixth day of differentiation, almost all cells exhibited typical mesendoderm morphology and expressed mesendoderm protein Goosecoid (GSC) (Blum et al. 1992) and endoderm protein SOX17 (Supplemental Fig. S2A; Kanai-Azuma et al. 2002). Pluripotency genes Pou5f1(also known as Oct4), Sox2, and Nanog were down-regulated, whereas endoderm and mesoderm genes Gsc, Chordin, Foxa2, Sox17, Lim1, and Hnf4 were up-regulated (Supplemental Fig. S2B).
We measured a total of nine epigenomic marks at three time points (day 0, 4, and 6) during the differentiation process. These marks included seven histone modifications or variants (H3K4me1/2/3, H3K27ac, H3K27me3, H3K36me3, and H2A.Z), which were assayed by ChIP-seq (Xiao et al. 2012). We supplemented the histone data with two types of DNA modifications, including 5-hmC by chemical labeling and pull-down followed by sequencing (5-hmC-seq) (Song et al. 2011) and 5-mC by both methylated DNA immunoprecipitation followed by sequencing (MeDIP-seq) and DNA digestion by methyl-sensitive restriction enzymes followed by sequencing (MRE-seq) (Maunakea et al. 2010). The 5-hmC pull-down specifically used the chemical property of the hydroxyl-group and thus was efficient to distinguish 5-hmC from 5-mC (Song et al. 2011). MeDIP-seq was representative of 5-mC, and MRE-seq was representative of unmethylated CpGs (uCpGs) (Maunakea et al. 2010).
To analyze the transcriptome, we sequenced ncRNAs using the Illumina Small RNA Sample Preparation procedure followed by sequencing (Illumina 2010b) and mRNAs using RNA-seq (Mortazavi et al. 2008) at the same three time points. Taken together, 36 sequencing data sets composed of 1.94 billion 75-nt or 100-nt uniquely alignable sequencing reads were generated.
These data allowed us to estimate that 11.5% of the mouse genome is associated with at least one type of epigenetic modification in undifferentiated ES cells. Nearly half of these regions (5.60% of the genome) exhibited significant changes in at least one epigenetic modification during differentiation. About 1.92% of the genome was transcribed into mRNAs in ES cells, and 0.43% of the genome exhibited change of mRNA expression levels during differentiation.
Spatiotemporal clustering of epigenomic states
GATE clusters genomic segments based on both spatial distributions of epigenomic modifications and temporal changes of these modifications. Applying GATE to the “ES cell to mesendoderm” differentiation data set, we initially obtained 55 clusters, consistent with the previously estimated number of chromatin states (Ernst and Kellis 2010). These clusters formed 14 larger groups (Supplemental Fig. S3). Twelve of the 14 groups showed epigenomic characteristics that are typical to gene bodies, promoters, and enhancers. For example, groups 2, 3, 6, and 9 shared enhancer characteristics, including low H3K36me3, high H3K4me1 in either undifferentiated (Fig. 2A, U) or differentiated states (D), and either high H3K27me3 or high H3K27ac (Fig. 2, vertical green bar). Groups 1b, 5, 8, and 12 shared promoter characteristics, including high H3K4me3 and low H3K36me3 (red bar). Groups 1a, 4, 10, and 11 shared high levels of H3K36me3, which was associated with gene bodies (Fig. 2, blue bar; Kolasinska-Zwierz et al. 2009; Schwartz et al. 2009).
Figure 2.

Epigenomic clusters. (A) Average intensities of each epigenomic mark (column) in each cluster (row). The model allows each sequence segment to have two activity states, denoted as undifferentiated (U) and differentiated (D). The model assumes that each cluster has a shared mean intensity for each epigenomic mark at either activity state. These mean intensities are plotted in this matrix and are color-coded. Clusters with similar intensities were merged into larger clusters (groups) (for the merging procedure, see Supplemental Fig. S3). Based on the epigenomic patterns, the groups were assigned with representative names, including promoters, enhancers, genes, and repeats (vertical color bars). Consistent intensity changes across multiple clusters in a group are highlighted (red circles). (B) Fold enrichment of genomic and epigenomic features (column) in each cluster (row). Fold enrichment was calculated as the ratio between the average signal of a cluster to the average signal of all clusters. mRNA indicates transcription levels of nearest genes, derived from RNA-seq data; ncRNA, transcription levels of the genomic segment in each cluster, derived from ncRNA-seq data; CpG, CpG density; P300, EP300 (also known as p300) binding intensity; PolII, PolII binding intensity; and repeats, repeat density. Significant temporal changes are highlighted (orange circles).
By assigning clusters as promoter, enhancer, gene body, and repeat clusters (Fig. 2, red, green, blue, and gray bars), we turned the unsupervised spatiotemporal epigenomic clusters into predictions of different genomic features. To check these predictions, we compared the locations of the genomic segments in every cluster to their nearest genes. Indeed, the relative locations of genomic segments in each cluster corroborated the unsupervised predictions (Supplemental Fig. S4). Chromosome 11 was randomly chosen for quantifying the prediction accuracies. The sensitivities for detecting promoters increased from 0% to 60% when the false-positive rate (1 − specificity) increased from 0% to 0.25% (Fig. 3B). Similar tradeoffs between sensitivity and specificity were found for gene body predictions (Fig. 3C). These quantities reinforced the visual impression (Supplemental Fig. S4) that spatiotemporal clusters correlate with different genomic features. Changing the input size of genomic segments from 200 nt to 100 nt did not change any qualitative characteristics of the clustering results (Supplemental Fig. S5).
Figure 3.

Predicting genomic features. (A) Distribution of bidirectional promoters in the 55 epigenomic clusters. Fold enrichment indicates the ratio between the percentage of bidirectional promoters in a cluster and the average percentage of all clusters. (*) P < 10−60; (**) P < 10−90. (B–D) Accuracies of predicting genomic features as measured by receiver operating characteristic (ROC) curves. AUC indicates area under the curve. Promoters were predicted by groups 1b, 5, 8, and 12 (P < 2.2 × 10⁻¹⁶, Wilcoxon test). Gene bodies were predicted by groups 1a, 4, 10, and 11 (P < 2.2 × 10⁻¹⁶). Bidirectional promoters were predicted by cluster 19 (P < 2.2 × 10⁻¹⁶). (Insets) Details of the high specificity regions. (E) A predicted bidirectional promoter and a regular promoter. Along a fraction of chromosome 11, each genomic segment is colored by the cluster it belonged to. The stretch of DNA belonging to cluster 19 (yellow) corresponded to a bidirectional promoter.
Spatiotemporal epigenomic clusters are predictive of transposons, bidirectional promoters, microRNA promoters, and PIWI RNAs
Not only did the spatiotemporal epigenomic clusters predict usual genomic features such as enhancers, promoters, and gene bodies, unexpectedly these clusters were also capable of predicting genomic features, including repeats, bidirectional promoters (Lin et al. 2007; Hakkinen et al. 2011), microRNA (miRNA) promoters (Marson et al. 2008), and PIWI RNAs (piRNAs) (Thomson and Lin 2009).
Two groups (groups 13 and 14) exhibited unfamiliar epigenomic characteristics, including high H3K36me3 in parallel with high H3K27me3. These clusters did not locate in gene bodies or promoters (Supplemental Fig. S4). They contained the highest proportions of repeats among all 55 clusters (P = 5.45 × 10−37, Fisher's exact test) (Fig. 2B, “repeats” column). ncRNA expression showed that groups 13 and 14 corresponded to transcribed and silenced repeat sequences (Fig. 2B, ncRNA). These data suggest a distinct spatiotemporal epigenomic signature for repeats and transposons.
Bidirectional promoters were strongly enriched in group 8 (clusters 19, 12, 48; P = 3.9 × 10−290) (Fig. 3A). A simple but powerful classifier for identifying bidirectional promoters can be built based on the clusters. Based on whether a genomic segment belongs to cluster 19, one can reach 80% sensitivity with a specificity of 99.6% (Fig. 3D). Besides bidirectional promoters, miRNA promoters were also enriched in specific clusters, including cluster 28 (P = 6.96 × 10⁻²⁸, Fisher's exact test) and cluster 52 (P = 1.51 × 10⁻¹¹, Fisher's exact test) (Supplemental Fig. S7A). Thus, through unsupervised clustering, GATE revealed distinct spatiotemporal epigenomic patterns in several specific types of promoters.
PiRNAs and PIWI proteins were discovered in germ cells (Thomson and Lin 2009) and were thought to be silenced in ES cells. Unexpectedly, piRNAs were specifically enriched in cluster 11 (P = 3.08 × 10⁻¹⁶, Fisher's exact test) and cluster 28 (P = 2.05 × 10⁻⁶, Fisher's exact test) (Supplemental Fig. S7B). As a control, in cluster 11 where piRNA was strongly enriched (9.53-fold more enriched than expected), miRNAs were depleted (0.89-fold less than expected). Thus piRNAs and miRNAs had different temporal epigenomic characteristics. These data suggest that even though piRNAs were produced and functional in germ cells, specific epigenomic patterns were formed on piRNA genes much earlier than germ cell development. PiRNA genes may be epigenetically prepared for activation in ES cells.
The distinct epigenomic characteristics in ES cells opened the possibility that a subset of piRNAs is produced in ES cells. Indeed, a cluster of piRNA genes (piRNA cluster) on chromosome 5 was clearly expressed (Supplemental Fig. S7C). Moreover, the expression of this piRNA cluster was specifically induced in undifferentiated ES cells (Supplemental Fig. S7C, days 0, 4, 6). As a control, Sgsm1, the neighboring gene to this piRNA cluster, showed a slight increase in expression during differentiation (Supplemental Fig. S7C). Even more strikingly, Piwil2 (also known as Mili), a mouse ortholog of the Drosophila PIWI gene, is expressed in ES cells, and its expression decreased below a detectable level 4 d after differentiation (Supplemental Fig. S7D). The consistent inductions of piRNAs and the Piwil2 gene in undifferentiated ES cells further entertained the hypothesis that some piRNAs were produced not only in germ cells.
Combinatorial temporal changes of epigenomic modifications
There were large differences among the nine epigenomic modifications regarding their temporal changes. The most stable modification was H3K36me3, which showed little change in all groups. The other eight modifications showed cluster-specific temporal changes (Fig. 2).
Gene body groups showed three types of combinatorial changes. The first type was represented by coordinated decreases of H3K27ac, H3K4me1/2, H2A.Z, and 5-hmC and an increase in CpG methylation (Fig. 2, red circles in group 4). These coordinated epigenomic changes did not clearly influence mRNA expression (Fig. 2B, mRNA) but were associated with strong up-regulation of ncRNAs (Fig. 2B, ncRNA). The second combination was decreases of H3K27ac and H3K4me2/3 (red circles, group 11), which were associated with down-regulation of both mRNAs and ncRNAs (orange circles). The third combination was coordinated increases of H3K4me1/2 and 5-hmC, which corresponded to up-regulation of ncRNAs (groups 1a and 10).
All promoter groups shared increases of H3K4me1/2, H2A.Z, 5-hmC, and 5-mC together with a decrease in CpG methylation. Interestingly, this recurrent combinatorial pattern itself was not sufficient to induce gene expression changes. However, when this pattern was further combined with a decrease in H3K4me3, it was associated with down-regulation of ncRNAs (Fig. 2, group 1b).
Enhancer groups showed four types of combinatorial changes. The first type was an increase in CpG methylation, which correlated with down-regulation of ncRNAs (red and orange circles, group 6). The second combination was an increase in H3K27ac and decreases in H3K27me3 and 5-mC, which correlated with up-regulation of mRNAs and ncRNAs. The third type was coordinated decreases of H3K27ac, H3K4me1/2, H2A.Z, and 5-hmC together with an increase in 5-mC, which correlated with down-regulation of mRNAs and ncRNAs (group 9). The last type was coordinated decreases of H3K27ac and H3K4me3 together with a 5-mC increase, which correlated with down-regulation of mRNAs and ncRNAs (Fig. 2, group 7).
Both transcribed and silenced repeats showed coordinated decreases in H3K27me3, 5-hmC, and 5-mC (especially non-CpG methylation [mCpH]), which correlated with up-regulation of transcription (Fig. 2, ncRNA).
Recurrent themes of epigenomic and transcriptome changes
Recurrent themes appeared in the majority of the spatiotemporal clusters. These recurring patterns may represent basic properties of temporal gene regulation by the epigenome.
First, combinatorial epigenomic changes are prevalent. In every case except one, we observed combinatorial changes of three to seven epigenomic modifications. Furthermore, different genomic features (promoters, enhancers, genes, and repeats) have different combinations of temporal changes.
Second, combinatorial patterns of epigenomic changes are predictive of gene expression changes (Fig. 1A, temporal axis). While gene expression data were not used in clustering epigenomic data, the epigenomic clusters clearly distinguish gene groups with different temporal expression changes (Fig. 2).
Third, almost all combinatorial epigenomic changes correspond with changes in ncRNA expression levels. The direction of ncRNA expression changes was not associated with the changes in any single epigenomic modification but was strongly predictable by combinatorial changes (see Fig. 6).
Figure 6.

A model for combinatorial epigenomic changes and gene expression. One to several combinatorial patterns (columns) were identified on each genomic feature. The model-learned intensity levels for each epigenomic mark (input rows) in the undifferentiated state and the differentiated state are color-coded, and the directions of change are marked by arrows. The corresponding temporal changes of mRNA and ncRNA expression are color-coded in a green-to-red scale (output rows).
Fourth, epigenomic changes in enhancers instead of promoters are indicative of mRNA expression changes. This reconciles previous observations that temporal epigenomic changes were poorly correlated with gene expression changes during cell differentiation (Wu et al. 2011b) by reproducing such results in promoter regions with more epigenomic modifications; but also it points out the importance of epigenomic changes in enhancers. Consistently, human ChIP-chip analysis showed enhancer associated modifications, including H3K27ac and H3K4me1, had greater dynamic changes than other modifications during ES cell differentiation (Hawkins et al. 2011).
Fifth, all assayed modifications except H3K36me3 have robust temporal changes in multiple genomic features (promoters, enhancers, gene bodies, and repeats). The robust and recurrent temporal changes appeared not only in genomic regions where the epigenomic modifications were abundant, but also in genomic regions where the modification levels were low. Previously, H3K4me1 was associated with enhancers and H3K4me3 and H2A.Z were associated with promoters due to their abundance in these regions. However, H3K4me1 showed reliable changes not only in enhancers, but also in promoters and gene bodies where its modification level was low. Similarly, H3K4me3 (group 7) and H2A.Z (group 9) showed reliable changes in enhancers. These data may suggest regulatory functions of epigenomic modifications in previously ignored genomic regions.
Temporal changes of H3K4me2, mCpH, and H2A.Z are predictive of DNA hydroxymethylation
It remains unknown what guides TET enzymes to specific parts of the genome to convert 5-mC to 5-hmC. To explore the upstream signals that might specify where in the genome 5-mC should be converted to 5-hmC, we asked if there were any epigenomic modifications that correlate with 5-hmC in terms of temporal changes. Across all 55 epigenomic clusters (Fig. 2), the temporal changes of 5-hmC were on average most correlated with H3K4me2, uCpG (measured by MRE-seq), H3K4me1, and H2A.Z (Supplemental Fig. S8). Next, we checked the temporal correlations between 5-hmC and every other assayed epigenomic mark on every genomic segment (200-nt window). On 78.1% of the genomic segments, the temporal correlations between 5-hmC and H3K4me2 were larger than 0.8 (P < 10−300) (Supplemental Fig. S9B). Strong temporal correlations between 5-hmC and uCpG, 5-hmC and H4K4me1, and 5-hmC and H2A.Z were also observed (Supplemental Fig. S9E,9F). In contrast, H3K4me3 and H3K36me3 did not show large temporal correlations with 5-hmC. By categorizing genomic segments by their clusters, promoter segments showed the strongest temporal correlations between 5-hmC and H3K4me2, uCpG, and H2A.Z (Supplemental Fig. S9). These data indicate strong associations between the di- and monomethylation of H3K4 and hydroxylmethylation of nearby cytosines. The exchange of histone variants H2A and H2A.Z may also associate with 5-hmC synthesis.
The temporal changes of uCpG and 5-hmC were strongly correlated (Supplemental Fig. S9K). Two scenarios can fit these data. First, the uCpG was generated by a cytosine demethylation preprocess that involves the conversion of 5-mC to 5-hmC (Bhutani et al. 2011). In other words, the same cytosine is converted from 5-mC into 5-hmC and then into C (same cytosine hypothesis). Alternatively, uCpG signals TET enzymes to the genomic neighborhood to convert neighboring 5-mC into 5-hmC (neighbor hypothesis). If the same cytosine hypothesis is true, we would predict that 5-mC and 5-hmC are anti-correlated during ES cell differentiation. However, temporal changes of 5-mC did not anti-correlate with 5-hmC changes (Supplemental Fig. S9M). More genome segments had the same direction of 5-mC changes and 5-hmC changes than expected at random (P < 10−200) (Supplemental Fig. S9M, dashed line). These data are inconsistent with the same cytosine hypothesis. Conversely, TET1 contains a Znf_CXXC domain that interacts with uCpG, which is in line with the neighbor hypothesis.
We then explored the roles of mCpH. mCpH was reported in oocytes without known functions (Tomizawa et al. 2011). These mCpHs were presumably due to high levels of de novo methylation enzymes Dnmt3a/b in oocytes (Lees-Murdock et al. 2005). The simultaneous increase of 5-mC and decrease of CpG methylation in the same promoters (see Fig. 6; Supplemental Fig. S4) suggest de novo mCpH. This is consistent with the increased expression levels of DMNT3b during guided differentiation of ES cells toward mesendoderm cells (Supplemental Fig. S9N). Temporal changes of mCpH were strongly correlated with 5-hmC changes (Supplemental Fig. S9D), suggesting the genomic segments undergoing mCpH were also experiencing hydroxymethylation. Complementary to these data, 5-hmC level was most enriched in low CpG regions in ES cells (Yu et al. 2012). In summary, temporal changes of H3K4me1/2, mCpH, and H2A.Z are predictive of 5-hmC changes throughout the mouse genome. These temporal correlations do not provide any causal information, but they may help to prioritize some hypotheses for future biochemical analyses of 5-hmC pathways.
H2A.Z is predictive of gene expression in a context-specific manner
Epigenomic marks were thought to be predictive of gene expression levels in a context-independent manner (Karlic et al. 2010). The main support for this idea was that the linear model using epigenomic marks to predict expression can be learned from CD4+ T cells and then applied to other types of T cells (Karlic et al. 2010). To see if this theory holds during ES cell differentiation, we correlated the model-learned epigenomic modification levels to gene expression levels (Supplemental Fig. S10). Consistent with previous thoughts, some epigenomic marks were correlated with gene expression in a context-independent manner, in the sense that these correlations persist in different genomic locations (enhancers, promoters, etc.) and in different differentiation states. Such context-independent epigenomic marks included H3K36me3, H3K27ac, and 5-mC. However, several epigenomic marks showed context-specific influence on mRNA expression. Promoter H3K4me3 was correlated with mRNA expression, but enhancer H3K4me3 was not (Supplemental Fig. S10). Promoter H2A.Z was not correlated with mRNA expression in undifferentiated ES cells (Pearson correlation < 0), but promoter H2A.Z was strongly correlated with mRNA expression after differentiation (Pearson correlation = 0.83) (Supplemental Fig. S10, panel H2A.Z). Thus, epigenomic marks, although associated with gene expression, can have different directions of association in different cellular contexts.
A unified model for 5-hmC's effects on gene expression
The effects of 5-hmC on gene expression remain unclear. The difficulty of clarifying 5-hmC's effects lies, at least in part, in the seemingly conflicting data. On the one hand, promoter 5-hmC levels were anti-correlated with gene expression levels in both undifferentiated and differentiated ES cells (Fig. 4A,B; Supplemental Fig. S10, panel 5-hmC). This may suggest 5-hmC as a repressive mark. On the other hand, enhancer 5-hmC had a weak positive correlation with gene expression (Fig. 4C,D; Supplemental Fig. S10, panel 5-hmC), which may indicate an activation role. Is there a simple model that can accommodate all these data and illustrate 5-hmC's effects on gene expression? We identified a model by looking at temporal changes of 5-hmC.
Figure 4.
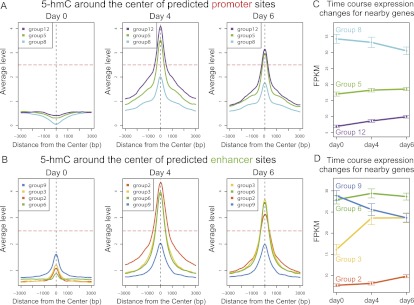
A unified model showing the effects of 5-hmC on gene expression. (A–B) The average intensities of 5-hmC on predicted promoter groups (A) and enhancer groups (B) in three time points. Three thousand base pairs (bp) of flanking regions centered on the centers of the genomic segments of each group are shown. (C,D) The expression levels of nearby genes for predicted promoter groups (C) and enhancer groups (D). Mean and standard deviation (error bar) are shown for each time point. Whether 5-hmC increases above a critical threshold (horizontal line, A,B) correlates with the direction of expression changes. (FPKM) Fragments per kilobase of exon per million fragments mapped.
5-hmC were concentrated on gene bodies in ES cells and were shifted to promoters after differentiation (Figs. 4B; Supplemental Fig. S11). These data are consistent with the recent discovery of lower 5-hmC in promoters than in intragenic regions in ES cells (Booth et al. 2012). However, the large increase of promoter 5-hmC and the decrease of intragenic 5-hmC during ES cell differentiation were not reported before. Enhancer concentration of 5-hmC was increased during differentiation (Fig. 4D). The enrichment of 5-hmC in enhancers and promoters in differentiated cells provides further support to the hypothesized regulatory role of 5-hmC (Ficz et al. 2011; Pastor et al. 2011; Stroud et al. 2011; Wu et al. 2011a).
5-hmC showed either a substantial increase or a moderate increase but showed no decrease in any enhancer clusters or promoter clusters (Fig. 4B, D). In both promoters and enhancers, a substantial increase of 5-hmC (Fig. 4A, promoter groups 5 and 12, C, enhancer groups 2, 3, 6) inevitably resulted in induction of gene expression. When 5-hmC did not substantially increase, nearby genes would show decreasing expression. This was consistent with both promoters (group 8) and enhancers (group 9). Similar analyses on MeDIP-seq and MRE-seq data suggest that 5-mC did not confound the observed effect of 5-hmC on gene expression (Supplemental Fig. S12). Thus, a simple model can explain the relationships between 5-hmC and gene expression during ES cell differentiation. If 5-hmC increases above a critical value, gene expression increases; otherwise, gene expression decreases. This model states an association between 5-hmC and gene expression changes, and it does not rule out additional epigenomic marks as confounding factors.
Epigenomic states correlate with transcription networks
The GATE model infers epigenomic states of every genomic segment as undifferentiated (U) or differentiated (D), indicating when a genomic segment may change its regulatory functions. Thus, the GATE model provides a genome-wide view of the locations of regulatory sequences as well as their time of activation. Such information may help to clarify the transcription network (Hawkins et al. 2011). To explore this potential, we did a case study for three mesendoderm genes: Fgf8, Sox17, and Foxa2. A set of group 3 enhancers were found in the introns and 3′ intergenic regions of Fgf8 (Fig. 5A, yellow boxes). These enhancers were predicted to shift from inactive to active epigenomic states (U→D). Transcription factor binding sites (TFBSs) of GSC and IRF-1 appeared in these enhancers (Fig. 5B,C). Both GSC and IRF-1 are key regulators of mesendoderm differentiation (Blum et al. 1992; Bruce et al. 2007). An isolated enhancer was identified ∼50,000 nt upstream of the Sox17 gene (Fig. 5D; Supplemental Fig. S12). Another enhancer was found ∼7000 nt upstream of the Foxa2 gene (Fig. 5E). By use of epigenomic data, GATE suggested that both the Sox17 enhancer and the Foxa2 enhancers shifted from inactive to active states (Supplemental Fig. S13), which was in line with the increased expression of these genes (Fig. 5D,E, FPKM). A strong FOXA2 TFBS appeared in the Sox17 enhancer, and a strong SOX17 TFBS appeared in a Foxa2 enhancer. These data suggest a positive feedback loop between Sox17 and Foxa2. Coincidently, a peak in a FOXA2 ChIP-seq experiment in mouse liver (GEO accession no. GSM427089) (MacIsaac et al. 2010) colocalized with the GATE-predicted Sox17 enhancer (Supplemental Fig. S14A, yellow bar). This is the strongest peak (P-value < 10−6) in the 70,000-nt sequence neighborhood of the Sox17 gene. Moreover, the predicted FOXA2 TFBS appeared at the center of this peak (Supplemental Fig. S14A, insert). Reversely, when Sox17 expression was induced in mouse ES cells, a strong peak (fold change = 8.1, P < 2.5 × 10⁻⁷) of SOX17 ChIP-chip (GEO accession no. GSM470844) (Niakan et al. 2010) appeared ∼7000 nt upstream of the Foxa2 gene, colocalizing with the GATE-predicted Foxa2 enhancer (Supplemental Fig. S14B). Moreover, the predicted SOX17 TFBS located precisely at the center of this peak (Supplemental Fig. S14B, insert). These ChIP-seq/chip data reinforced the GATE predicted feedback loop. This feedback loop can stabilize the activation of two master transcription factors and thus may be essential for mesendoderm differentiation.
Figure 5.

Predicted mesendoderm enhancers harbor transcription factor binding sites. Epigenomic clusters near the Fgf8 (A), Sox17 (D), and Foxa2 (E) genes. Genomic segments (colored bars) are marked by their cluster numbers on the left. Their variable widths indicate their activity states. A left-thin-right-fat bar indicates a change of the activity states. A strong GSC motif (B) and a strong IRF-1 motif (C) appeared in predicted enhancer segments in the 3′ and the intron of the Fgf8 gene. Both predicted enhancers showed changes of activities during the differentiation (left-thin-right-fat). A strong Foxa2 motif appeared in a predicted enhancer 50,000 bp upstream of the Sox17 gene (D). In turn, a strong Sox17 motif appeared in a predicted Foxa2 enhancer. (FPKM) Fragments per kilobase of exon per million fragments mapped.
Discussion
Previous computational methods for analyzing epigenomes relied primarily on spatial information of epigenomic marks. For example, an HMM model was developed to annotate genomic sequences by colocalization of multiple epigenomic marks (Ernst and Kellis 2010). GATE connects with the Ernst-Kellis model in that with only one time point, GATE degenerates into a zero-order HMM. Unlike the Ernst-Kellis model, though, GATE did not rely on prior information about the arrangements of genomic features. The unsupervised nature of GATE makes it capable of predicting the genomic features that were not included in a training process. In the ES cell differentiation process, GATE predicted bidirectional promoters, miRNA promoters, and piRNA genes with high accuracies.
Temporal information is as important as spatial information in studying epigenomic functions. A case in point is that although TET was known to interact with the trithorax homolog MLL (Tahiliani et al. 2009), the MLL targets H3K4me1/2 were not pursued as a major clue for guiding TETs to specific genomic regions. This was probably due to the lack of a very strong spatial correlation between H3K4me1/2 and 5-hmC in any studied cell types. Indeed, 5-hmC was enriched not only in enhancers where H3K4me1/2 levels were high, but also in promoters (Yu et al. 2012), CTCF binding sites (Yu et al. 2012), and gene bodies (Booth et al. 2012) where H3K4me1/2 levels were not necessarily high. However, temporal correlations between H3K4me1/2 and 5-hmC were particularly strong, in that >85% of the genomic sequences had the same direction of changes of H3K4me2 and 5-hmC (Supplemental Fig. S9B,E). This result prioritizes H3K4me1/2 and H3K4 methyltransferases as a candidate upstream signal for guiding TETs to specific parts of the genome.
People questioned uCpG's capability to attract TET1 (Frauer et al. 2011), despite TET1 containing a zinc finger CXXC domain that can bind uCpG (Tahiliani et al. 2009). Indeed, no genome-wide mapping has showed strong overlaps of 5-hmC and uCpG. Furthermore, the information content of CpG is small, making it hard to believe that such a weak sequence signal can confer specificity to guide TET1. In this study, we reported striking temporal correlations of 5-hmC and uCpG throughout the genome, highlighting the necessity of analyzing epigenome dynamics and providing genome-wide data to support the role of uCpG in guiding TET1. TET1's interacting partner MLL contains a zinc finger CXXC domain as well. Theoretically, the MLL–TET1–uCpGs three way interaction can be a lot more stable than a two-way interaction of a protein and its DNA recognition site (He et al. 2009). This MLL–TET1–uCpGs interaction is reinforced by MLL's roles to methylate H3K4 and interact with methylated H3K4. These analyses provide a model that uCpGs guide TET1 to specific genomic locations by initiating self-reinforcing uCpGs–MLL–H3K4me1/2–TET1 interactions.
It remains controversial whether 5-hmC predominantly exists in the CpG context. Stand bias analysis suggested presence of 5-hmC on CpH in ES cells (Ficz et al. 2011). However, this result was not supported by single-base resolution mapping of 5-hmC (Yu et al. 2012). We observed positive temporal correlations of mCpH and 5-hmC in multiple genomic regions. Two scenarios fit this observation. First, 5-hmC existed on CpH; alternatively, the temporal changes of mCpH were associated with 5-hmC changes in nearby CpGs. In promoters, uCpG levels measured by MRE-seq often increased as 5-hmC levels increased, which suggests that at least a subset of the newly converted 5-hmC in promoters were on CpHs. These results suggest perhaps examining differentiated ES cells may resolve the controversy of the presence of 5-hmC on CpHs.
Modeling and analyzing the temporal data facilitates the discovery of context-specific functions of epigenomic marks. In yeast, H2A.Z was associated with both active and inactive genes (Raisner et al. 2005). In this study, H2A.Z was clearly associated with active genes in mesendoderm cells but not in undifferentiated ES cells. This shows the importance of considering the cellular contexts when inferring the regulation functions of an epigenomic mark.
Most of the epigenomic marks (all assayed except H3K36me3) showed robust temporal changes in multiple genomic features, including promoters, enhancers, gene bodies, and repeats. This recurring theme can have large implications for studying gene regulation. In the canonical view, certain modifications are indicative of certain genomic features; for example, H3K27ac and H3K4me1 are enhancer marks and H3K4me1 is a promoter mark. This canonical view was built on the observation that these modifications were a lot more abundant in certain genomic features than others. This view made it tempting to ignore the regulatory roles of modification in places where it is not abundant. However, the robust temporal changes of many modifications in their noncanonical (low-abundance) regions, such as H3K27ac in gene bodies, H3K4me1 in gene bodies and promoters, and H3K4me3 in gene bodies and enhancers, indicate that they can play regulatory roles in more genomic features than in the canonical view. Future experiments are needed to test this hypothesis. Consistent with this new view, the temporal epigenomic changes in low-abundance regions were sometimes correlated with mRNA or ncRNA expression changes (Figs. 2, 6).
Another dilemma in the epigenomic field is as follows. On the one hand, epigenomic changes are essential to organismal development, supported by the fact that different cell types exhibit clearly different epigenomic patterns (Hawkins et al. 2010; Ernst et al. 2011). Thus, the epigenome is expected to regulate gene expression during development and differentiation (Hawkins et al. 2011). However, on the other hand, temporal epigenomic changes during cell differentiation were reported to not correlate with gene expression changes (Wu et al. 2011b). Our method and data allow us to investigate this dilemma from a new perspective.
From the methodological perspective, GATE provides two advantages. First, the unsupervised clustering summarizes the combinatorial changes of multiple epigenomic marks. Previously, one had to compare gene expression changes with every epigenomic mark one-by-one, resulting in inconclusive or even conflicting results. This was because the association between gene expression and an epigenomic mark may be confounded by other epigenomic marks. GATE enables us to correlate gene expression changes with the combinatorial changes of multiple epigenomic marks. Second, GATE makes unsynchronized changes in different parts of the genome comparable. This enables us to effectively pull information together from different genomic segments with similar but unsynchronized temporal changes.
Consistent with the previous erythroid differentiation study (Wu et al. 2011b), temporal epigenomic changes did not correlate with gene expression changes in several GATE clusters. These clusters were all in promoters (Fig. 2, groups 5, 8, 12). However, temporal epigenomic changes in enhancer-associated clusters were clearly correlated with gene expression changes. In particular, changes in DNA methylation alone were associated with ncRNA expression change (group 6); changes that involve different combinations of DNA and histone modifications were associated with both mRNA and ncRNA changes in different directions (Fig. 2, groups 3, 7, 9); and changes in modifications on repeats were predictive of repeat expression (groups 13, 14). Including nonuniquely mapped reads into the analysis may impact the results on repeat regions. These data suggest that the epigenome-mediated gene regulation during cell differentiation, although clear in enhancers, may not be discernible in promoters, thus helping to resolve the hitherto mentioned dilemma.
Methods
The probabilistic model for analyzing temporal epigenomic data (GATE) symbols
Indices are as follows: w, genomic segments; t, time points; m, epigenomic marks; and k, epigenomic clusters. Observed data are as follows: W, the number of genomic segments; M, the number of epigenomic marks; T, the number of time points; and v, normalized sequence counts. Note that vw,t,m is the normalized sequence count for epigenomic mark m in genomic segment w at time t. O is all the observed data. Hidden variables are as follows: Cw, cluster membership of the genomic segment w; H, activity states, taking values 0 or 1. Precomputed parameters are as follows: K, the number of epigenomic clusters. Model parameters are as follows: πk, the proportion of genomic segments in cluster k; bi,j, transition probability from state i to state j; λ, the Poisson parameter for emission probabilities; and Λ, all the model parameters.
The model
The GATE model is a hierarchical model with two layers (Fig. 1B). The top layer is a FMM, in which each component of the mixture represents a cluster of genomic segments that share temporal epigenomic patterns. The bottom layer models the time-course epigenomic data in each cluster. Each cluster is modeled as a HMM with the hidden states representing the changes of regulatory activities during a differentiation process, which emit the observed epigenomic data at each time point. Overall, GATE is a finite mixture of HMMs.
The top layer
The top layer FMM models the cluster memberships of every genomic segment. The cluster membership of genomic segment w is modeled as a categorical distribution with probability π = (π1,…,πK):
The HMM at the bottom layer
Given the cluster membership Cw, the potential changes of regulatory activities for genomic segment w are modeled as a Markov chain. As a hidden variable, Hw,t ∈ (0,1) represents the activity state of genomic segment w at time t.
The transition probability matrix  is written as
The conditional probability of Hw given Cw is
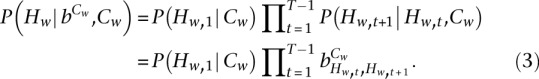 |
Given the hidden variable, the observed sequence count for each epigenomic mark is modeled to follow a Poisson distribution (emission distribution). The Poisson parameter depends on the cluster membership and the hidden regulatory state.
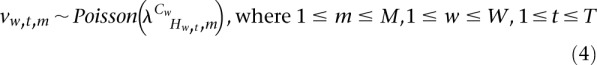 |
Conditional on the cluster membership and the hidden variable, the different epigenomic marks are modeled as independent, and thus
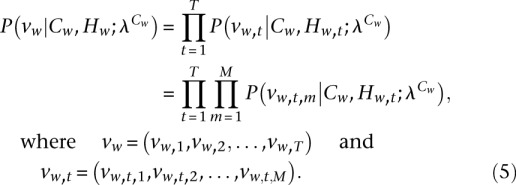 |
Thus, a generative probabilistic model for all data has been fully specified.
Likelihood function
Under model assumptions, the likelihood function of observed data (O) is
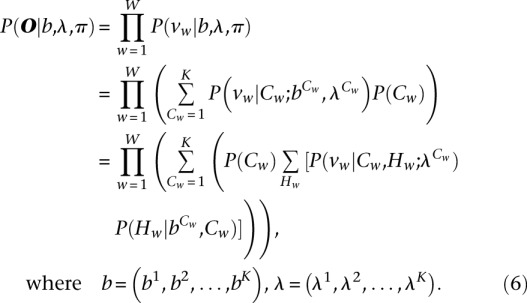 |
Parameter inference
The hidden variables of interest (C, H) were estimated by maximum likelihood estimation. We implemented a nested EM algorithm in which the transition and emission parameters of the HMM were estimated by a Baum-Welch algorithm (Supplemental Fig. S1; Supplemental Methods).
Fitting data to the GATE model
For simulation data, the cluster number (K) was estimated by the Bayesian information criteria (BIC):
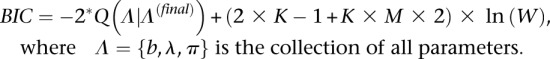 |
For real data, we initial run the model with a relatively large cluster number (55), which was estimated from a previous study. The model-generated clusters were then merged into larger groups based on hierarchical clustering (Supplemental Fig. S3). We set the hidden state at the first time point as 0. We set 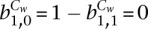 , because it is unlikely to make two switches of regulatory states within this short differentiation time course.
Maintenance of ES cells
Undifferentiated mouse E14 ES cells were cultured under feeder-free conditions. ES cells were plated on gelatin-coated dishes with Dulbecco's modified Eagle medium (DMEM; GIBCO), supplemented with 15% heat-inactivated fetal bovine serum (FBS; GIBCO), 0.055 mM mercaptoethanol (2-ME; GIBCO), 2 mM L-glutamine, 0.1 mM MEM nonessential amino acid, 5000 units/mL penicillin/streptomycin, and 1000 units/mL of LIF (Millipore ESG1107) at 37°C in 5% CO2 (Li et al. 2011).
Differentiation of ES cells into mesendoderm
Guided differentiation of ES cells was performed according to the method previously described (Yasunaga et al. 2005). Briefly, 2 × 10⁵ cells were seeded on Collagen IV–coated 10-cm dishes (BD, 08-774-33) in serum-free medium ESF-B (Itochu Corporation), supplemented with 0.1% BSA, 50 μM 2-ME, and 10 ng/mL Activin A (R&D Systems). The culture medium was changed every day.
Reverse transcription polymerase chain reaction
Total RNA was extracted from cells 0, 4, and 6 d after induction of differentiation with TRIzol Reagent (Invitrogen, 15596-026) according to manufacturer's protocol. First-strand cDNA was prepared with M-MLV Synthesis System (New England Biolabs). Beta-actin was used as a control. Pluripotency and lineage-specific marker genes were assayed by the Applied Biosystems 7900HT Fast Real-Time PCR System. Primer sequences are listed in Supplemental Table S5. Gene expression levels were normalized to the expression level of beta-actin. Fold changes of gene expression levels were calculated between day 4 and day 0 and between day 6 and day 0.
Immunostaining
A total of 10,000–20,000 cells were seeded on Collagen IV–coated 35-mm dishes (Ibidi 45074) in the medium used for guided differentiation (ESF-B supplemented with 0.1% BSA, 50 μM 2-ME, and 10 ng/mL Activin A). Cells were fixed in 4% paraformaldehyde. Primary antibodies against GSC (Origene, TA500087) and Sox17 (Millipore 09-038) were mixed and applied to the fixed cells for 2 h at 37°C. The goat anti-mouse IgG antibody conjugated with Alexa 568 (Invitrogen A-11031) and the goat anti-rabbit IgG antibody conjugated with Alexa 488 (Invitrogen A-11034) were sequentially applied to the samples, each for 2 h at 37°C, as secondary antibodies. Cellular nuclei were stained by Hoechst 33342 (Invitrogen, H3570) for 15 min at room temperature. Images were obtained using the LSM 700 microscope (Zeiss).
Chromatin immunoprecipitation
Cells were fixed with 1% formaldehyde for 10 min at room temperature. Fixation was inactivated by the addition of 125 mM glycine. Cells were scraped off of dishes and collected by centrifugation. Cross-linked chromatin–DNA complexes were isolated from the nuclei lysis buffer and then sonicated into fragments of a size range between 350 and 600 nt. Specific antibodies listed below were incubated with the solubilized DNA fragments at 4°C overnight.
Antibodies used in this work are as follows: anti-histone H2A.Z antibody, ChIP Grade (Abcam, ab4174); anti-histone H3 (mono methyl K4) antibody, ChIP Grade (ab8895); anti-histone H3 (di methyl K4) antibody [Y47], ChIP Grade (ab32356); anti-histone H3 (tri methyl K4) antibody, ChIP Grade (ab1012); anti-histone H3 (tri methyl K4) antibody, ChIP Grade (ab8580); anti-histone H3 (tri methyl K36) antibody, ChIP Grade (ab9050); anti-histone H3 (acetyl K27) antibody, ChIP Grade (ab4729); anti-H3K27me3 antibody (Millipore, 07-449); and a monoclonal antibody against 5-methylcytindine (Eurogentec, bi-mecy-0100).
Antibody–chromatin complexes were captured by protein A/G Agarose beads (Pierce) and eluted with 1% SDS after extensive washing. The cross-link between DNA and chromatin proteins was reversed by incubation in 20 mM NaCl overnight at 65°C. DNA was purified by QIAquick PCR Purification Kit (Qiagen 28106) and dissolved into 30 μL TE buffer per immunoprecipitation.
MRE-seq, MeDIP-seq, and 5-hmC-seq
MRE-seq and MeDIP-seq were performed according to the method previously described (Maunakea et al. 2010). Sample DNA was digested in parallel using HpaII, Hin6I, SsiI (Fermentas), and HpyCH4IV (New England Biolabs) before deep sequencing.
5-hmC-seq was performed according to the method previously described (Song et al. 2011). 5-hmC was chemically labeled as selected. Sequencing libraries were constructed using the same protocol as ChIP-seq (Illumina 2010a).
Small RNA sequencing
Total RNA was purified with TRIzol Reagent (Invitrogen 15596-026) and used as an input to generate a small RNA library using True-seq small RNA kit (Illumina RS-200-0012). The RNA 3′ adapters in this kit were specifically modified to target miRNAs and other small RNAs that have a 3′ hydroxyl group resulting from enzymatic cleavage by Dicer or other RNA processing enzymes. Library products ranging from 145–160 nt were collected and amplified. The libraries were quantitated by qPCR, and subsequently sequenced on a HiSeq2000 sequencer using TruSeq SBS sequencing kit version 2 and analyzed with pipeline version 1.8 (Illumina).
Data access
All sequencing data are accessible from the NCBI Gene Expression Omnibus (GEO) (http://www.ncbi.nlm.nih.gov/geo/) under SuperSeries accession no. GSE38596.
Acknowledgments
We thank Dr. Alvaro Hernandez for useful discussions. This work was supported by NIH DP2OD007417, NSF DBI 0845823, Sloan Research Fellowship to S.Z., March of Dimes Foundation, Edward Jr. Mallinckrodt Foundation to T.W., NIH R01HG006827 to C.H., and American Cancer Society Illinois 207962 to T.T.
Footnotes
[Supplemental material is available for this article.]
Article published online before print. Article, supplemental material, and publication date are at http://www.genome.org/cgi/doi/10.1101/gr.144949.112.
References
- Beer MA, Tavazoie S 2004. Predicting gene expression from sequence. Cell 117: 185–198 [DOI] [PubMed] [Google Scholar]
- Bernstein BE, Meissner A, Lander ES 2007. The mammalian epigenome. Cell 128: 669–681 [DOI] [PubMed] [Google Scholar]
- Bhutani N, Burns DM, Blau HM 2011. DNA demethylation dynamics. Cell 146: 866–872 [DOI] [PMC free article] [PubMed] [Google Scholar]
- Blum M, Gaunt SJ, Cho KW, Steinbeisser H, Blumberg B, Bittner D, De Robertis EM 1992. Gastrulation in the mouse: The role of the homeobox gene goosecoid. Cell 69: 1097–1106 [DOI] [PubMed] [Google Scholar]
- Booth MJ, Branco MR, Ficz G, Oxley D, Krueger F, Reik W, Balasubramanian S 2012. Quantitative sequencing of 5-methylcytosine and 5-hydroxymethylcytosine at single-base resolution. Science 336: 934–937 [DOI] [PubMed] [Google Scholar]
- Bruce SJ, Gardiner BB, Burke LJ, Gongora MM, Grimmond SM, Perkins AC 2007. Dynamic transcription programs during ES cell differentiation towards mesoderm in serum versus serum-freeBMP4 culture. BMC Genomics 8: 365 doi: 10.1186/1471-2164-8-365 [DOI] [PMC free article] [PubMed] [Google Scholar]
- Buchler NE, Gerland U, Hwa T 2003. On schemes of combinatorial transcription logic. Proc Natl Acad Sci 100: 5136–5141 [DOI] [PMC free article] [PubMed] [Google Scholar]
- Creyghton MP, Cheng AW, Welstead GG, Kooistra T, Carey BW, Steine EJ, Hanna J, Lodato MA, Frampton GM, Sharp PA, et al. 2010. Histone H3K27ac separates active from poised enhancers and predicts developmental state. Proc Natl Acad Sci 107: 21931–21936 [DOI] [PMC free article] [PubMed] [Google Scholar]
- Dempster AP, Laird NM, Rubin DB 1977. Maximum likelihood from incomplete data via the EM algorithm. J R Stat Soc (Ser A) 39: 1–38 [Google Scholar]
- Durbin R, Eddy SR, Krogh A, Mitchison G 1998. Biological sequence analysis. Cambridge University Press, Cambridge [Google Scholar]
- Equihua M 1988. Analysis of finite mixture of distributions: A statistical tool for biological classification problems. Comput Appl Biosci 4: 435–440 [DOI] [PubMed] [Google Scholar]
- Ernst J, Kellis M 2010. Discovery and characterization of chromatin states for systematic annotation of the human genome. Nat Biotechnol 28: 817–825 [DOI] [PMC free article] [PubMed] [Google Scholar]
- Ernst J, Kheradpour P, Mikkelsen TS, Shoresh N, Ward LD, Epstein CB, Zhang X, Wang L, Issner R, Coyne M, et al. 2011. Mapping and analysis of chromatin state dynamics in nine human cell types. Nature 473: 43–49 [DOI] [PMC free article] [PubMed] [Google Scholar]
- Ficz G, Branco MR, Seisenberger S, Santos F, Krueger F, Hore TA, Marques CJ, Andrews S, Reik W 2011. Dynamic regulation of 5-hydroxymethylcytosine in mouse ES cells and during differentiation. Nature 473: 398–402 [DOI] [PubMed] [Google Scholar]
- Frauer C, Rottach A, Meilinger D, Bultmann S, Fellinger K, Hasenoder S, Wang M, Qin W, Soding J, Spada F, et al. 2011. Different binding properties and function of CXXC zinc finger domains in Dnmt1 and Tet1. PLoS ONE 6: e16627 doi: 10.1371/journal.pone.0016627 [DOI] [PMC free article] [PubMed] [Google Scholar]
- Hakkinen A, Healy S, Jacobs HT, Ribeiro AS 2011. Genome wide study of NF-Y type CCAAT boxes in unidirectional and bidirectional promoters in human and mouse. J Theor Biol 281: 74–83 [DOI] [PubMed] [Google Scholar]
- Hawkins RD, Hon GC, Lee LK, Ngo Q, Lister R, Pelizzola M, Edsall LE, Kuan S, Luu Y, Klugman S, et al. 2010. Distinct epigenomic landscapes of pluripotent and lineage-committed human cells. Cell Stem Cell 6: 479–491 [DOI] [PMC free article] [PubMed] [Google Scholar]
- Hawkins RD, Hon GC, Yang CH, Antosiewicz-Bourget JE, Lee LK, Ngo QM, Klugman S, Ching KA, Edsall LE, Ye Z, et al. 2011. Dynamic chromatin states in human ES cells reveal potential regulatory sequences and genes involved in pluripotency. Cell Res 21: 1393–1409 [DOI] [PMC free article] [PubMed] [Google Scholar]
- He X, Chen CC, Hong F, Fang F, Sinha S, Ng HH, Zhong S 2009. A biophysical model for analysis of transcription factor interaction and binding site arrangement from genome-wide binding data. PLoS ONE 4: e8155 doi: 10.1371/journal.pone.0008155 [DOI] [PMC free article] [PubMed] [Google Scholar]
- Illumina 2010a. TruSeq DNA sample preparation guide. http://www.illumina.com [Google Scholar]
- Illumina 2010b. TruSeq small RNA sample preparation guide. http://www.illumina.com [Google Scholar]
- Ito S, D'Alessio AC, Taranova OV, Hong K, Sowers LC, Zhang Y 2010. Role of Tet proteins in 5mC to 5hmC conversion, ES-cell self-renewal and inner cell mass specification. Nature 466: 1129–1151 [DOI] [PMC free article] [PubMed] [Google Scholar]
- Kanai-Azuma M, Kanai Y, Gad JM, Tajima Y, Taya C, Kurohmaru M, Sanai Y, Yonekawa H, Yazaki K, Tam PPL, et al. 2002. Depletion of definitive gut endoderm in Sox17-null mutant mice. Development 129: 2367–2379 [DOI] [PubMed] [Google Scholar]
- Karlic R, Chung HR, Lasserre J, Vlahovicek K, Vingron M 2010. Histone modification levels are predictive for gene expression. Proc Natl Acad Sci 107: 2926–2931 [DOI] [PMC free article] [PubMed] [Google Scholar]
- Kolasinska-Zwierz P, Down T, Latorre I, Liu T, Liu XS, Ahringer J 2009. Differential chromatin marking of introns and expressed exons by H3K36me3. Nat Genet 41: 376–381 [DOI] [PMC free article] [PubMed] [Google Scholar]
- Lees-Murdock DJ, Shovlin TC, Gardiner T, De Felici M, Walsh CP 2005. DNA methyltransferase expression in the mouse germ line during periods of de novo methylation. Dev Dyn 232: 992–1002 [DOI] [PubMed] [Google Scholar]
- Li Y, Yokohama-Tamaki T, Tanaka TS 2011. Short-term serum-free culture reveals that inhibition of Gsk3β induces the tumor-like growth of mouse embryonic stem cells. PLoS ONE 6: e21355 doi: 10.1371/journal.pone.0021355 [DOI] [PMC free article] [PubMed] [Google Scholar]
- Lin JM, Collins PJ, Trinklein ND, Fu YT, Xi HL, Myers RM, Weng ZP 2007. Transcription factor binding and modified histones in human bidirectional promoters. Genome Res 17: 818–827 [DOI] [PMC free article] [PubMed] [Google Scholar]
- MacIsaac KD, Lo KA, Gordon W, Motola S, Mazor T, Fraenkel E 2010. A quantitative model of transcriptional regulation reveals the influence of binding location on expression. PLoS Comput Biol 6: e1000773 doi: 10.1371/journal.pcbi.1000773 [DOI] [PMC free article] [PubMed] [Google Scholar]
- Marson A, Levine SS, Cole MF, Frampton GM, Brambrink T, Johnstone S, Guenther MG, Johnston WK, Wernig M, Newman J, et al. 2008. Connecting microRNA genes to the core transcriptional regulatory circuitry of embryonic stem cells. Cell 134: 521–533 [DOI] [PMC free article] [PubMed] [Google Scholar]
- Maunakea AK, Nagarajan RP, Bilenky M, Ballinger TJ, D'Souza C, Fouse SD, Johnson BE, Hong CB, Nielsen C, Zhao YJ, et al. 2010. Conserved role of intragenic DNA methylation in regulating alternative promoters. Nature 466: 253–257 [DOI] [PMC free article] [PubMed] [Google Scholar]
- Mortazavi A, Williams BA, McCue K, Schaeffer L, Wold B 2008. Mapping and quantifying mammalian transcriptomes by RNA-Seq. Nat Methods 5: 621–628 [DOI] [PubMed] [Google Scholar]
- Niakan KK, Ji H, Maehr R, Vokes SA, Rodolfa KT, Sherwood RI, Yamaki M, Dimos JT, Chen AE, Melton DA, et al. 2010. Sox17 promotes differentiation in mouse embryonic stem cells by directly regulating extraembryonic gene expression and indirectly antagonizing self-renewal. Genes Dev 24: 312–326 [DOI] [PMC free article] [PubMed] [Google Scholar]
- Pastor WA, Pape UJ, Huang Y, Henderson HR, Lister R, Ko M, McLoughlin EM, Brudno Y, Mahapatra S, Kapranov P, et al. 2011. Genome-wide mapping of 5-hydroxymethylcytosine in embryonic stem cells. Nature 473: 394–397 [DOI] [PMC free article] [PubMed] [Google Scholar]
- Pearl J. 1985 Bayesian networks: A model of self-activated memory for evidential reasoning. In 7th Conference of the Cognitive Science Society, p. 6. University of California, Los Angeles. [Google Scholar]
- Rada-Iglesias A, Bajpai R, Swigut T, Brugmann SA, Flynn RA, Wysocka J 2011. A unique chromatin signature uncovers early developmental enhancers in humans. Nature 470: 279–283 [DOI] [PMC free article] [PubMed] [Google Scholar]
- Raisner RM, Hartley PD, Meneghini MD, Bao MZ, Liu CL, Schreiber SL, Rando OJ, Madhani HD 2005. Histone variant H2A.Z marks the 5′ ends of both active and inactive genes in euchromatin. Cell 123: 233–248 [DOI] [PMC free article] [PubMed] [Google Scholar]
- Schwartz S, Meshorer E, Ast G 2009. Chromatin organization marks exon-intron structure. Nat Struct Mol Biol 16: 990–995 [DOI] [PubMed] [Google Scholar]
- Song CX, Szulwach KE, Fu Y, Dai Q, Yi CQ, Li XK, Li YJ, Chen CH, Zhang W, Jian X, et al. 2011. Selective chemical labeling reveals the genome-wide distribution of 5-hydroxymethylcytosine. Nat Biotechnol 29: 68–72 [DOI] [PMC free article] [PubMed] [Google Scholar]
- Stroud H, Feng S, Morey Kinney S, Pradhan S, Jacobsen SE 2011. 5-Hydroxymethylcytosine is associated with enhancers and gene bodies in human embryonic stem cells. Genome Biol 12: R54 doi: 10.1186/gb-2011-12-6-r54 [DOI] [PMC free article] [PubMed] [Google Scholar]
- Tahiliani M, Koh KP, Shen Y, Pastor WA, Bandukwala H, Brudno Y, Agarwal S, Iyer LM, Liu DR, Aravind L, et al. 2009. Conversion of 5-methylcytosine to 5-hydroxymethylcytosine in mammalian DNA by MLL partner TET1. Science 324: 930–935 [DOI] [PMC free article] [PubMed] [Google Scholar]
- Thomson T, Lin H 2009. The biogenesis and function of PIWI proteins and piRNAs: progress and prospect. Annu Rev Cell Dev Biol 25: 355–376 [DOI] [PMC free article] [PubMed] [Google Scholar]
- Tomizawa S, Kobayashi H, Watanabe T, Andrews S, Hata K, Kelsey G, Sasaki H 2011. Dynamic stage-specific changes in imprinted differentially methylated regions during early mammalian development and prevalence of non-CpG methylation in oocytes. Development 138: 811–820 [DOI] [PMC free article] [PubMed] [Google Scholar]
- Wu H, D'Alessio AC, Ito S, Wang ZB, Cui KR, Zhao KJ, Sun YE, Zhang Y 2011a. Genome-wide analysis of 5-hydroxymethylcytosine distribution reveals its dual function in transcriptional regulation in mouse embryonic stem cells. Genes Dev 25: 679–684 [DOI] [PMC free article] [PubMed] [Google Scholar]
- Wu W, Cheng Y, Keller CA, Ernst J, Kumar SA, Mishra T, Morrissey C, Dorman CM, Chen KB, Drautz D, et al. 2011b. Dynamics of the epigenetic landscape during erythroid differentiation after GATA1 restoration. Genome Res 21: 1659–1671 [DOI] [PMC free article] [PubMed] [Google Scholar]
- Wyatt GR, Cohen SS 1952. A new pyrimidine base from bacteriophage nucleic acids. Nature 170: 1072–1073 [DOI] [PubMed] [Google Scholar]
- Xiao S, Xie D, Cao X, Yu P, Xing X, Chen CC, Musselman M, Xie M, West FD, Lewin HA, et al. 2012. Comparative epigenomic annotation of regulatory DNA. Cell 149: 1381–1392 [DOI] [PMC free article] [PubMed] [Google Scholar]
- Yasunaga M, Tada S, Torikai-Nishikawa S, Nakano Y, Okada M, Jakt LM, Nishikawa S, Chiba T, Era T 2005. Induction and monitoring of definitive and visceral endoderm differentiation of mouse ES cells. Nat Biotechnol 23: 1542–1550 [DOI] [PubMed] [Google Scholar]
- Yu M, Hon GC, Szulwach KE, Song CX, Zhang L, Kim A, Li X, Dai Q, Shen Y, Park B, et al. 2012. Base-resolution analysis of 5-hydroxymethylcytosine in the mammalian genome. Cell 149: 1368–1380 [DOI] [PMC free article] [PubMed] [Google Scholar]