

Abstract
We present an integrative approach, SeqFold, that combines high-throughput RNA structure profiling data with computational prediction for genome-scale reconstruction of RNA secondary structures. SeqFold transforms experimental RNA structure information into a structure preference profile (SPP) and uses it to select stable RNA structure candidates representing the structure ensemble. Under a high-dimensional classification framework, SeqFold efficiently matches a given SPP to the most likely cluster of structures sampled from the Boltzmann-weighted ensemble. SeqFold is able to incorporate diverse types of RNA structure profiling data, including parallel analysis of RNA structure (PARS), selective 2′-hydroxyl acylation analyzed by primer extension sequencing (SHAPE-Seq), fragmentation sequencing (FragSeq) data generated by deep sequencing, and conventional SHAPE data. Using the known structures of a wide range of mRNAs and noncoding RNAs as benchmarks, we demonstrate that SeqFold outperforms or matches existing approaches in accuracy and is more robust to noise in experimental data. Application of SeqFold to reconstruct the secondary structures of the yeast transcriptome reveals the diverse impact of RNA secondary structure on gene regulation, including translation efficiency, transcription initiation, and protein-RNA interactions. SeqFold can be easily adapted to incorporate any new types of high-throughput RNA structure profiling data and is widely applicable to analyze RNA structures in any transcriptome.
Regulatory information in RNA is encoded not only in its primary sequence but also in its structure with complex base pairing patterns. Virtually every step in the gene expression program, from transcription to splicing and translation, is influenced by RNA structure. Precise mapping of the RNA structure is essential for understanding the functions of RNAs, especially for the large set of functionally uncharacterized noncoding RNAs (ncRNAs) (Wan et al. 2011). Experimental methods for RNA structure determination include X-ray crystallography (Guo et al. 2004), NMR (Latham et al. 2005), cryo-electron microscopy (Mueller et al. 2000), and chemical and enzymatic probing (Romaniuk et al. 1988; Brenowitz et al. 2002; Alkemar and Nygard 2006; Das et al. 2008; Mitra et al. 2008). Although quite accurate, these methods are traditionally only applicable to analyze a single RNA per experiment and limited in the length of the probed RNA. Computational methods, aiming at predicting RNA structure from primary sequence, have been developed and can be applied to a large number of RNAs with the increasing computational power (Hofacker et al. 1994; Mathews et al. 1999; Ding and Lawrence 2003; Zuker 2003). However, in silico algorithms have variable accuracy and may be limited by the scope of applicability under real experimental conditions.
To overcome these limitations, we and others have developed high-throughput experimental methodologies for in vitro profiling of many RNA structures simultaneously, termed the RNA structurome (Kertesz et al. 2010; Underwood et al. 2010; Lucks et al. 2011; Li et al. 2012; Wan et al. 2012). In Parallel Analysis of RNA Structure (PARS), precise RNA fragments generated by single-strand specific enzyme S1 and double-strand specific enzyme V1 are read out by deep sequencing (Kertesz et al. 2010). PARS of the yeast transcriptome generated structure profiles of more than 3000 transcripts. A similar approach applied high-throughput sequencing to fragments generated by single-strand specific nuclease P1 (FragSeq), which was applied to mouse ncRNAs in two cell types (Underwood et al. 2010). The selective 2′-hydroxyl acylation analyzed by primer extension (SHAPE) chemistry, combined with multiplexed bar coding and next generation sequencing (SHAPE-Seq), was able to measure the structures of a complex pool of RNAs (Lucks et al. 2011). These high-throughput RNA structure profiling technologies provide quantitative information of RNA pairing at nucleotide resolution. However, each data set has been analyzed by different methods by the authors, and no current method allows automated analysis and comparison across different RNA structurome experiments.
The advent of high-throughput RNA structure profiling challenges existing approaches for integrative prediction of RNA secondary structures. For instance, the RNAstructure (Mathews et al. 1999) program, initially developed for computational prediction of RNA secondary structure using the minimal free energy (MFE) principle, proposed to model SHAPE reactivity as pseudo-free energy to constrain RNA folding. It demonstrated considerable improvement over MFE when applied to certain RNAs with focused SHAPE experiments (Deigan et al. 2009; Watts et al. 2009). Nevertheless, high-throughput RNA profiling data poses two important challenges for extant methods. First, current analytic methods assume the availability of very dense experimental data—nearly every base of short RNAs to be modeled—whereas genome-scale RNA accessibility data show much sparser coverage of data points per transcript for thousands of full-length transcripts. Notably, recent analyses indicate that even dozens of focused SHAPE experiments on individual RNAs may not generate sufficient data density for such modeling strategies, leading to considerable modeling errors when compared to known structures (Kladwang et al. 2011). Second, the applicability of current integrative methods is limited by the scalability to the whole transcriptome. For example, the SHAPE pseudo-free energy term relies on adjustable parameters because of its nonphysical nature. With the availability of high-throughput experimental data, the current challenge is to scale up the integration to the genome-scale. Ideally, the integrative strategy should take potentially noisy experimental data directly as input without manual curation.
We describe a systematic method, called SeqFold, that efficiently leverages high-throughput RNA structure profiling information into computational modeling. As shown by Quarrier et al. (2010), the use of experimental data to select structures from the Boltzmann-weighted ensemble (Ding and Lawrence 2003) rather than to constrain free energy minimization enables structure modeling to be more robust to noise. This may be especially important for genome-scale experiments in which a large amount of noise is inevitably produced. Here we extend this concept with a key modification suitable for transcriptomic data. Our method differs from Quarrier et al.'s (2010) “sample and select” approach by the choice of candidate structures to be selected. The “sample and select” approach selects individual structures directly sampled from the Boltzmann-weighted ensemble. In reality, the number of possible structures increases exponentially along with the length of RNAs, leading to an RNA of n nucleotides having 1.8n possible secondary structures (Zuker and Sankoff 1984). Thus, exploration of the entire sample space would require huge computational resources that are beyond current state-of-the-art computational power. Importantly, Ding et al. (2005) showed that Boltzmann-weighted ensembles of RNA secondary structures often have multiple (3.2 on average) clusters, and the centroids of structure clusters are statistically reproducible with a sample size of 1000. Strikingly, the centroid of the cluster nearest to the known reference structure is a substantially improved structure prediction over MFE prediction (Ding et al. 2005, 2006). However, computational approaches have failed to identify which of the clusters is closest to the known reference structure. This motivates us to use genome-wide experimental data to choose among candidate clusters.
We implement the SeqFold algorithm to predict RNA secondary structure incorporating current high-throughput RNA structure profiling data, such as PARS, FragSeq, SHAPE-Seq, and conventional SHAPE data. We apply SeqFold to predict RNA secondary structures of the yeast transcriptome. Analysis of the structural profile output of SeqFold reveals the diverse roles of RNA secondary structure in translation efficiency, transcription initiation, and identification of RNA binding protein (RBP) targets. SeqFold can be freely downloaded from http://www.stanford.edu/∼zouyang/seqfold.
Results
The framework of SeqFold
We illustrated the strategy of SeqFold for RNA structure prediction in Figure 1A. Firstly, it standardizes experimental signals from RNA structure profiling data into the interval of [0, 1] for all the bases of a given RNA. The standardized values are called structural preference profile (SPP). A base with structural preference close to 0 suggests higher probability to be double-stranded, and that close to 1 is likely to be single-stranded. SeqFold uses standard parameters to infer SPP from PARS, SHAPE, and FragSeq data (Methods). It then uses the parameter-free nearest neighbor algorithm to classify the SPP into a unique cluster of computationally sampled structures from the structure ensemble.
Figure 1.

Framework of the SeqFold method. (A) The flowchart of integrated prediction of RNA secondary structure. On one hand, sequencing reads that contain RNA structure information are mapped, followed by the inference of structure preference for each base. The structure preferences of all informative bases of a transcript define the structure preference profile (SPP). On the other hand, 1000 structures per transcript are generated from the Sfold Boltzman sampling procedure and grouped into distinct clusters (Ding and Lawrence 2003; Ding et al. 2005, 2006). At the structure prediction stage, nearest neighbor classification is used to identify a specific structure cluster given an SPP. The centroid of the selected cluster is taken as the predicted structure and the average of the sample structures in the cluster gives the accessibility of each base. The bottom panel demonstrates the clustering pattern in the multidimensional scaling surface. (B–F) Illustration of the SPP calling process for PARS. (B) The read counts of RNase S1 and V1 along the P9-9.2 domain of the Tetrahymena ribozyme (Guo et al. 2004). C as B showing a maximal read count of 2000. D as B showing a maximal read count of 200. (E) The (1 - P-value) profile of hypergeometric test for each base. (F) Structure preference calls with FDR 0.05.
Taking the PARS data as an example, suppose sequencing reads were generated from single-strand specific RNase S1 and double-strand specific RNase V1. After reads were mapped, the counts of the 5′ end of S1 and V1 reads were obtained for each base. Both the S1 and V1 read count profiles show great variability across the whole transcript body (Fig. 1B), reflecting both structural information and potential noise in PARS experiments. Zooming in the PARS signals (Fig. 1C,D) reveals that comparison of the S1 and V1 read counts at each base subtracts out the noise and gives the structural preference at the individual nucleotide level. Based on the discrete nature of read counts, we used the hypergeometric test to assess the deviation of S1 and V1 read counts at each base from equality, adjusted for the total mapped reads from each sequencing library (Methods). The test provided statistical significance of the propensity that each base is single- or double-stranded (Fig. 1E). The SPP of each transcript was then generated (Fig. 1F) with a standard false discovery rate (Benjamini and Hochberg 1995) of 5% (FDR = 0.05).
In parallel, we used Sfold (Ding and Lawrence 2003) to generate structure clusters from 1000 sample structures from the Boltzmann-weighted ensemble (Methods) for each RNA. The centroid of the selected cluster (using the calculated SPP) was taken as the predicted RNA secondary structure. Additionally, we estimated RNA accessibility by averaging the sample structures in the selected cluster to generate the probability of a base being unpaired. The estimated accessibility profiles show a high correspondence with the SPPs; that is, bases with the single-stranded (or double-stranded) preference have high (or low) average accessibilities (Supplemental Fig. S1).
Assessment of SeqFold prediction incorporating PARS data
We first evaluated the performance of SeqFold with the incorporation of PARS data. RNAstructure (Mathews et al. 1999) with default parameters was used to generate MFE structures as a baseline. We also evaluated our own genome-scale implementation of “sample and select,” which was developed for traditional structure mapping experiments (Quarrier et al. 2010). For “sample and select,” we used Sfold (Ding and Lawrence 2003) to generate 1000 sample structures and selected the one with the lowest Manhattan distance to the SPPs. We did not see any evident improvement of the “sample and select” predictions by increasing the sample size up to 1 million (Fig. 3C,D, see below). For each predicted structure, we calculated the sensitivity and positive predictive value (PPV) by comparing it with the reference structures. Sensitivity measures the percentage of base pairs in the known structures that are also present in the predicted structures, whereas PPV measures the percentage of base pairs in the predicted structures that are also found in the reference structures.
Figure 3.

Comparison of the robustness of RNA secondary structure prediction methods on PARS and SHAPE data. (A) The mean prediction accuracy measured by Matthews correlation coefficient (MCC) for RNAstructure MFE, “sample and select,” and SeqFold with increasing fractions of PARS data being replaced by randomized signals. (B) The mean MCC for RNAstructure MFE, RNAstructure pseudo-energy, “sample and select,” and SeqFold with increasing fractions of SHAPE data being replaced by randomized signals. (C) The mean MCC of the “sample and select” predictions for PARS data by sampling structures in the order of 1000, 10,000, 100,000, and 1,000,000. (D) The mean MCC of the “sample and select” predictions for SHAPE data by sampling structures in the order of 1000, 10,000, 100,000, and 1,000,000. The bars in each plot indicate the standard error of the mean MCC.
We summarized the prediction accuracies of all three approaches on a number of known RNA secondary structures with PARS data in Table 1. We found overall SeqFold predictions are most accurate among the three. For instance, the secondary structure of Tetrahymena ribozyme is known from its crystal structure (Guo et al. 2004), and its P9-9.2 domain was added into the PARS experiment (Kertesz et al. 2010). Both the MFE prediction (sensitivity = 1 and PPV = 0.91) and the “sample and select” prediction (sensitivity = 0.87 and PPV = 0.87) show obvious distinction to the known structure, whereas the SeqFold prediction (sensitivity = 1 and PPV = 0.97) is much closer (Fig. 2A). The ASH1 mRNA contains several domains where the secondary structures are important for its subcellular localization (Chartrand et al. 2002). Extensive mutagenesis previously identified specific stem-loops with a big bulge in the E1 domain (Chartrand et al. 1999; Gonzalez et al. 1999). The MFE prediction (sensitivity = 0.41 and PPV = 0.44) is far from the known structure. The “sample and select” approach identified multiple secondary structures with equal distance to the PARS signal with sensitivity ranging from 0.29 to 0.41 and PPV from 0.50 to 1. The SeqFold prediction (sensitivity = 0.65 and PPV = 1) shows improvement on even the best “sample and select” prediction (Fig. 2B).
Table 1.
Comparison of RNA secondary structure prediction algorithms with PARS data
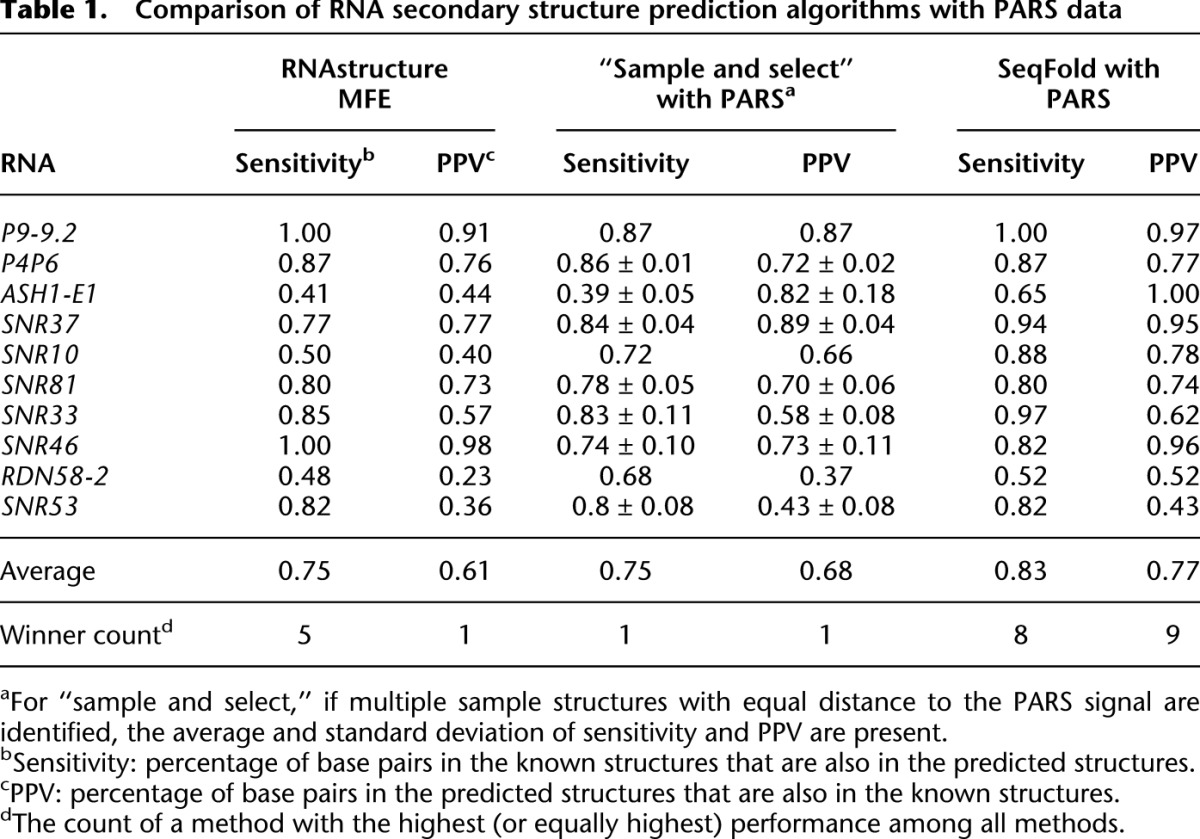
Figure 2.

Comparison of RNA secondary structure prediction methods with PARS data. For each RNA, the reference secondary structure, the RNAstructure MFE prediction, the “sample and select” prediction with PARS, and the SeqFold prediction with PARS are shown. (A) The P9-9.2 domain of the Tetrahymena ribozyme (Guo et al. 2004). (B) The E1 domain of the ASH1 mRNA (Chartrand et al. 2002). (C) The noncoding RNA SNR10. In the case that the “sample and select” algorithm outputs alternative structure models, the one most matching the reference structures is presented. For each predicted secondary structure, the red bases correspond to errors compared to the reference structures.
Further, we tested the ability of SeqFold in predicting ncRNA secondary structures with PARS data. The Rfam database (Griffiths-Jones et al. 2003) collects seed structures from literature and uses the so-called covariance model (CM) (Eddy and Durbin 1994) to iteratively align ncRNAs to a large family of RNAs based on evolutionary signature of both the sequence and structure similarity. CM is considered one of the most accurate prediction methods, but it requires large numbers of orthologous sequences that can be unambiguously aligned. Evaluating the CM model-based secondary structures, we found SeqFold achieves the highest prediction accuracies among the three approaches (Table 1). As an example, the CM-based secondary structures and the predicted structures of SNR10 are shown in Figure 2C. The sensitivity/PPV of the SeqFold prediction is 0.88/0.78, whereas those of the MFE and “sample and select” predictions are 0.50/0.40 and 0.72/0.66, respectively.
Overall, SeqFold (average sensitivity = 0.83 and average PPV = 0.77) outperforms “sample and select” (average sensitivity = 0.75 and average PPV = 0.68) with genome-scale PARS data. The improvement of SeqFold over “sample and select” is statistically significant (P-value = 0.031 for sensitivity and P-value = 0.001 for PPV, one-tailed paired t-test).
Application of SeqFold to other RNA structure profiling data
We also assessed the ability of SeqFold as a general method to incorporate other high-throughput RNA structure profiling data. The outputs of different structure profiling platforms are very diverse. We leveraged the methods developed for processing the raw data of different experimental platforms, such as SHAPE-Seq (Aviran et al. 2011), conventional SHAPE (Low and Weeks 2010), and FragSeq (Underwood et al. 2010). We then standardized the processed data into the interval of [0, 1] to estimate SPPs and used SeqFold for integrative prediction (Methods).
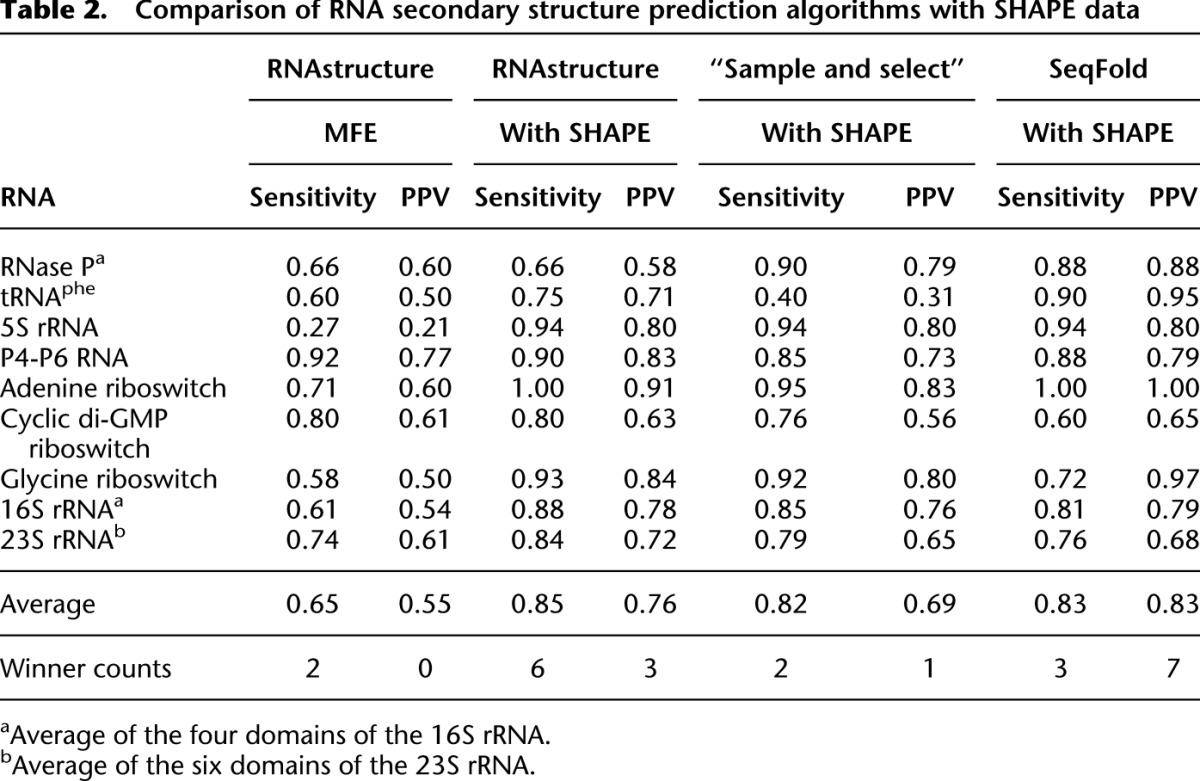
For SHAPE-Seq, a maximum likelihood approach was proposed to process the sequencing reads and estimate the SHAPE reactivity profile, where bases with high reactivities are interpreted as more likely to be single-stranded. (Aviran et al. 2011). The B. subtilis RNase P was probed by SHAPE-Seq, and it was proposed to use RNAstructure to make a constrained prediction of its secondary structure using pseudo-energy terms transformed from SHAPE reactivities (Lucks et al. 2011). We reapplied RNAstructure to predict the MFE structure and SHAPE-constrained structure for RNase P using default parameters. We also predicted secondary structures by the “sample and select” and SeqFold approaches using the SHAPE-derived SPP. The known secondary structure of RNase P was derived from the crystallography structure (Krasilnikov et al. 2003) with noncanonical base pairs filtered. Comparing to the known structure, RNAstructure with or without SHAPE had modest accuracy (sensitivity = 0.66 or 0.66, PPV = 0.60 or 0.58), whereas “sample and select” and SeqFold achieved 0.90 and 0.88 sensitivity and 0.79 and 0.88 PPV, respectively—a 32%–52% increase in performance.
We compared SeqFold and RNAstructure with or without SHAPE reactivity on additional benchmark RNAs with conventional SHAPE data from Kladwang et al. (2011) and the RMDB database (Cordero et al. 2012). We observed substantial improvement of RNA secondary structure prediction incorporating SHAPE data in RNAstructure and SeqFold over the MFE approach (Table 2). We found that SeqFold is more accurate than “sample and select” and has comparable accuracy to RNAstructure, the established method optimized for SHAPE data. Although RNAstructure has higher sensitivity, SeqFold is better in terms of PPV on this data set. In addition, we assessed all the methods on the E. coli 16S and 23 rRNAs which include some longer domains of ∼600 nt (Mathews et al. 1999). With SHAPE data from Deigan et al. (2009) in which the RNA structure algorithm was trained, we found that SeqFold and “sample and select” have similar accuracy (Table 2). Due to limited data available for structured long RNAs as benchmarks, the performance of the RNA secondary structure prediction methods as a function of RNA length is not conclusively demonstrated.
Table 2.
Comparison of RNA secondary structure prediction algorithms with SHAPE data
Finally, we applied SeqFold to the FragSeq data from mouse embryonic stem cells (Underwood et al. 2010). As shown in Supplemental Figure S2, SeqFold successfully generated structure predictions incorporating FragSeq data. As prior work fitted FragSeq data to known structures and did not report the accuracy of RNA structure prediction using FragSeq data (Underwood et al. 2010), our results illustrate the generality of the SeqFold approach.
Robustness of RNA structure prediction methods incorporating experimental data
We systematically compared the different RNA secondary structure prediction methods regarding their robustness to noise in RNA structure profiling data. To simulate noise level in experimental data, we randomly selected increasing fractions of data points and randomized signals in those fractions. We then asked how sensitive the performance of each method is to noise. At each noise level, we calculated the Matthew's correlation coefficient (Baldi et al. 2000), a prediction accuracy measurement combining sensitivity and PPV for RNA structure comparisons (Gardner and Giegerich 2004). The MFE prediction without incorporating experimental data was compared as the baseline. At 20% noise level in PARS data, the “sample and select” prediction accuracy quickly drops below the MFE baseline, whereas SeqFold prediction is resistant to even 40% noise level and approaches the MFE baseline at higher noise levels (Fig. 3A). Similarly, SeqFold prediction is more robust to noise in SHAPE data than the “sample and select” approach (Fig. 3B). Strikingly, we found that RNAstructure is even more sensitive to noise in SHAPE data and suffered in prediction accuracy much faster than other methods (Fig. 3B). These results suggest that the clustering and centroid selection step in SeqFold is important for handling noisy experimental data.
To further explore the value of clustering and centroid selection over direct structure selection, we increased the sample size for “sample and select” over three orders, from 1000 to 1,000,000. As shown in Figure 3, C and D, increasing the sample size even by three orders of magnitude did not improve the accuracy of structure prediction. In fact, the “sample and select” accuracy started to decline for PARS data. This is likely due to the noisy nature of genome-scale data, and direct selection from a large number of structures, including ones with low probability, may overfit to noise in the data. Thus, the results show that an exploration of the clustering features as in SeqFold rather than the number of structures is more effective.
SeqFold links RNA structure with function
Using SeqFold, we reconstructed the secondary structures of more than 3000 transcripts in yeast with the high-throughput PARS data (Supplemental Table S1). We sought to study the insight of such genome-scale RNA structure information on RNA processing and regulation.
RNA secondary structure has long been thought to play a role in mRNA translation (Kozak 2005). Although we observed a modest but statistically significant correlation (Kertesz et al. 2010) between the PARS signal and ribosome density (Ingolia et al. 2009), a proxy of translation efficiency, the strength of the connection is still unclear. As SeqFold improves RNA structure prediction, we reexamined this relationship using the SeqFold-derived RNA accessibility. In fact, we found a highly significant correlation (R = 0.2 and P = 5 × 10⁻²⁰) between RNA accessibility and ribosome density around the translation start sites (Fig. 4A), and the peak correlation locates approximately 10 bases upstream of the translation start site, the 5′ position of the occupancy site of the first ribosome in yeast (Ingolia et al. 2009). Compared to the PARS score, the SeqFold-derived RNA accessibility is much more widely correlated with the ribosome density—the RNA structure “footprint” extends from −40 to +40 nucleotides (Fig. 4A)—which enables a greater sensitivity in identifying biological signals in structure data. We further compared SeqFold to RNA accessibility estimation from RNAfold (Hofacker et al. 1994) without the incorporation of PARS data. Comparing to SeqFold, RNAfold-derived accessibility has a lower correlation with ribosome density (Fig. 4A). This suggests that incorporating experimental data gives more accurate estimation of RNA accessibility. Furthermore, prior studies have shown that RNA structure is not simply a reflection of GC content but also how the bases are arranged (Shabalina et al. 2006). We showed that RNA accessibility is more predictive of translation efficiency than GC content (Fig. 4A), demonstrating a layer of regulatory information not directly evident from base content. Further analysis integrating RNA accessibility and codon bias indicated that both have important and independent contributions to translation efficiency (Supplemental Fig. S3).
Figure 4.
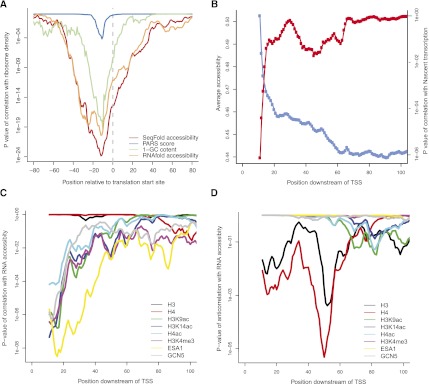
Implications of SeqFold-derived RNA accessibility on translation efficiency and transcription initiation. (A) RNA accessibility around the translation start site positively correlates with ribosome density, a proxy of translation efficiency (Ingolia et al. 2009). Shown are the P-values of the Spearman correlation between average accessibility in a 30-bp-wide window and the ribosome density. Also shown are the relationship of ribosome density with the raw PARS signal (Kertesz et al. 2010), RNA accessibility calculated directly from RNAfold without experimental information, and GC content of the sequences. (B) The average accessibility increases near the 5′ end of a transcript and positively correlates with Pol II density, a proxy of nascent transcription (Churchman and Weissman 2011). Shown are the average accessibilities in a 20-bp-wide window sliding from the TSS (blue) and the P-values of the Spearman correlation with the average Pol II density calculated from the [40, 100] region (red). (C) The 5′ end accessibility of a transcript positively correlates with histone modifiers and chromatin remodeling enzymes (Pokholok et al. 2005) but not nucleosome occupancy (Pokholok et al. 2005). Shown are the P-values of the Spearman correlations between the average accessibility in a 20-bp-wide window sliding downstream of TSS and various histone marks. (D) The 5′ end accessibility of a transcript negatively correlates with nucleosome occupancy at ∼50 bp downstream of TSS. Shown are the P-value of the anticorrelations between the average accessibility in a 20-bp-wide window sliding downstream of TSS and various histone marks. The data points are the centers of the windows.
In mammalian cells, the presence of stem-loop RNA structure in RNA polymerase II-initiated nascent transcripts recruits Polycomb complex and silence transcription (Kanhere et al. 2010). Still, the structure–function relationship in nascent transcripts has not been well understood. A recent study of nascent transcripts by sequencing reveals that local Poll II density is enriched near the transcription start site (TSS), indicating the abundant production of 5′ nascent transcripts (Churchman and Weissman 2011). We calculated the average RNA accessibilities inferred by SeqFold along the transcript length of mRNA and found increased accessibilities toward the 5′ end (Fig. 4B), suggesting the accessibilities of 5′ nascent transcripts are generally high. Moreover, the 5′ end RNA accessibility is correlated with the overall Poll II density throughout the transcript body (R = 0.09 and P = 1 × 10⁻⁶) (Fig. 4B). It is thus plausible that 5′ nascent transcripts may affect transcription initiation and elongation.
To explore how 5′ nascent transcripts might be involved in transcriptional regulation, we correlated 5′ end mRNA accessibility with genomic occupancies of histone modifications and chromatin remodeling enzymes in yeast (Pokholok et al. 2005). 5′ end mRNA accessibility is positively and significantly correlated with H3K9 acetylation (R = 0.10 and P = 2 × 10⁻⁷), H3K14 acetylation (R = 0.10 and P = 4 × 10⁻⁸), and H3K4 tri-methylation (R = 0.09 and P = 3 × 10⁻⁷) (Fig. 4C). To a lesser extent, 5′ end RNA accessibility is also positively correlated with H4 hyperacetylation (R = 0.07 and P = 6 × 10⁻⁵). Similarly, positive correlations are observed between 5′ end mRNA accessibility and the histone acetyltransferase Esa1 (R = 0.11 and P = 3 × 10⁻⁹) and Gcn5 (R = 0.09 and P = 6 × 10⁻⁷). Conversely, 5′ end RNA accessibility is negatively correlated with histone H4 (R = −0.08 and P = 5 × 10⁻⁶) and H3 (R = −0.06 and P = 4 × 10⁻⁴) occupancy, the indicators of nucleosome localization (Fig. 4D). Their peak anticorrelations are ∼50 bp downstream of the TSS, which corresponds to the position of the first nucleosome in yeast (Mobius and Gerland 2010). The anticorrelation relationship between RNA accessibility and H4 is missed by computational prediction alone (Supplemental Fig. S4), suggesting higher accuracy of estimated RNA accessibility by incorporating experimental data. Our study suggests that RNA structure (or lack of) in 5′ nascent transcripts may influence the occupancy of histone modifiers to overcome the transcriptional barriers imposed by nucleosomes near TSS. The possible mechanism of this new role requires further studies.
Incorporating RNA accessibility facilitates distinguishing true and false RBP targets
RBPs bind to RNAs and regulate their activities. It is still unclear how RBPs recognize specific RNAs. Computational methods usually try to find short sequences in RNAs that match the consensus binding motifs of RBPs. However, experimental studies indicate that many unbound transcripts also contain the same sequence motifs (Hogan et al. 2008). There have been recent attempts to incorporate structure information for improved identification of RBP targets (Hiller et al. 2006; Kazan et al. 2010; Li et al. 2010). Here, we sought to test whether SeqFold-derived RNA accessibility incorporating experimental data provides valuable information for RBP targets identification.
We compiled the lists of bound and unbound transcripts for a set of RBPs from a genome-scale RIP-chip study in yeast (Hogan et al. 2008). For each RBP, its known binding sequence motif was scanned on all the input transcripts. For the transcripts that contained at least one sequence motif, we distinguished bound transcripts that are true targets from those unbound transcripts that are false targets. The count of the sequence motifs is usually insufficient to distinguish false targets from true targets, for example, as shown in Supplemental Figure S5, the motif counts of the RBP Puf3 (motif consensus UGUAHAUA, where H indicates A or C or U). However, the accessibilities of the false targets are on average lower than those of the true targets for every position of the binding motif of Puf3 and many other RBPs (Supplemental Fig. S6). Based on this observation, we weighted each motif instance by its accessibility and summed all motifs to form a single score for each transcript (Methods). The score distribution of the true targets was compared with that of the false targets. Instead of setting an arbitrary cutoff, a continuous receiver operating characteristic (ROC) curve was plotted to visualize the ability of distinguishing the true from the false targets. The improvement of incorporating RNA accessibility over the use of motif count was assessed via the area under curve (AUC) of the ROC plots. We found 11 of the 12 RBP binding motifs showed clear improvement when SeqFold-derived RNA accessibility was incorporated (Supplemental Table S2), consistent with previous observations using in silico-derived RNA accessibility (Li et al. 2010). Those with >10% improvement are shown in Figure 5 and the rest are in Supplemental Figure S7. Furthermore, SeqFold-derived accessibility demonstrates clear improvement over in silico-derived accessibility on four of the RBPs (Supplemental Fig. S8). These results suggest that the SeqFold-derived RNA accessibility provides a useful layer of information for RBP binding site recognition.
Figure 5.

Incorporation of RNA accessibility improves the identification of RBP targets. Shown are higher prediction accuracies for distinguishing true and false RBP targets than using motif count only evaluated on RIP-chip data sets of a number of RBPs with consensus motifs: (A) Msl5 with motif UACUAAC; (B) Puf3 with motif CNUGUAHAUA; (C) Puf3 with motif UGUAHAUA; (D) Puf4 with motif UGUAHMNUA; (E) Puf5 with motif WUUGUAWUWU; and (F) Yll032c with motif AAUACCY. The receiver operating characteristic (ROC) curves demonstrate the change of the true positive rate versus the false positive rate with varying cutoffs. The area under curve (AUC) of the ROC plot measures the discrimination accuracy. The higher the AUC, the better the discrimination accuracy is. The gray dashed line of the diagonal indicates no discrimination power (AUC=0.5).
Discussion
We present SeqFold, a novel method for integrating high-throughput RNA structure profiling data to predict RNA secondary structures. SeqFold efficiently utilizes experimental structure profiling information and clustering features of the Boltzmann-weighted ensemble, lifting the power of RNA secondary structure reconstruction to the genome-scale. SeqFold uses the standard FDR cutoff of 0.05 and the nearest neighbor algorithm, and thus does not require tuning parameters. However, if a user were to attempt to tune the parameters for SeqFold, appropriate cross-validation procedures can be applied. SeqFold sets the stage for future development of other RNA structure prediction algorithms to incorporate genome-scale experimental data. Although RNAstructure can incorporate SHAPE reactivities (Deigan et al. 2009), appropriate strategies to compute bonus energies from genome-scale PARS signals remains a challenge. On another front, the use of “shape representatives” from RNAshapes (Giegerich et al. 2004) provides an interesting alternative strategy to represent the structural ensemble instead of clustering on sampled structures.
Current RNA structure profiling data are from probing RNAs folded in vitro, which is missing interactions with proteins and ligands in vivo, and cotranscriptional folding. When high-throughput RNA structure profiling starts being applied in vivo, SeqFold would be valuable to interpret such data. One interesting application is to probe RNA structures under different conditions, such as riboswitches. Integrative modeling of such data with SeqFold would reveal dynamic changes of RNA structure.
The scalability of SeqFold allows us to study the role of RNA structure in gene regulation in a genome-wide manner. Indeed, the improved estimation of RNA accessibility deepens our appreciation of RNA structure in transcriptional and translational regulation. For example, SeqFold-derived RNA accessibility displays much higher correlation with translation efficiency measured by ribosome density than the original PARS signal or GC content. SeqFold also reveals a hitherto unknown correlation of 5′ RNA accessibility with Poll II density and the localization of histone modifiers, suggesting the prevalent role of 5′ nascent transcripts in transcription initiation and processing. The apparently low but statistically significant correlations may have several explanations. First, we are making genome-wide comparisons of RNA structure at a position in every transcription to a functional outcome for every transcript. It could well be that RNA structure is important for the regulation of transcription or translation but especially for a subset of transcripts or under specific biological conditions. Because PARS data were generated from a population of unsynchronized yeast cells, specific cell states could be a minority and obscured by other signals. Second, biological regulation is combinatorial; and even if a regulatory relationship exists, that relationship is not always rate-limiting in a biological context. For instance, it is well known that only a minority of genes bound by a transcription factor change their expression when the transcription factor is deleted. Transcription and translation each involves dozens of regulatory factors, and the interplay with RNA structure is likely complex. As such, it is remarkable that these crude analytic tests yield any signal at all. We suggest that the association we observed should be viewed as an important step in hypothesis generation—but not proof—of potential roles of mRNA structure in modulating transcription and translation.
SeqFold-derived RNA accessibility demonstrates the effectiveness of RNA structure information in identifying RBP targets. Certainly, the role of RNA structure in protein-RNA interaction may be RBP-specific in the sense that a more complex pattern other than unpaired probability may be involved. For example, Vts1 recognizes binding sites within hairpin loops (Aviv et al. 2006). Further development of sophisticated motif discovery methods, such as RNAcontext (Kazan et al. 2010), is required to fully capture the structure preferences of RBP binding sites. Nevertheless, we expect SeqFold will provide useful resources for characterizing protein-RNA interaction specificities.
Methods
Inference of the structure preference profile
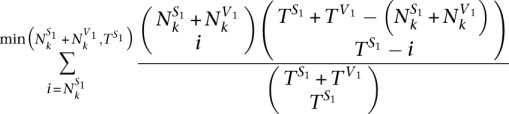
We called the structure preference of each base position of yeast from the PARS data generated and mapped previously (Kertesz et al. 2010). We downloaded base-level read count data as well as the original PARS scores of more than 3000 transcripts in yeast from http://genie.weizmann.ac.il/pubs/PARS10/. For each base position k, note the read counts of RNase S1 and V1 as  and
and  , and the total read counts of RNase S1 and V1 as TS1 and TV1. A hypergeometric test was performed to test if a base position is enriched with S1 reads. Namely, the P-value of the enrichment of S1 reads in position k is calculated by the formula below.
 |
Similarly, the P-value of the enrichment of V1 reads in position k is calculated by the formula below.
 |
To account for multiple comparisons, we calculated the FDR given the P-values according to the Benjamini-Hochberg procedure (Benjamini and Hochberg 1995). Under FDR cutoff 0.05, 134,595 and 255,113 positions were called “single-stranded” (SS) and “double-stranded” (DS), respectively. All other base positions were noted as “unknown” (UN). We assign DS sites by a value of 0, SS sites a value of 1, and UN sites a value of NA. The structure preference profile (SPP) is defined as a vector in which the elements are the individual structure preferences of all bases of a transcript.
To preprocess SHAPE data, we used the 2%/8% rule (Low and Weeks 2010; Lucks et al. 2011) to standardize SHAPE reactivities by excluding the top 2% of reactivities and normalizing by the average of the next 8%. The standardized SHAPE reactivities >1 or <0 were capped at 1 or 0, respectively. For FragSeq, Underwood et al. (2010) output the processed cutting score as the log ratio of the normalized read count of nuclease P1 over control. We estimated SPP by thresholding: Cutting scores >ln(2) were assigned a SPP value 1 and those <0 were assigned 0.
SeqFold prediction of RNA secondary structure
To predict RNA secondary structure, we incorporate computational predictions with SPP inferred from high-throughput RNA structure profiling. First, 1000 structures per transcript were sampled from the Boltzmann-weighted ensemble and clustered using Sfold (Ding and Lawrence 2003). We then used the nearest neighbor algorithm to classify a transcript with a given SPP into one of the structure clusters.
To be more specific, let  be the SPP of a given transcript of length L and
  be the SPP of the ith sampled structure of the transcripts, i = 1, 2, …, 1000. We calculated the Manhattan distance
  between the SPP of the transcript and the SPP of the ith sampled structure. We recorded the minimum Manhattan distance as
  with m as the number of sampled structures with the same dmin to the transcript. The predicted cluster of the transcript is then set to the most frequent cluster among the m equivalently nearest structures. After selecting the structure cluster for a transcript, we predicted its structure as the cluster centroid, the one in the entire ensemble that has the shortest total base-pair distance to all structures in the cluster (Ding et al. 2006).
Annotate ncRNA structure with Rfam
We used the Rfam database (Griffiths-Jones et al. 2003) to annotate the secondary structures of ncRNAs and compared those with SeqFold prediction. We matched the yeast ncRNAs to the Rfam families by combining BLAST (Altschul et al. 1990) and CMsearch (Nawrocki and Eddy 2007). The best-matched Rfam families were extracted and the secondary structures for the ncRNAs based on the CM model (if any) were obtained, and redundancies were removed. Several criteria were performed to filter the structure annotations: (1) An ncRNA was filtered if its aligned region has insertions or deletions, leading to an inconsistent length compared to that of the consensus secondary structure; (2) an ncRNA with the consensus secondary structure containing at least one large loop (>50 consecutive single-stranded bases) was also filtered since such a structure is probably unstable; (3) all tRNAs were filtered since their lengths are too short (72–74 bps) for the PARS experiment; and (4) for duplicated structures only one of them was kept. After filtering, we annotated seven ncRNAs with Rfam consensus secondary structures. Correspondingly, the SeqFold and MFE-predicted structures were tailored to contain only the aligned regions as in the Rfam annotation. Those aligned regions were used to assess secondary structure prediction accuracy.
RBP targets analysis
We analyzed the role of RNA accessibility in RBP binding using data sets from a RIP-chip study in yeast (Hogan et al. 2008). We defined the bound transcripts of an RBP by FDR <1% reported in the original study. The unbound transcripts of a RBP were defined as those underrepresented in the corresponding protein IP comparing to the mock IP. The motif consensus of an RBP was scanned on both bound and unbound transcripts. Those that contain at least one motif instance of the RBP were selected and called true targets or false targets, depending on whether they were bound or unbound. We derived a score to distinguish true targets and false targets of an RBP using both motif count and accessibility information. For a transcript containing N motif instances of an RBP with motif length M, suppose the accessibility of the jth position of the ith motif instance is aij, a combined motif score is defined as the formula below.
 |
We compared the performance of the combined motif score in distinguishing true and false targets with the traditional motif count approach.
Implementation and software availability
SeqFold is implemented in Python and Perl scripts and can be freely downloaded at http://www.stanford.edu/∼zouyang/seqfold.
Acknowledgments
We thank E. Segal, Y. Wan, R. Spitale, and M. Kertesz for discussion. We also thank K. Weeks and D. Mathews for providing SHAPE data of E. coli 16S and 23S rRNAs in their paper. This work was supported by the U.S. National Institutes of Health (HG-R01-004361 and HG-P50-002357). H.Y.C. is an Early Career Scientist of the Howard Hughes Medical Institute.
Footnotes
[Supplemental material is available for this article.]
Article published online before print. Article, supplemental material, and publication date are at http://www.genome.org/cgi/doi/10.1101/gr.138545.112.
Freely available online through the Genome Research Open Access option.
References
- Alkemar G, Nygard O 2006. Probing the secondary structure of expansion segment ES6 in 18S ribosomal RNA. Biochemistry 45: 8067–8078 [DOI] [PubMed] [Google Scholar]
- Altschul SF, Gish W, Miller W, Myers EW, Lipman DJ 1990. Basic local alignment search tool. J Mol Biol 215: 403–410 [DOI] [PubMed] [Google Scholar]
- Aviran S, Trapnell C, Lucks JB, Mortimer SA, Luo S, Schroth GP, Doudna JA, Arkin AP, Pachter L 2011. Modeling and automation of sequencing-based characterization of RNA structure. Proc Natl Acad Sci 108: 11069. [DOI] [PMC free article] [PubMed] [Google Scholar]
- Aviv T, Lin Z, Ben-Ari G, Smibert CA, Sicheri F 2006. Sequence-specific recognition of RNA hairpins by the SAM domain of Vts1p. Nat Struct Mol Biol 13: 168–176 [DOI] [PubMed] [Google Scholar]
- Baldi P, Brunak S, Chauvin Y, Andersen C, Nielsen H 2000. Assessing the accuracy of prediction algorithms for classification: An overview. Bioinformatics 16: 412–424 [DOI] [PubMed] [Google Scholar]
- Benjamini Y, Hochberg Y 1995. Controlling the false discovery rate: A practical and powerful approach to multiple testing. J R Stat Soc Ser B Methodol 57: 289–300 [Google Scholar]
- Brenowitz M, Chance MR, Dhavan G, Takamoto K 2002. Probing the structural dynamics of nucleic acids by quantitative time-resolved and equilibrium hydroxyl radical ‘footprinting.' Curr Opin Struct Biol 12: 648–653 [DOI] [PubMed] [Google Scholar]
- Chartrand P, Meng X, Singer R, Long R 1999. Structural elements required for the localization of ASH1 mRNA and of a green fluorescent protein reporter particle in vivo. Curr Biol 9: 333–338 [DOI] [PubMed] [Google Scholar]
- Chartrand P, Meng XH, Huttelmaier S, Donato D, Singer RH 2002. Asymmetric sorting of ash1p in yeast results from inhibition of translation by localization elements in the mRNA. Mol Cell 10: 1319–1330 [DOI] [PubMed] [Google Scholar]
- Churchman LS, Weissman JS 2011. Nascent transcript sequencing visualizes transcription at nucleotide resolution. Nature 469: 368–373 [DOI] [PMC free article] [PubMed] [Google Scholar]
- Cordero P, Lucks JB, Das R 2012. An RNA Mapping Database for curating RNA structure mapping experiments. Bioinformatics 28: 3006–3008 [DOI] [PMC free article] [PubMed] [Google Scholar]
- Das R, Kudaravalli M, Jonikas M, Laederach A, Fong R, Schwans JP, Baker D, Piccirilli JA, Altman RB, Herschlag D 2008. Structural inference of native and partially folded RNA by high-throughput contact mapping. Proc Natl Acad Sci 105: 4144–4149 [DOI] [PMC free article] [PubMed] [Google Scholar]
- Deigan KE, Li TW, Mathews DH, Weeks KM 2009. Accurate SHAPE-directed RNA structure determination. Proc Natl Acad Sci 106: 97–102 [DOI] [PMC free article] [PubMed] [Google Scholar]
- Ding Y, Lawrence CE 2003. A statistical sampling algorithm for RNA secondary structure prediction. Nucleic Acids Res 31: 7280–7301 [DOI] [PMC free article] [PubMed] [Google Scholar]
- Ding Y, Chan CY, Lawrence CE 2005. RNA secondary structure prediction by centroids in a Boltzmann weighted ensemble. RNA 11: 1157–1166 [DOI] [PMC free article] [PubMed] [Google Scholar]
- Ding Y, Chan CY, Lawrence CE 2006. Clustering of RNA secondary structures with application to messenger RNAs. J Mol Biol 359: 554–571 [DOI] [PubMed] [Google Scholar]
- Eddy SR, Durbin R 1994. RNA sequence analysis using covariance models. Nucleic Acids Res 22: 2079–2088 [DOI] [PMC free article] [PubMed] [Google Scholar]
- Gardner PP, Giegerich R 2004. A comprehensive comparison of comparative RNA structure prediction approaches. BMC Bioinformatics 5: 140. [DOI] [PMC free article] [PubMed] [Google Scholar]
- Giegerich R, Voss B, Rehmsmeier M 2004. Abstract shapes of RNA. Nucleic Acids Res 32: 4843–4851 [DOI] [PMC free article] [PubMed] [Google Scholar]
- Gonzalez I, Buonomo SBC, Nasmyth K, von Ahsen U 1999. ASH1 mRNA localization in yeast involves multiple secondary structural elements and Ash1 protein translation. Curr Biol 9: 337–340 [DOI] [PubMed] [Google Scholar]
- Griffiths-Jones S, Bateman A, Marshall M, Khanna A, Eddy SR 2003. Rfam: An RNA family database. Nucleic Acids Res 31: 439–441 [DOI] [PMC free article] [PubMed] [Google Scholar]
- Guo F, Gooding AR, Cech TR 2004. Structure of the Tetrahymena ribozyme: Base triple sandwich and metal ion at the active site. Mol Cell 16: 351–362 [DOI] [PubMed] [Google Scholar]
- Hiller M, Pudimat R, Busch A, Backofen R 2006. Using RNA secondary structures to guide sequence motif finding towards single-stranded regions. Nucleic Acids Res 34: e117. [DOI] [PMC free article] [PubMed] [Google Scholar]
- Hofacker IL, Fontana W, Stadler PF, Bonhoeffer LS, Tacker M, Schuster P 1994. Fast folding and comparison of RNA secondary structures. Monatsh Chem 125: 167–188 [Google Scholar]
- Hogan DJ, Riordan DP, Gerber AP, Herschlag D, Brown PO 2008. Diverse RNA-binding proteins interact with functionally related sets of RNAs, suggesting an extensive regulatory system. PLoS Biol 6: e255. [DOI] [PMC free article] [PubMed] [Google Scholar]
- Ingolia NT, Ghaemmaghami S, Newman JR, Weissman JS 2009. Genome-wide analysis in vivo of translation with nucleotide resolution using ribosome profiling. Science 324: 218–223 [DOI] [PMC free article] [PubMed] [Google Scholar]
- Kanhere A, Viiri K, Araujo CC, Rasaiyaah J, Bouwman RD, Whyte WA, Pereira CF, Brookes E, Walker K, Bell GW, et al. 2010. Short RNAs are transcribed from repressed polycomb target genes and interact with polycomb repressive complex-2. Mol Cell 38: 675–688 [DOI] [PMC free article] [PubMed] [Google Scholar]
- Kazan H, Ray D, Chan ET, Hughes TR, Morris Q 2010. RNAcontext: A new method for learning the sequence and structure binding preferences of RNA-binding proteins. PLoS Comput Biol 6: e1000832. [DOI] [PMC free article] [PubMed] [Google Scholar]
- Kertesz M, Wan Y, Mazor E, Rinn JL, Nutter RC, Chang HY, Segal E 2010. Genome-wide measurement of RNA secondary structure in yeast. Nature 467: 103–107 [DOI] [PMC free article] [PubMed] [Google Scholar]
- Kladwang W, Vanlang CC, Cordero P, Das R 2011. Understanding the errors of SHAPE-directed RNA structure modeling. Biochemistry 50: 8049–8056 [DOI] [PMC free article] [PubMed] [Google Scholar]
- Kozak M 2005. Regulation of translation via mRNA structure in prokaryotes and eukaryotes. Gene 361: 13–37 [DOI] [PubMed] [Google Scholar]
- Krasilnikov AS, Yang X, Pan T, Mondragon A 2003. Crystal structure of the specificity domain of ribonuclease P. Nature 421: 760–764 [DOI] [PubMed] [Google Scholar]
- Latham MP, Brown DJ, McCallum SA, Pardi A 2005. NMR methods for studying the structure and dynamics of RNA. ChemBioChem 6: 1492–1505 [DOI] [PubMed] [Google Scholar]
- Li X, Quon G, Lipshitz HD, Morris Q 2010. Predicting in vivo binding sites of RNA-binding proteins using mRNA secondary structure. RNA 16: 1096–1107 [DOI] [PMC free article] [PubMed] [Google Scholar]
- Li F, Zheng Q, Ryvkin P, Dragomir I, Desai Y, Aiyer S, Valladares O, Yang J, Bambina S, Sabin Leah R, et al. 2012. Global analysis of RNA secondary structure in two metazoans. Cell Rep 1: 69–82 [DOI] [PubMed] [Google Scholar]
- Low JT, Weeks KM 2010. SHAPE-directed RNA secondary structure prediction. Methods 52: 150–158 [DOI] [PMC free article] [PubMed] [Google Scholar]
- Lucks JB, Mortimer SA, Trapnell C, Luo S, Aviran S, Schroth GP, Pachter L, Doudna JA, Arkin AP 2011. Multiplexed RNA structure characterization with selective 2′-hydroxyl acylation analyzed by primer extension sequencing (SHAPE-Seq). Proc Natl Acad Sci 108: 11063–11068 [DOI] [PMC free article] [PubMed] [Google Scholar]
- Mathews DH, Sabina J, Zuker M, Turner DH 1999. Expanded sequence dependence of thermodynamic parameters improves prediction of RNA secondary structure. J Mol Biol 288: 911–940 [DOI] [PubMed] [Google Scholar]
- Mitra S, Shcherbakova IV, Altman RB, Brenowitz M, Laederach A 2008. High-throughput single-nucleotide structural mapping by capillary automated footprinting analysis. Nucleic Acids Res 36: e63. [DOI] [PMC free article] [PubMed] [Google Scholar]
- Mobius W, Gerland U 2010. Quantitative test of the barrier nucleosome model for statistical positioning of nucleosomes up- and downstream of transcription start sites. PLoS Comput Biol 6: e100089. [DOI] [PMC free article] [PubMed] [Google Scholar]
- Mueller F, Sommer I, Baranov P, Matadeen R, Stoldt M, Wohnert J, Gorlach M, van Heel M, Brimacombe R 2000. The 3D arrangement of the 23 S and 5 S rRNA in the Escherichia coli 50 S ribosomal subunit based on a cryo-electron microscopic reconstruction at 7.5 Å resolution. J Mol Biol 298: 35–59 [DOI] [PubMed] [Google Scholar]
- Nawrocki EP, Eddy S 2007. Query-dependent banding (QDB) for faster RNA similarity searches. PLoS Comput Biol 3: e56. [DOI] [PMC free article] [PubMed] [Google Scholar]
- Pokholok DK, Harbison CT, Levine S, Cole M, Hannett NM, Lee TI, Bell GW, Walker K, Rolfe PA, Herbolsheimer E, et al. 2005. Genome-wide map of nucleosome acetylation and methylation in yeast. Cell 122: 517–527 [DOI] [PubMed] [Google Scholar]
- Quarrier S, Martin JS, Davis-Neulander L, Beauregard A, Laederach A 2010. Evaluation of the information content of RNA structure mapping data for secondary structure prediction. RNA 16: 1108–1117 [DOI] [PMC free article] [PubMed] [Google Scholar]
- Romaniuk PJ, de Stevenson IL, Ehresmann C, Romby P, Ehresmann B 1988. A comparison of the solution structures and conformational properties of the somatic and oocyte 5S rRNAs of Xenopus laevis. Nucleic Acids Res 16: 2295–2312 [DOI] [PMC free article] [PubMed] [Google Scholar]
- Shabalina SA, Ogurtsov AY, Spiridonov NA 2006. A periodic pattern of mRNA secondary structure created by the genetic code. Nucleic Acids Res 34: 2428–2437 [DOI] [PMC free article] [PubMed] [Google Scholar]
- Underwood JG, Uzilov AV, Katzman S, Onodera CS, Mainzer JE, Mathews DH, Lowe TM, Salama SR, Haussler D 2010. FragSeq: Transcriptome-wide RNA structure probing using high-throughput sequencing. Nat Methods 7: 995–1001 [DOI] [PMC free article] [PubMed] [Google Scholar]
- Wan Y, Kertesz M, Spitale RC, Segal E, Chang HY 2011. Understanding the transcriptome through RNA structure. Nat Rev Genet 12: 641–655 [DOI] [PMC free article] [PubMed] [Google Scholar]
- Wan Y, Qu K, Ouyang Z, Kertesz M, Li J, Tibshirani R, Nutter RC, Segal E, Chang HY 2012. Genome-wide measurement of RNA folding energies. Mol Cell 48: 1–13 [DOI] [PMC free article] [PubMed] [Google Scholar]
- Watts JM, Dang KK, Gorelick RJ, Leonard CW, Bess JW Jr, Swanstrom R, Burch CL, Weeks KM 2009. Architecture and secondary structure of an entire HIV-1 RNA genome. Nature 460: 711–716 [DOI] [PMC free article] [PubMed] [Google Scholar]
- Zuker M 2003. Mfold web server for nucleic acid folding and hybridization prediction. Nucleic Acids Res 31: 3406–3415 [DOI] [PMC free article] [PubMed] [Google Scholar]
- Zuker M, Sankoff D 1984. RNA secondary structure and their prediction. Bull Math Biol 46: 591–621 [Google Scholar]