

Abstract
While late-life depression (LLD) and amnestic mild cognitive impairment (aMCI), alone and in combination, is associated with an increased risk of incident Alzheimer’s disease (AD), the neurobiological mechanisms of this link are unclear. We examined the main and interactive effects of LLD and aMCI on the gray matter (GM) volumes in seventy-two physically healthy participants aged 60 and older. Participants were separated into normal controls, cognitively normal depressed, non-depressed aMCI, and depressed aMCI groups. Optimized voxel-based morphometry estimated GM volumes. The main and interactive effects of LLD and aMCI, and of depressive symptoms and episodic memory deficits on the GM volumes were analyzed. While decreased GM volumes in the mood regulating circuitry structures were associated with depression, GM atrophy in regions essential for various cognitive performance were related to aMCI. LLD-aMCI interactions were associated with widespread subcortical and cortical GM volume loss of brain structures implicated in AD. The interactions between episodic memory deficits and depressive symptom severity are associated with volume loss in right inferior frontal gyrus/anterior insula and left medial frontal gyrus clusters. Our findings suggest that the co-existence of these clinical phenotypes is a potential marker for higher risk of AD.
Keywords: late-life depression, mild cognitive impairment, voxel-based morphometry, elderly, Alzheimer’s disease, episodic memory, Geriatric depression, gray matter brain volumes
1. INTRODUCTION
An estimated 35 million people worldwide are living with Alzheimer’s disease (AD) today, and this number is anticipated to rise to 113 million by year 2050 [1]. While AD-disease modifying agents are currently in various phases of clinical trials, several of these have failed to show benefit. Modification of vascular, lifestyle, and psychosocial factors may prevent or reduce the incidence of AD in a significant proportion of individuals [2]. Late-life depression (LLD), one such modifiable risk factor, affects a significant proportion of older adults, and is associated with poorer outcomes of co-morbid medical disorders, increased mortality risk and incident cognitive decline [3].
Late-life depression (LLD) is associated with increased risk of developing mild cognitive impairment (MCI) and AD [2, 4, 5]. In LLD, volume declines in the brain regions earliest affected by AD, including the frontal and medial temporal lobe (MTL) structures are seen, although these findings are not universal [6–15]. Circumscribed hippocampal abnormalities are reported in LLD, and depressed elderly with MTL volume loss may be at greater risk for development of dementia [16, 17]. Early evidence has also suggested a role of amyloid and neurofibrillary tangles in the pathophysiology of LLD [18, 19]. While these findings implicate neurodegeneration as a potential mechanistic link between depression and AD, we currently cannot predict who with LLD will progress to AD. The co-existence of LLD with persisting cognitive impairment, which often occurs in the elderly, accelerates the conversion to AD by neurobiological mechanisms that are unknown [20].
Amnestic mild cognitive impairment (aMCI), another common neuropsychiatric syndrome of the elderly, is a prodrome of AD in many individuals. However, while 10 to 15% of individuals with aMCI progress to AD annually, the conversion rates are highly variable and some revert back to normal [21]. Deficits in multiple cognitive domains are robust predictors of aMCI conversion to AD [22]. The severity of neurodegeneration in the MTL, insula and neocortical areas may separate aMCI converters from non-converters [23–25]. Moreover, the co-existence of depression and aMCI, is associated with greater progression to AD, relative to nondepressed aMCI, suggesting that their co-morbidity is a marker of disease severity [20]. The differential GM volume effects by LLD and aMCI, when occurring alone or when they co-exist, are not fully understood.
We aimed to test the hypothesis that while LLD will be associated with GM volume reductions limited to the regions involved in emotional regulation, aMCI will be related to GM volume loss in areas involved in multiple cognitive functions. Furthermore, we hypothesized that the LLD-aMCI interactions will be associated with widespread GM volume loss in regions commonly involved in mild AD.
2. MATERIALS AND METHODS
2.1. Participants
Our sample comprised of seventy-two participants aged 60 and older (cognitively healthy, late-life depression [n=18]; amnestic mild cognitive impairment [n=17]; late-life depression with co-existing aMCI [n=12]; and cognitively normal, nondepressed controls [n=25]). All patients diagnosed as clinically significant depression and/or aMCI were recruited from the geriatric psychiatry and memory disorders clinics at the Medical College of Wisconsin. Control subjects were recruited from the community through local advertisements. All participants provided written informed consent and the study protocol were approved by the Medical College of Wisconsin Institutional Review board. During study visit 1, study participants received detailed clinical and neuropsychiatric assessments. The core neuropsychological battery administered to all participants included the (1) Mini-Mental State Examination (MMSE) (all subjects had to score ≥24)[26]; (2) Mattis Dementia Rating Scale-2 (MDRS-2) (age and education corrected MOANS scaled score of ≥5)[27]; (3) education adjusted Logical Memory II Delayed paragraph recall (LMII-DR) subscale from the Wechsler Memory Scale-Revised[28]; (4) Physical Self Maintenance Scale/Instrumental Activities of Daily Living (PSMS/IADL)[29]; (5) 30-item Yesavage Geriatric Depression Scale (GDS)[30]; (6) Diagnostic assessment for Axis 1 disorders including the depression module from the Structured Clinical Interview for DSM IV[31]; and (7) Hamilton Anxiety Scale (HAM-A). All participants had to score ≤4 on the modified Hachinski ischemic scale (HIS). Clinical assessment findings were reviewed during the weekly consensus conference attended by neurologists, neuropsychologists and a geriatric psychiatrist.
Inclusion criteria for cognitively normal subjects with LLD included a positive SCID for clinically significant depression (defined as having major or minor depression or dysthymic disorder). Seventeen participants met SCID criteria for major depression and one patient met criteria for minor depression. All participants had a GDS score of 10 or above, MMSE ≥26, PSMS ≤6 and IADL ≤9, score above the education-adjusted cutoff on the LMII-DR (Delayed recall score >8 for 16 or more years of education or score >4 for 8–15 years of education). Among the 16 out of the 18 cognitively healthy participants with LLD on antidepressants, 7 were on antidepressant monotherapy (selective serotonin re-uptake inhibitors (SSRI): N=2, serotonin norepinephrine reuptake inhibitors (SNRI): N=4, and bupropion: N=1); and 9 were on combination treatment.
Amnestic mild cognitive impairment (aMCI) (N=29) was operationally defined according to the established criteria: (1) subjective report of cognitive decline; (2) objective cognitive impairment that includes scoring 1.5 SD below on memory measures; (3) intact ADLs and relatively preserved IADLs; and (4) no dementia. For meeting criteria for objective cognitive impairment, participants had to score below the education-adjusted cutoff on the LMII-DR (i.e., ≤8 for 16 or more years of education, and ≤4 for 8–15 years of education), and score below 1.5 SD below the mean on one or more subscales (one of the impairment had to be memory) of the Repeatable Battery for the Assessment of Neuropsychological Status (RBANS)[32], Behavioral Dyscontrol scale or the Boston Naming Test. Fourteen of the 29 aMCI subjects were on cognitive enhancing medications (cholinesterase inhibitors monotherapy: N= 9; memantine monotherapy: N=4; combined: N=1).
All participants with aMCI who endorsed clinically significant depression on SCID (N=12) were included in the aMCI with co-existing depression group (major depression (N=11). One aMCI subject who scored a 9 on the GDS met SCID criteria for dysthymic disorder and was also included in this group. Among the 10 out of the 12 aMCI subjects with LLD on antidepressants, 5 were on antidepressant monotherapy (selective serotonin re-uptake inhibitors (SSRI): N=2, serotonin norepinephrine reuptake inhibitors (SNRI): N=2, and bupropion: N=1); and 5 were on combination treatment.
Antidepressant doses had to be at stable doses for at least two weeks before study enrollment and until completion of the study procedures.
A sample of nondepressed, cognitively healthy participants (N=25) was recruited as the control group. Subjects in this group could not meet criteria for MCI or any Axis 1 psychiatric disorders or be on psychoactive medications.
Exclusion criteria included past or current history of concurrent Axis 1 psychiatric disorders, such as psychotic or bipolar disorders; alcohol or substance abuse/dependence during the past 5 years; active suicidality; MMSE scores <24; History of neurological disease including parkinson’s disease, dementia, multiple sclerosis, seizures, or stroke; Head injury with loss of consciousness; MRI contraindications; and unstable chronic medical conditions.
2.2. MR Image Acquisition
During study visit 2, High-resolution Spoiled Gradient-Recalled Echo (SPGR) 3D axial images were acquired using a whole-body 3T Signa GE scanner (Waukesha, Wisconsin) with a standard transmits-receive head coil. The parameters were: TE/TR/TI of 4/10/450 ms, field of view (FOV) of 24*24 cm, flip angle of 12°, number of slices of 144, slice thickness of 1 mm, matrix size of 256×192 and voxel size of 0.938*0.938*1 mm3 (x, y, z). GDS was completed prior to MRI scans.
2.2.1. Image Data Analysis
Optimized Voxel-based Morphometry (VBM) combining with Statistical Parametric Mapping (SPM8) software (http://www.fil.ion.ucl.ac.uk/spm) on a Matlab 7.5 (MathWorks, Natick, MA, http://www.mathworks.com/) platform were utilized to perform GM volume analysis [33]. First, segmentation of the brain tissues was conducted in original space using the analysis of likelihood of each voxel of the brain images to be classified as GM, white matter (WM), or cerebrospinal fluid (CSF). Second, to create the study group-specific template, the high-resolution structural GM images for all participants were averaged after images were spatially normalized in the same stereotactic space based on the Montreal Neurological Institute template using 12 affine transformation and 16 nonlinear iterations. Third, the second segmentation was performed by using spatial normalization parameters for the native images based on study group-specific GM template, followed by interpolation of voxel size 2*2*2 mm3 using the trilinear interpolation method recommended in the SPM8 manual. This method, although time consuming, is more accurate than the Nearest Neighbor method. The 2-mm isotropic resolution was chosen because the down sampling has been found to provide results that are less dependent on the original position, scale and orientation of one dataset with respect to the other and to decrease the number of statistical tests by a factor of 8 [34]. Fourth, the absolute GM volume was modulated for each subject by Jacobian determinants derived from the spatial normalization. Finally, all segmented gray matter images were smoothed using 8mm Gaussian kernel and transformed using logit transformation (logit(n) = 0.5 ln (n/(1 − n))) to make the data normally distributed for the further analyses.
2.3. Statistical analysis
2.3.1. Subject characteristics
Group comparisons for demographic information (age and education) were compared by analysis of variance (ANOVA), gender comparison was performed with χ2 test (p<0.05 to avoid false negative findings). Neuropsychological measurements were compared by analysis of covariance (ANCOVA), after controlling for age, gender and education. Neuropsychological and behavioral measures for group comparison were considered significant at p < 0.0045 (Bonferroni corrected, p<0.05/11≈0.0045), SPSS 18.0; SPSS Inc, Chicago, Illinois). The sources of the differences between the means of the four groups were examined by post hoc Fisher’s Least Significant Difference test for demographics; and post hoc Bonferroni-corrected tests were performed when appropriate for neuropsychological measures (after rejecting the null hypothesis that all group means are equal).
2.3.2. Volumetric Comparison of Gray matter Volumes
Volumetric measurements in the four study groups were tested for normal distribution and for homogeneity of variance. To find brain regions with significant group differences in gray matter volumes, 2×2 (depression × mild cognitive impairment) voxel-wise analysis of covariance (ANCOVA) was performed at p< 0.01 significance with false discovery rate (FDR) corrected for multiple comparisons across all subjects (number of contiguous voxels > 150). We employed the FDR and not the more conservative family wise error (FWE) procedure when performing correction for multiple comparisons. The FDR procedure controls for the proportion of false positives among the tests that show significant results. On the other hand, FWE correction has the tendency to wipe out both true and false positives when applied to the entire dataset that contain large number of voxels, thereby producing false negative findings (Type II error). Therefore, we believe that FDR is more appropriate than FWE for this preliminary VBM study [35, 36]. Age, education, gender, and intracranial volume (ICV) were included as covariates of no interest.
2.3.3. Behavioral Significance of Gray Matter Volumes
To investigate the main and interactive effects of the depressive symptoms and episodic memory scores on GM volume, a voxelwise multiple linear regression analysis was employed (3dRegAna, AFNI) between the GM volume of each subject and the GDS and LMII-DR scores in the four groups, respectively using the following equation as used in previous publications [37, 38]:
where GMi is the gray matter volume of ith voxel across group subjects, β0 is the intercept of the straight line fitting in the model; β1 and β2 are the main effects of the GDS and LM II-DR scores, β3 is the interactive effects of GDS and LMII-DR scores, β4, β5, β6, β7, and β8 are the effects of age, gender, education, group, and ICV as covariates of no interest in the above linear regression model. The cluster level was set at p< 0.01 with false discovery rate (FDR) corrected for multiple comparisons across all subjects (the cluster level threshold set at number of contiguous voxels > 150).
3. RESULTS
3.1. Demographics and Neuropsychiatric Assessments
The demographic and neuropsychological characteristics are summarized in Table 1. While there were no education and gender differences between the four groups (p>0.05), cognitive healthy LLD group was significantly younger than the CN and nondepressed aMCI subjects (p=0.043).
Table 1.
Demographics and neuropsychiatric characteristics
| CN (n=25) | Dep (n=18) | aMCI (n=17) | aMCI/Dep (n=12) | P | |||||
|---|---|---|---|---|---|---|---|---|---|
|
| |||||||||
| Mean | SD | Mean | SD | Mean | SD | Mean | SD | ||
| Age (year) | 74.28 | 8.25 | 68.61a | 6.81 | 75.12d | 6.62 | 68.33f | 13.87 | 0.043* |
| Education (years) | 15.32 | 2.87 | 14.61 | 2.57 | 13.47 | 2.07 | 14.25 | 2.99 | 0.175 |
| Gender (F/M) | 12/13 | 14/4 | 11/6 | 7/5 | 0.135 | ||||
| Neuropsychological Measures | |||||||||
| MMSE | 28.92 | 1.22 | 28.06 | 1.21 | 27.29 | 1.83 | 26.92c | 1.93 | 0.001* |
| DRS-2 raw scores | |||||||||
| Attention | 36.56 | 0.51 | 36.39 | 0.70 | 35.71b | 0.77 | 36.00 | 1.21 | 0.004* |
| INIT/PERS | 36.32 | 1.38 | 36.22 | 2.10 | 34.88 | 3.62 | 32.50 | 5.55 | 0.005 |
| Construct | 6.00 | 0.00 | 5.94 | 0.24 | 5.94 | 0.24 | 5.83 | 0.58 | 0.436 |
| Conceptual | 37.76 | 1.33 | 37.61 | 1.24 | 35.88b | 2.45 | 35.41ce | 3.12 | 0.001* |
| Memory | 23.64 | 1.04 | 23.89 | 1.13 | 19.06bd | 2.68 | 19.50ce | 3.60 | 0.000* |
| Total | 140.36 | 2.53 | 140.11 | 3.20 | 130.88bd | 5.49 | 129.67ce | 6.70 | 0.000* |
| Recall scores | |||||||||
| IMMED | 14.36 | 3.73 | 14.17 | 3.96 | 8.41bd | 3.59 | 7.17ce | 3.76 | 0.000* |
| DELAYED | 12.92 | 4.03 | 12.06 | 4.24 | 2.47bd | 3.30 | 3.25ce | 3.14 | 0.000* |
| HAMA | 1.16 | 1.06 | 10.88a | 5.07 | 2.18d | 1.55 | 8.67cf | 4.19 | 0.000* |
| GDS | 1.88 | 2.11 | 17.28a | 3.29 | 4.35d | 2.67 | 14.25cf | 6.43 | 0.000* |
Notes: Significant differences in age (p < 0.05) were found in Depression (Dep) group compared to CN and aMCI group, and in dMCI compared to aMCI group. Significant differences in neuropsychological measures (p < 0.045, Bonferroni correction for multiple comparison) were found in MMSE, DRS-2 raw scores (except for INIT/PERS and Construction), memory recall scores (IMMED and Delayed) and emotional scores (HAMA and GDS) among four groups. p values were obtained by one-way ANOVA analysis except for gender (X2 test). a-f: post-hoc analysis (LSD test for demographic information and Bonferroni correction for multiple comparison) further revealed the source of ANOVA difference (a: CN vs Dep; b: CN vs aMCI; c: CN vs aMCI/Dep; d: Dep vs aMCI; e: Dep vs aMCI/Dep; f: aMCI vs aMCI/Dep). Unless otherwise indicated, data are presented as mean ± SD. Abbreviation: CN, cognitive normal; Dep, depression; aMCI, amnestic mild cognitive impairment; aMCI/Dep, amnestic mild cognitive impairment with depression; M, mean; SD, standard deviation; F/M: female/male; MMSE, mini-mental state examination; DRS-2: dementia rating scale-2; INIT/PERS: Initiation/Preservation; Construct: Construction; Conceptual: Conceptualization; IMMED, immediate recall; DELAYED, delayed recall; HAMA, Hamilton anxiety; GDS, geriatric depression scale.
Significant differences were found in MMSE, DRS-2 (attention, conceptualization, memory and total), LMII (immediate and delayed), HAM-A and GDS scores, after controlling for age, gender and education. Post-hoc analyses revealed the source of differences (Bonferroni p<0.0045). Depressed aMCI subjects had lower MMSE scores, relative to CN subjects. When compared to the CN and cognitively healthy subjects with LLD, the aMCI groups (depressed and nondepressed) performed poorly on DRS-2 memory and total, and LMII immediate and delayed memory recall scores. When compared to cognitively normal control and depressed groups, depressed aMCI subjects performed poorly on the DRS-2 conceptualization measure. The nondepressed aMCI subjects performed worse on the DRS-2 attention and conceptualization scores, relative to the nondepressed controls. Relative to the nondepressed groups, depressed (aMCI and cognitively healthy) subjects endorsed greater depressive and anxiety symptoms (Table 1).
3.2. Effects of LLD and aMCI on the Gray Matter Volumes
3.2.1. Main effects of depression on GM volumes
The main effects of depression included GM volume loss in the bilateral dorsal cingulate cortex (dACC), orbitofrontal cortex (OFC) and ventromedial (vmPFC) prefrontal cortices; insula (Ins), posterior middle temporal gyrus (pMTG), middle occipital gyrus (MOG) and inferior frontal gyrus (IFG) on the left; and the right posterior cingulate cortex (PCC) and precuneus (Pcu) (Figure 1 and Table 2).
Figure 1. ANCOVA analysis illustrating main and interactive effects of depression and mild cognitive impairment on the gray matter (GM) volumes across all subjects (p < 0.01, FDR corrected).

A: Main effects of depression; B: Main effects of mild cognitive impairment (MCI); C: Interactive effects of depression and MCI. In A and B, blue color illustrates GM atrophy; in C, bright color indicates the interactive effects of depression and MCI on GM volumes.
Table 2.
Main effects of late-life depression on gray matter volumes
| Brain region | Side | BA | Cluster Size (mm3) | MNI coordinates (LPI)
|
z Score | ||
|---|---|---|---|---|---|---|---|
| x | y | z | |||||
| Insula | L | 13 | 6432 | −35 | 15 | 0 | −3.24 |
| dACC | L/R | 24/32 | 4680 | −2 | 36 | 16 | −3.94 |
| pMTG/MOG | L | 19 | 3496 | −48 | −76 | 2 | −3.96 |
| IFG | L | 47 | 1840 | −45 | 30 | −16 | −3.49 |
| OFC | L/R | 25 | 1688 | 2 | 26 | −18 | −3.28 |
| PCC/Pcu | R | 31 | 1584 | 16 | −42 | 40 | −3.84 |
| vmPFC | L/R | 11 | 4 | 58 | −16 | −3.53 | |
Notes: x,y,z, coordinates of primary peak locations in the MNI space. Abbreviation: MNI, Montreal Neurological Institute space; LPI, left-posterior-inferior; BA, Brodmann’s area; R, right. L, left; dACC, dorsal anterior cingulate cortex; pMTG, posterior middle temporal gyrus; MOG, middle occipital gyrus; IFG, inferior frontal gyrus; OFC, orbitofrontal cortex; PCC, posterior cingulate cortex; Pcu, precuneus; vmPFC, ventromedial prefrontal cortex.
3.2.2. Main effects of mild cognitive impairment on the GM volumes
Main effects of mild cognitive impairment included GM volume loss in the bilateral amygdala/hippocampus (Amy/Hippo), vmPFC, ventrolateral PFC (vlPFC), insula, and anterior temporal pole (aTP); PCC/precuneus (Pcu) cluster, pMTG and retrosplenial cortex (RSC) on the right; and the left fusiform area (FFA); (Figure 1 and Table 3).
Table 3.
Main effects of cognitive impairment on gray matter volumes
| Brain region | Side | BA | Cluster Size (mm3) | MNI coordinates (LPI)
|
z Score | ||
|---|---|---|---|---|---|---|---|
| x | y | z | |||||
| Amy/Hippo | L/R | 34 | 52380 | 26 | 2 | −22 | −5.17 |
| vmPFC | L/R | 32/11 | 2 | 37 | −10 | −3.06 | |
| VlPFC | L/R | 11 | −24 | 55 | −16 | −4.08 | |
| Insula | L/R | 13 | −34 | 11 | −15 | −3.82 | |
| PCC/Pcu | R | 7 | 8536 | 6 | −64 | 56 | −3.83 |
| pMTG | R | 39 | 4072 | −54 | −68 | 26 | −4.35 |
| RSC | R | 31 | 2312 | 24 | −46 | 4 | −2.99 |
| FFA | L | 20 | 1728 | −40 | −25 | −29 | −3.41 |
| aTP | L/R | 20 | 1336 | −46 | −3 | −33 | −3.71 |
Notes: x,y,z, coordinates of primary peak locations in the MNI space. Abbreviation: MNI, Montreal Neurological Institute space; LPI, left-posterior-inferior; BA, Brodmann’s area; R, right. L, left; Amy/Hippo, amygdala/hippocampus; vmPFC, ventromedial prefrontal cortex; vlPFC, ventrolateral prefrontal cortex; PCC, posterior cingulate cortex; Pcu, precuneus; RSC, retrosplenial cortex; FFA, fusiform area; aTP, anterior temporal pole.
The main effects of depression and mild cognitive impairment were not associated with increased GM volumes in any brain regions.
3.2.3. Interactions of depression and mild cognitive impairment on the GM volumes
The interactive effects of depression and mild cognitive impairment included GM volume loss in several brain regions including bilateral dorsomedial prefrontal cortex (DMPFC), dACC, vmPFC and cuneus; lentiform nucleus (LN) and superior frontal gyrus (SFG) on the left; and lingual gyrus (LG), Amy/Hippo and postcentral gyrus (PostCG) on the right (Figure 1 and Table 4) (p<0.01, FDR corrected).
Table 4.
Interactive effects of depression and cognitive impairment on gray matter volumes
| Brain region | Side | BA | Cluster Size (mm3) | MNI coordinates (LPI)
|
z Score | ||
|---|---|---|---|---|---|---|---|
| x | y | z | |||||
| DMPFC | L/R | 6,8 | 12128 | −4 | 14 | 62 | 3.90 |
| dACC | L/R | 24/32 | −6 | 15 | 46 | 3.24 | |
| SFG | L | 6 | −20 | 7 | 63 | 2.74 | |
| vmPFC | L/R | 10 | 1 | 51 | −10 | 2.94 | |
| LG | R | 18 | 5240 | 18 | −86 | −16 | 5.43 |
| Amy/Hippo | R | 4792 | 26 | −6 | −14 | 3.66 | |
| Cuneus | L/R | 19 | 3616 | −2 | −84 | 30 | 4.11 |
| LN | L | 2640 | −28 | 4 | −10 | 3.44 | |
| PostCG | R | 3 | 2288 | 44 | −28 | 59 | 3.76 |
Notes: x,y,z, coordinates of primary peak locations in the MNI space. Abbreviation: MNI, Montreal Neurological Institute space; LPI, left-posterior-inferior; BA, Brodmann’s area; R, right. L, left; DMPFC, dorsomedial prefrontal cortex; dACC, dorsal anterior cingulate cortex; SFG, superior frontal gyrus; LG, lingual gyrus; Amy/Hippo, amygdala/hippocampus; LN, lentiform nucleus; PostCG, post-central gyrus.
3.3. Main and Interactive effects of depressive symptom severity and episodic memory deficits on the GM volumes
After controlling for age, gender, education, ICV and individual group effects, depressive symptoms and episodic memory deficit interactions were seen in the right IFG/anterior insula (rIFG/aIns) and the left medial frontal gyrus (MeFG) clusters (p<0.01, FDR corrected) (Figure 2). There were no significant individual effects of depressive symptoms and episodic memory deficits on the GM volumes seen.
Figure 2. Multiple linear regression analysis examining the neuroanatomical correlates of depressive symptoms and episodic memory deficits interactions across all subjects (p < 0.01, FDR corrected).
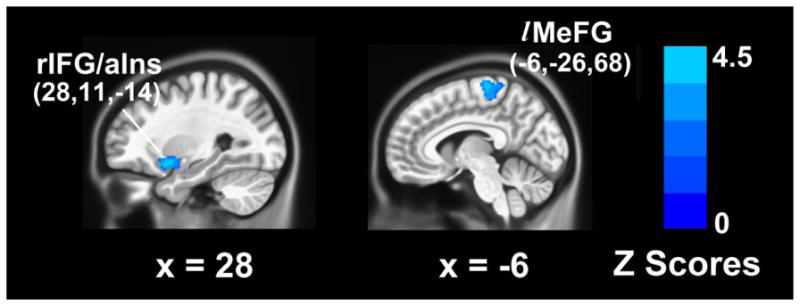
Blue color illustrates the opposite effects of geriatric depression scale (GDS) and logical memory II-delayed recall (LM II -DR) scores on GM volumes.
4. DISCUSSION
This is the first study to identify main and interactive relationships of LLD and aMCI on the GM volumes in older nondemented adults. While the main effects of LLD were associated with GM volume loss limited to the mood regulating circuitry structures, aMCI was associated with GM atrophy involving brain regions associated with multidomain cognitive functions. The interactions of LLD and aMCI detrimentally affect widespread GM regions implicated in early AD. Furthermore, the interactions of depressive symptoms with episodic memory deficits were associated with volume loss in the salience processing regions. Our findings shed light that the various subgroups of LLD, separated based on the degree of cognitive impairment, may have differential effects on the GM volumes, in nondemented older adults.
The areas that showed GM atrophy in the depressed groups included structures of the mood regulating circuitry that are consistently reported in the literature. The neurodegeneration confined to these brain regions that are integral to emotional regulation provide important insights into the pathophysiology of LLD. Previously, volume loss in the OFC [8], dACC [39], prefrontal and temporal cortices, insula, and the PCC/precuneus [6, 9] has been previously described in LLD. Several studies including a recently published meta-analysis have revealed OFC to being one of the key brain regions that showed significant volume loss in LLD [8, 10, 40]. Interestingly, one postmortem study showed reduction in the glial cell number and density in the OFC. While loss of excitatory pyramidal neuronal density in layers III and V are seen in the dorsolateral prefrontal cortex, loss of layer II nonpyramidal inhibitory local circuit neurons are demonstrated in the rostral OFC [41]. Smaller OFC volumes have been associated with functional disability in LLD [42]. Volume reductions in the dACC, the cognitive subdivision of ACC, has been associated with poorer antidepressant treatment response in LLD [8, 39, 43]. Furthermore, longitudinal studies have also demonstrated volume declines in the prefrontal and temporal cortices in older adults with depressive symptoms [13]. These structures are also key components of brain networks that are essential for episodic memory, executive function and attention-based cognitive performance. LLD often co-exist with varying levels of cognitive impairment in multiple memory and non-memory cognitive domains [44]. While frontal lobe subregional volume loss has consistently been associated with executive dysfunction in LLD [39], the link of regional brain atrophy with impairment in other cognitive domains are not well understood. Future longitudinal studies need to examine the complex relationships between multiple cognitive domain deficits and brain volume changes in the depressed elderly.
Our findings of GM reductions in the amygdala-hippocampal area, temporal cortices, insula, fusiform gyrus and the PCC in the aMCI groups have been demonstrated in previous studies [45]. GM atrophy in the amygdala-hippocampal area, thalamus and insula characterized patients with aMCI from cognitively healthy normals, and parietal and cingulate regional volume loss were considered pathognomonic of mild AD in one study [45]. However, GM volume reductions in the inferior temporal cortices, MTL, fusiform gyrus and the PCC have also been previously reported in aMCI [25]. aMCI patients who converted to AD had significantly greater GM atrophy in the insula, PCC, precuneus, amygdala, hippocampus, and frontal and temporal cortices, relative to the control group. MCI converters also showed more widespread GM volume reductions in the frontal, inferior parietal and temporal cortices, and the hippocampus than nonconverters [23, 24]. Recently published meta-analyses of structural neuroimaging studies have identified PCC, precuneus and MTL GM atrophy as antecedent biomarkers that can predict conversion of aMCI to AD [46, 47]. More importantly, the pattern of GM atrophic changes in MCI converters, especially in the temporal cortices, precuneus and the MTL, was similar to that seen in patients with mild AD, up to one year before the diagnosis of probable dementia.
To our knowledge, this the first study to demonstrate that the interactions between LLD and aMCI correlates with widespread GM volume reductions in the dorsal ACC, MTL, and prefrontal cortices, which are structures involved in early AD. Previously, greater fronto-parietal-temporal white matter atrophy in aMCI patients with subclinical depressive symptoms were reported than those without neuropsychiatric symptoms [48]. However, the study by Lee et al. mostly included aMCI patients with subclinical depressive symptoms. In contrast, we conducted detailed neuropsychiatric assessments to categorically define LLD and aMCI in our study cohort, and focused our investigations to examine the effects of these neuropsychiatric syndromes on the GM volumes. We are intrigued by the findings of volume loss in the somatosensory and the visual cortices, which are brain regions that are only affected later in the course of AD. Interestingly, functional brain alterations in these brain regions have been reported in pre-clinical AD states, though these studies did not report on the GM volume differences in their study population [49]. The GM atrophic patterns associated with LLD-aMCI interactions observed here illustrates that the co-morbidity of these behavioral phenotypes may be a marker of incipient AD.
The neuroanatomical correlates of the depressive symptom-episodic memory deficit interactions have not been previously reported. We found that the interaction between greater depressive symptoms (i.e., higher GDS scores) and higher episodic memory deficits (i.e., lower LM II–DR scores) were associated with decreased GM volumes in the right aIns/IFG and left MeFG clusters. aIns, a crucial hub that is engaged in the information transfer across multiple brain networks is implicated in salience processing. Moreover, our results underline the complex role of the right aIns/IFG in the higher-order social, emotional and cognitive processes including cognitive control, judgment and decision-making, empathy, and experiences of positive and negative feelings [50]. The involvement of the superior aspect of the MeFG in the severity of depressive symptom-memory deficit interactions is intriguing, though GM reductions in this region have been previously reported in LLD, in MCI converters and in AD patients [6, 23]. The role of this region in mood regulation and cognitive functions should be a focus of future investigations.
Various pathophysiologic mechanisms are proposed to explain the link of LLD with neurodegeneration and development of AD. LLD, at least in some, may share common pathophysiologic mechanisms with AD. Cortical amyloid and neurofibrillary tangle accumulation comparable to that seen in mild AD is reported in LLD [18, 19]. Also, LLD of early onset, recurrent and of longer duration may lead to chronic exposure of toxic cortisol levels, resulting in GM volume loss [51]. Subclinical cerebrovascular disease that is associated with LLD may damage white matter tract integrity and accelerate cognitive decline in some patients [52]. LLD may accelerate neuronal injury through confluence of various mechanisms thus increasing the risk of AD.
This study is not without limitations. First, the cross-sectional study design precludes us from assuming causality and from capturing the temporal sequence of the associations between LLD and GM volume reductions. Second, while small sample size in the co-morbid group is a limitation, we found detrimental effects of depression and MCI interactions on the GM volumes across the whole sample. Our findings need to be replicated in future studies with larger sample sizes where similar analyses are conducted using FDR as well as more stringent FWE correction procedures. Third, an ideal study design would have been to include antidepressant and cholinesterase inhibitor naïve participants to eliminate the potential confound of medication exposure, though the ethical aspects restricted us from performing such a study. It is noteworthy that majority of the depressed participants (cognitively normal with LLD: N=9 and aMCI with co-existing LLD: N=10) were nonresponders to at least one therapeutic antidepressant trial (i.e., at adequate dosages for at least 6 weeks). Both increased and decreased GM volumes are associated with antidepressant exposure in older adults [53, 54]. Interestingly, remitters with treatment resistant depression show GM volume increases than nonremitters in younger depressed adults [55].
5. CONCLUSION
Our results provide preliminary evidence that LLD with and without amnestic MCI has differential effects on GM volumes in the elderly. Since the interactive effects of LLD and aMCI are associated with GM loss in regions that are early targets of AD neuropathology, the co-existence of these clinical phenotypes may be a potential marker of AD. Neuroimaging biomarkers may provide greater degree of accuracy in predicting those with LLD who is at greater risk of future progression to AD.
Acknowledgments
This work was supported by Alzheimer’s Association New Investigator NIRG-11-204070 (JSG), Advancing Healthier Wisconsin Endowment for Research to MCW (JSG), Extendicare Foundation (JSG), National Alliance for Research in Schizophrenia and Depression (NARSAD) New Investigator, 1UL1RR031973 from the Clinical and Translational Science Award program of the National Center for Research Resources, NIH grant R01 AD20279 (SJL), and the National Natural Science of Foundation of China (81171021, 91132727, 81171323 (CX)). The authors thank Ms. Carrie O’Connor for editorial assistance, Mr. Douglas Ward for assistance with statistical analysis, and Ms. Judi Zaferos-Pylant and Mr. Yu Liu for MRI technical support.
Footnotes
The authors disclose no potential conflicts of interest, financial or otherwise, related directly or indirectly to this work. All authors have made substantial intellectual contribution to this manuscript in one or more of the following areas: design or conceptualization of the study, analysis or interpretation of the data, or drafting and revising the manuscript. All authors have given final approval of this manuscript.
PRESENTATION
This work was presented as a poster at the Alzheimer’s Imaging Consortium session of the Alzheimer’s Association International Conference, Vancouver, British Columbia, Canada, July 14-19, 2012.
References
- 1.Brodaty H, Breteler MM, Dekosky ST, Dorenlot P, Fratiglioni L, Hock C, et al. The world of dementia beyond 2020. J Am Geriatr Soc. 2011;59:923–7. doi: 10.1111/j.1532-5415.2011.03365.x. [DOI] [PubMed] [Google Scholar]
- 2.Barnes DE, Yaffe K. The projected effect of risk factor reduction on Alzheimer’s disease prevalence. Lancet Neurol. 2011;10:819–28. doi: 10.1016/S1474-4422(11)70072-2. [DOI] [PMC free article] [PubMed] [Google Scholar]
- 3.Alexopoulos GS. Depression in the elderly. Lancet. 2005;365:1961–70. doi: 10.1016/S0140-6736(05)66665-2. [DOI] [PubMed] [Google Scholar]
- 4.Goveas JS, Espeland MA, Woods NF, Wassertheil-Smoller S, Kotchen JM. Depressive symptoms and incidence of mild cognitive impairment and probable dementia in elderly women: the Women’s Health Initiative Memory Study. J Am Geriatr Soc. 2011;59:57–66. doi: 10.1111/j.1532-5415.2010.03233.x. [DOI] [PMC free article] [PubMed] [Google Scholar]
- 5.Ownby RL, Crocco E, Acevedo A, John V, Loewenstein D. Depression and risk for Alzheimer disease: systematic review, meta-analysis, and metaregression analysis. Arch Gen Psychiatry. 2006;63:530–8. doi: 10.1001/archpsyc.63.5.530. [DOI] [PMC free article] [PubMed] [Google Scholar]
- 6.Andreescu C, Butters MA, Begley A, Rajji T, Wu M, Meltzer CC, et al. Gray matter changes in late life depression--a structural MRI analysis. Neuropsychopharmacology. 2008;33:2566–72. doi: 10.1038/sj.npp.1301655. [DOI] [PMC free article] [PubMed] [Google Scholar]
- 7.Ashtari M, Greenwald BS, Kramer-Ginsberg E, Hu J, Wu H, Patel M, et al. Hippocampal/amygdala volumes in geriatric depression. Psychol Med. 1999;29:629–38. doi: 10.1017/s0033291799008405. [DOI] [PubMed] [Google Scholar]
- 8.Ballmaier M, Kumar A, Thompson PM, Narr KL, Lavretsky H, Estanol L, et al. Localizing gray matter deficits in late-onset depression using computational cortical pattern matching methods. Am J Psychiatry. 2004;161:2091–9. doi: 10.1176/appi.ajp.161.11.2091. [DOI] [PubMed] [Google Scholar]
- 9.Goveas JS, Espeland MA, Hogan P, Dotson V, Tarima S, Coker LH, et al. Depressive symptoms, brain volumes and subclinical cerebrovascular disease in postmenopausal women: the Women’s Health Initiative MRI Study. J Affect Disord. 2011;132:275–84. doi: 10.1016/j.jad.2011.01.020. [DOI] [PMC free article] [PubMed] [Google Scholar]
- 10.Sexton CE, Mackay CE, Ebmeier KP. A Systematic Review and Meta-Analysis of Magnetic Resonance Imaging Studies in Late-Life Depression. Am J Geriatr Psychiatry. 2012 doi: 10.1016/j.jagp.2012.10.019. [DOI] [PubMed] [Google Scholar]
- 11.Steffens DC, Byrum CE, McQuoid DR, Greenberg DL, Payne ME, Blitchington TF, et al. Hippocampal volume in geriatric depression. Biol Psychiatry. 2000;48:301–9. doi: 10.1016/s0006-3223(00)00829-5. [DOI] [PubMed] [Google Scholar]
- 12.Bell-McGinty S, Butters MA, Meltzer CC, Greer PJ, Reynolds CF, 3rd, Becker JT. Brain morphometric abnormalities in geriatric depression: long-term neurobiological effects of illness duration. Am J Psychiatry. 2002;159:1424–7. doi: 10.1176/appi.ajp.159.8.1424. [DOI] [PubMed] [Google Scholar]
- 13.Dotson VM, Davatzikos C, Kraut MA, Resnick SM. Depressive symptoms and brain volumes in older adults: a longitudinal magnetic resonance imaging study. J Psychiatry Neurosci. 2009;34:367–75. [PMC free article] [PubMed] [Google Scholar]
- 14.Kumar A, Jin Z, Bilker W, Udupa J, Gottlieb G. Late-onset minor and major depression: early evidence for common neuroanatomical substrates detected by using MRI. Proc Natl Acad Sci U S A. 1998;95:7654–8. doi: 10.1073/pnas.95.13.7654. [DOI] [PMC free article] [PubMed] [Google Scholar]
- 15.Pantel J, Schroder J, Essig M, Popp D, Dech H, Knopp MV, et al. Quantitative magnetic resonance imaging in geriatric depression and primary degenerative dementia. J Affect Disord. 1997;42:69–83. doi: 10.1016/s0165-0327(96)00105-x. [DOI] [PubMed] [Google Scholar]
- 16.Steffens DC, Payne ME, Greenberg DL, Byrum CE, Welsh-Bohmer KA, Wagner HR, et al. Hippocampal volume and incident dementia in geriatric depression. Am J Geriatr Psychiatry. 2002;10:62–71. [PubMed] [Google Scholar]
- 17.Zhao Z, Taylor WD, Styner M, Steffens DC, Krishnan KR, MacFall JR. Hippocampus shape analysis and late-life depression. PLoS One. 2008;3:e1837. doi: 10.1371/journal.pone.0001837. [DOI] [PMC free article] [PubMed] [Google Scholar]
- 18.Butters MA, Klunk WE, Mathis CA, Price JC, Ziolko SK, Hoge JA, et al. Imaging Alzheimer pathology in late-life depression with PET and Pittsburgh Compound-B. Alzheimer Dis Assoc Disord. 2008;22:261–8. doi: 10.1097/WAD.0b013e31816c92bf. [DOI] [PMC free article] [PubMed] [Google Scholar]
- 19.Kumar A, Kepe V, Barrio JR, Siddarth P, Manoukian V, Elderkin-Thompson V, et al. Protein binding in patients with late-life depression. Arch Gen Psychiatry. 2011;68:1143–50. doi: 10.1001/archgenpsychiatry.2011.122. [DOI] [PMC free article] [PubMed] [Google Scholar]
- 20.Modrego PJ, Ferrandez J. Depression in patients with mild cognitive impairment increases the risk of developing dementia of Alzheimer type: a prospective cohort study. Arch Neurol. 2004;61:1290–3. doi: 10.1001/archneur.61.8.1290. [DOI] [PubMed] [Google Scholar]
- 21.Petersen RC. Clinical practice. Mild cognitive impairment. N Engl J Med. 2011;364:2227–34. doi: 10.1056/NEJMcp0910237. [DOI] [PubMed] [Google Scholar]
- 22.Gomar JJ, Bobes-Bascaran MT, Conejero-Goldberg C, Davies P, Goldberg TE. Utility of combinations of biomarkers, cognitive markers, and risk factors to predict conversion from mild cognitive impairment to Alzheimer disease in patients in the Alzheimer’s disease neuroimaging initiative. Arch Gen Psychiatry. 2011;68:961–9. doi: 10.1001/archgenpsychiatry.2011.96. [DOI] [PubMed] [Google Scholar]
- 23.Bozzali M, Filippi M, Magnani G, Cercignani M, Franceschi M, Schiatti E, et al. The contribution of voxel-based morphometry in staging patients with mild cognitive impairment. Neurology. 2006;67:453–60. doi: 10.1212/01.wnl.0000228243.56665.c2. [DOI] [PubMed] [Google Scholar]
- 24.Risacher SL, Saykin AJ, West JD, Shen L, Firpi HA, McDonald BC. Baseline MRI predictors of conversion from MCI to probable AD in the ADNI cohort. Curr Alzheimer Res. 2009;6:347–61. doi: 10.2174/156720509788929273. [DOI] [PMC free article] [PubMed] [Google Scholar]
- 25.Trivedi MA, Wichmann AK, Torgerson BM, Ward MA, Schmitz TW, Ries ML, et al. Structural MRI discriminates individuals with Mild Cognitive Impairment from age-matched controls: a combined neuropsychological and voxel based morphometry study. Alzheimers Dement. 2006;2:296–302. doi: 10.1016/j.jalz.2006.06.001. [DOI] [PMC free article] [PubMed] [Google Scholar]
- 26.Folstein MF, Folstein SE, McHugh PR. “Mini-mental state”. A practical method for grading the cognitive state of patients for the clinician. J Psychiatr Res. 1975;12:189–98. doi: 10.1016/0022-3956(75)90026-6. [DOI] [PubMed] [Google Scholar]
- 27.Lucas JA, Ivnik RJ, Smith GE, Bohac DL, Tangalos EG, Kokmen E, et al. Normative data for the Mattis Dementia Rating Scale. J Clin Exp Neuropsychol. 1998;20:536–47. doi: 10.1076/jcen.20.4.536.1469. [DOI] [PubMed] [Google Scholar]
- 28.Wechsler D. Manual for the Wechsler Memory Scale--Revised. San Antonio: Psychological Corporation; 1987. [Google Scholar]
- 29.Lawton MP, Brody EM. Assessment of older people: self-maintaining and instrumental activities of daily living. Gerontologist. 1969;9:179–86. [PubMed] [Google Scholar]
- 30.Yesavage JA, Brink TL, Rose TL, Lum O, Huang V, Adey M, et al. Development and validation of a geriatric depression screening scale: a preliminary report. J Psychiatr Res. 1982;17:37–49. doi: 10.1016/0022-3956(82)90033-4. [DOI] [PubMed] [Google Scholar]
- 31.First MBSR, Gibbon M, et al. Structured Clinical Interview for DSM-1V TR Axis 1 disorders, research version, non-patient edition (SCID-I/NP) New York: Biometrics Research, New York State Psychiatric Institute; 2002. [Google Scholar]
- 32.Randolph C. Repeatable Battery for the Assessment of Neuropsychological Status. San Antonio: The Psychological Corporation; 1998. [Google Scholar]
- 33.Good CD, Johnsrude IS, Ashburner J, Henson RN, Friston KJ, Frackowiak RS. A voxel-based morphometric study of ageing in 465 normal adult human brains. Neuroimage. 2001;14:21–36. doi: 10.1006/nimg.2001.0786. [DOI] [PubMed] [Google Scholar]
- 34.Hulshoff Pol HE, Schnack HG, Posthuma D, Mandl RC, Baare WF, van Oel C, et al. Genetic contributions to human brain morphology and intelligence. J Neurosci. 2006;26:10235–42. doi: 10.1523/JNEUROSCI.1312-06.2006. [DOI] [PMC free article] [PubMed] [Google Scholar]
- 35.Benjamini Y, Hochberg Y. Controlling the false discovery rate: a practical and powerful approach to multiple testing. J R Statist Soc. 1995;B:289–300. [Google Scholar]
- 36.Genovese CR, Lazar NA, Nichols T. Thresholding of statistical maps in functional neuroimaging using the false discovery rate. Neuroimage. 2002;15:870–8. doi: 10.1006/nimg.2001.1037. [DOI] [PubMed] [Google Scholar]
- 37.Goveas J, Xie C, Wu Z, Douglas Ward B, Li W, Franczak MB, et al. Neural correlates of the interactive relationship between memory deficits and depressive symptoms in nondemented elderly: resting fMRI study. Behav Brain Res. 2011;219:205–12. doi: 10.1016/j.bbr.2011.01.008. [DOI] [PMC free article] [PubMed] [Google Scholar]
- 38.Xie C, Goveas J, Wu Z, Li W, Chen G, Franczak M, et al. Neural basis of the association between depressive symptoms and memory deficits in nondemented subjects: resting-state fMRI study. Hum Brain Mapp. 2011 doi: 10.1002/hbm.21291. [DOI] [PMC free article] [PubMed] [Google Scholar]
- 39.Alexopoulos GS, Gunning-Dixon FM, Latoussakis V, Kanellopoulos D, Murphy CF. Anterior cingulate dysfunction in geriatric depression. Int J Geriatr Psychiatry. 2008;23:347–55. doi: 10.1002/gps.1939. [DOI] [PubMed] [Google Scholar]
- 40.Taylor WD, Macfall JR, Payne ME, McQuoid DR, Steffens DC, Provenzale JM, et al. Orbitofrontal cortex volume in late life depression: influence of hyperintense lesions and genetic polymorphisms. Psychol Med. 2007;37:1763–73. doi: 10.1017/S0033291707000128. [DOI] [PubMed] [Google Scholar]
- 41.Rajkowska G. Postmortem studies in mood disorders indicate altered numbers of neurons and glial cells. Biol Psychiatry. 2000;48:766–77. doi: 10.1016/s0006-3223(00)00950-1. [DOI] [PubMed] [Google Scholar]
- 42.Taylor WD, Steffens DC, McQuoid DR, Payne ME, Lee SH, Lai TJ, et al. Smaller orbital frontal cortex volumes associated with functional disability in depressed elders. Biol Psychiatry. 2003;53:144–9. doi: 10.1016/s0006-3223(02)01490-7. [DOI] [PubMed] [Google Scholar]
- 43.Gunning FM, Cheng J, Murphy CF, Kanellopoulos D, Acuna J, Hoptman MJ, et al. Anterior cingulate cortical volumes and treatment remission of geriatric depression. Int J Geriatr Psychiatry. 2009;24:829–36. doi: 10.1002/gps.2290. [DOI] [PMC free article] [PubMed] [Google Scholar]
- 44.Bhalla RK, Butters MA, Becker JT, Houck PR, Snitz BE, Lopez OL, et al. Patterns of mild cognitive impairment after treatment of depression in the elderly. Am J Geriatr Psychiatry. 2009;17:308–16. doi: 10.1097/JGP.0b013e318190b8d8. [DOI] [PMC free article] [PubMed] [Google Scholar]
- 45.Karas GB, Scheltens P, Rombouts SA, Visser PJ, van Schijndel RA, Fox NC, et al. Global and local gray matter loss in mild cognitive impairment and Alzheimer’s disease. Neuroimage. 2004;23:708–16. doi: 10.1016/j.neuroimage.2004.07.006. [DOI] [PubMed] [Google Scholar]
- 46.Ferreira LK, Diniz BS, Forlenza OV, Busatto GF, Zanetti MV. Neurostructural predictors of Alzheimer’s disease: a meta-analysis of VBM studies. Neurobiol Aging. 2011;32:1733–41. doi: 10.1016/j.neurobiolaging.2009.11.008. [DOI] [PubMed] [Google Scholar]
- 47.Schroeter ML, Stein T, Maslowski N, Neumann J. Neural correlates of Alzheimer’s disease and mild cognitive impairment: a systematic and quantitative meta-analysis involving 1351 patients. Neuroimage. 2009;47:1196–206. doi: 10.1016/j.neuroimage.2009.05.037. [DOI] [PMC free article] [PubMed] [Google Scholar]
- 48.Lee GJ, Lu PH, Hua X, Lee S, Wu S, Nguyen K, et al. Depressive symptoms in mild cognitive impairment predict greater atrophy in Alzheimer’s disease-related regions. Biol Psychiatry. 2012;71:814–21. doi: 10.1016/j.biopsych.2011.12.024. [DOI] [PMC free article] [PubMed] [Google Scholar]
- 49.Machulda MM, Senjem ML, Weigand SD, Smith GE, Ivnik RJ, Boeve BF, et al. Functional magnetic resonance imaging changes in amnestic and nonamnestic mild cognitive impairment during encoding and recognition tasks. J Int Neuropsychol Soc. 2009;15:372–82. doi: 10.1017/S1355617709090523. [DOI] [PMC free article] [PubMed] [Google Scholar]
- 50.Menon V, Uddin LQ. Saliency, switching, attention and control: a network model of insula function. Brain Struct Funct. 2010;214:655–67. doi: 10.1007/s00429-010-0262-0. [DOI] [PMC free article] [PubMed] [Google Scholar]
- 51.Sapolsky RM. Glucocorticoids and hippocampal atrophy in neuropsychiatric disorders. Arch Gen Psychiatry. 2000;57:925–35. doi: 10.1001/archpsyc.57.10.925. [DOI] [PubMed] [Google Scholar]
- 52.Steffens DC, Potter GG, McQuoid DR, MacFall JR, Payne ME, Burke JR, et al. Longitudinal magnetic resonance imaging vascular changes, apolipoprotein E genotype, and development of dementia in the neurocognitive outcomes of depression in the elderly study. Am J Geriatr Psychiatry. 2007;15:839–49. doi: 10.1097/JGP.0b013e318048a1a0. [DOI] [PubMed] [Google Scholar]
- 53.Geerlings MI, Brickman AM, Schupf N, Devanand DP, Luchsinger JA, Mayeux R, et al. Depressive Symptoms, Antidepressant Use, and Brain Volumes on MRI in a Population-Based Cohort of Old Persons without Dementia. J Alzheimers Dis. 2012 doi: 10.3233/JAD-2012-112009. [DOI] [PMC free article] [PubMed] [Google Scholar]
- 54.Lavretsky H, Roybal DJ, Ballmaier M, Toga AW, Kumar A. Antidepressant exposure may protect against decrement in frontal gray matter volumes in geriatric depression. J Clin Psychiatry. 2005;66:964–7. doi: 10.4088/jcp.v66n0801. [DOI] [PubMed] [Google Scholar]
- 55.Phillips JL, Batten LA, Aldosary F, Tremblay P, Blier P. Brain-volume increase with sustained remission in patients with treatment-resistant unipolar depression. J Clin Psychiatry. 2012 doi: 10.4088/JCP.11m06865. [DOI] [PubMed] [Google Scholar]