

Abstract
Motivation: TRAIL has been widely studied for the ability to kill cancer cells selectively, but its clinical usefulness has been hindered by the development of resistance. Multiple compounds have been identified that sensitize cancer cells to TRAIL-induced apoptosis. The drug LY303511 (LY30), combined with TRAIL, caused synergistic (greater than additive) killing of multiple cancer cell lines. We used mathematical modelling and ordinary differential equations to represent how LY30 and TRAIL individually affect HeLa cells, and to predict how the combined treatment achieves synergy.
Results: Model-based predictions were compared with in vitro experiments. The combination treatment model was successful at mimicking the synergistic levels of cell death caused by LY30 and TRAIL combined. However, there were significant failures of the model to mimic upstream activation at early time points, particularly the slope of caspase-8 activation. This flaw in the model led us to perform additional measurements of early caspase-8 activation. Surprisingly, caspase-8 exhibited a transient decrease in activity after LY30 treatment, prior to strong activation. cFLIP, an inhibitor of caspase-8 activation, was up-regulated briefly after 30 min of LY30 treatment, followed by a significant down-regulation over prolonged exposure. A further model suggested that LY30-induced fluctuation of cFLIP might result from tilting the ratio of two key species of reactive oxygen species (ROS), superoxide and hydrogen peroxide. Computational modelling extracted novel biological implications from measured dynamics, identified time intervals with unexplained effects, and clarified the non-monotonic effects of the drug LY30 on cFLIP during cancer cell apoptosis.
Supplementary information: Supplementary data are available at Bioinformatics online.
Contact: LisaTK@nus.edu.sg or Shazib_Pervaiz@nuhs.edu.sg
1 INTRODUCTION
Combinations of drugs can have non-obvious effects on a biological system, and the magnitude of their final effect can be synergistic, additive or antagonistic: meaning larger, the same as or smaller than the sum of the individual treatments (Chait et al., 2007). For treating cancers, some of the current standards of care are combination therapies, but the development of synergistic combinations has been an expensive and laborious process of empirical testing (Fitzgerald et al., 2006). Computational modelling of pathway dynamics has the potential to predict the effects of combination treatments, and could be useful in the design of multi-drug therapies. Single perturbations of a system (e.g. inhibiting an enzyme) are commonly studied using traditional experimental methods, but combinations of perturbations, too numerous to study experimentally, can be examined using computational tools (Koch et al., 2009), based on existing models that describe the effects of single drugs. We used modelling to study the combination of TRAIL and LY303511, towards understanding their synergy and also aiding in the discovery of an unknown effect of LY303511.
The polypeptide ligand TRAIL (TNF-related apoptosis-inducing ligand, or Apo2L) induces death receptor-mediated apoptosis (programmed cell death) according to a well-studied pathway (Falschlehner et al., 2007). TRAIL is currently undergoing phase I/II clinical evaluation for a variety of cancers, and it holds real promise as a therapeutic strategy owing to its selective targeting of cancer cells while sparing normal tissues (Abdulghani and El-Deiry, 2010; Amm et al., 2011). However, development of resistance is a serious obstacle to the effective clinical use of TRAIL, and combination therapies to overcome resistance to TRAIL, or to induce re-sensitization to TRAIL, could be extremely important for enabling TRAIL-based therapies to succeed (Amm et al., 2011; Lee et al., 2007; Wang, 2008; Zhang and Fang, 2005).
The small molecule compound LY30 (LY303511) has been shown to sensitize multiple cancer cell lines to TRAIL-induced apoptosis (Poh et al., 2007; Shenoy et al., 2009) and vincristine-induced apoptosis (Poh and Pervaiz, 2005). LY30 is an inactive analogue of the phosphoinositide 3-kinase (PI3K) inhibitor LY294002 (Gharbi et al., 2007; Jacobs et al., 2005), and is related to the non-specific kinase inhibitor quercetin (Davies et al., 2000). LY30 produces high levels of ROS (reactive oxygen species), which may be particularly harmful to cancer cells that have high metabolic rates and oxidative stress. Our recent studies found a synergistic anti-cancer effect by combining LY30 and TRAIL (Poh and Pervaiz, 2005; Poh et al., 2007; Shenoy et al., 2009). Treating cells with low doses of TRAIL plus with low doses of LY30 caused robust activation of the apoptotic pathway, while treatment with either agent alone caused minimal death.
We undertook the task of modelling the effects of LY30 in the network of TRAIL-induced apoptosis, with the aim of evaluating whether the molecular effects known to be caused by LY30 were sufficient to explain the synergy of the LY30–TRAIL combination. We were successful in using modelling to recapitulate the synergistic levels of cell death that were observed. However, the simulated activation kinetics of pro-apoptotic caspase enzymes along the pathway showed poor correlation with experimental data. In particular, there were large mismatches between simulation and experiment at early time points, particularly for upstream regions of the pathway. This suggested further experiments focusing on caspase-8 activation shortly after treatment. New data revealed an even larger and more obvious mismatch between simulation and experimental data: specifically, LY30 treatment had a brief inhibitory effect on caspase-8, 30 min after treatment. Finally, we modelled two sources of ROS that might explain the effects of LY30 on caspase-8 activation, and that might be relevant for other anti-cancer drugs.
2 METHODS
2.1 Cell and treatments
HeLa was purchased from ATCC (Rockville, MD, USA) and maintained in DMEM supplemented with 10% FBS, 1% l-glutamine and 1% S-penicillin. HeLa cells were plated at 0.125 million cells/well in 24-well plates (and proportionally for other size plates) and grown overnight until 80% confluent. All treatments with LY30 (Alexis, Switzerland) and TRAIL (Biomol, Plymouth Meeting, PA, USA) used the methods and doses of (Poh et al., 2007); all combination treatments of LY30 and TRAIL involved pre-incubation of cells with 25 µM LY30 for 1 h before adding 20 ng/ml TRAIL. Experiments with the superoxide scavenger Tiron (Sigma-Aldrich) applied 10 mM to cells 1 h before adding LY30. Experiments with the H2O2 scavenger catalase (C3511 catalase from bovine liver, Sigma-Aldrich) used a dose of 2000 units/ml, added 1 day before treatment, then added again the next day for co-incubation with LY30 after changing the medium. Treatments for supplementary experiments are described in Supplementary Material 4.1.
2.2 Viability
After treatment with LY30, TRAIL or the combination for 24 h, cells were washed with 1× PBS, stained with crystal violet for 20 min, and washed three times with pure water. For quantification, crystal violet was dissolved in 1% SDS with shaking for 1 h, and then measured using absorbance at 595 nm with a Tecan microplate reader.
2.3 Caspase activity
HeLa cells, after the indicated treatments and incubations, were harvested, washed with 1× PBS, re-suspended in chilled cell lysis buffer (BD Pharmingen, San Diego, CA, USA) and incubated on ice for 10 min. Caspase-3 and Caspase-8 enzyme activities were assayed using 7-amino trifluoromethylcoumarin and 7-amino-4-methylcoumarin-conjugated substrates (BioMol) as reported previously (Poh et al., 2007).
2.4 SDS-PAGE and western blotting
Hela cells were grown in 60 mm Petri dishes until 80% confluent, and treated with LY30 for the indicated durations. Cells were harvested and washed once with 1× PBS before lysis using cell lysis buffer (150 mM NaCl, Tris–HCl 7.4 and 1% Nonidet P40) with a cocktail of protease inhibiors (1 mM PMSF, 10 µg/ml aprotinin, 20 µg/ml pepstatin A and 10 µg/ml leupeptin). 100 µg of cell lysate was then subjected to SDS-PAGE on a 12% polyacrylamide gel before being electro-transferred onto Immobilon-P membranes (Millipore Corporation, Bedford, MA, USA). Membranes were blocked using 5% non-fat dry milk in TBST (TBS with 0.5% Tween20) and probed overnight at 4°C with cFLIP antibody (Santa Cruz Biotechnology Inc., Santa Cruz, CA, USA). β-actin or GAPDH (both from Santa Cruz Biotechnology Inc., Santa Cruz, CA, USA) was used as a loading control. Primary antibodies were detected using HRP-conjugated anti-mouse or anti-rabbit antibodies and visualized using enhanced chemiluminescence detection (ECL reagents from Roche, Indianapolis, IN, USA). Densities were quantified using Image J (http://rsb.info.nih.gov/ij/).
2.5 Simulations
All biological events were modelled with ordinary differential equations (ODEs) as elementary reactions with mass action kinetics. KroneckerBio toolbox (Toettcher et al., 2010) in MATLAB (Polking, 1995) and Copasi (Hoops et al., 2006) were used for simulating the ODE models. In the TRAIL pathway model, synthesis and degradation effects were only modelled for caspases. Degradation processes used first-order reactions, and protein synthesis used zeroth-order reactions, with synthesis rate assigned so that the initial concentrations of the Albeck model (Albeck et al., 2008b) would be equal to the steady state of the model system without TRAIL. Monte Carlo simulations were carried out with sample size of 10 000 cells with normal distributions of initial concentrations (mean equal to the initial concentration in the Albeck model, and variance equal to 40% of the mean initial concentration). PLOT was used for visualizing simulations. The comparison of relative caspase activity measurements with simulations of absolute caspase numbers is described in Supplementary Material 1.6.
2.6 Statistical analysis
All experiments were performed at least three times for statistical significance. Numerical data were expressed as mean ± SD. Statistical analysis was performed using the one-tailed paired Student’s t-test considering the variances unequal. P values < 0.05 were considered significant.
3 RESULTS
3.1 Model construction for single and combination treatments
3.1.1 Trail model
To study the synergy between LY30 and TRAIL, we adapted a previous model of TRAIL-induced apoptosis (Albeck et al., 2008b), and added reaction equations for the impact of LY30 on the network. The Albeck model was supported by extensive experimental measurements in HeLa (cervical carcinoma) cells, but those experiments involved cycloheximide, an inhibitor of protein synthesis. A lack of turnover effects in the Albeck model means that even an insignificant pro-apoptotic input is able to accumulate, without degradation, until the cell eventually dies (Bagci et al., 2006; Eissing et al., 2004). Apoptosis has evolved to occur in an all-or-nothing manner because one of the key outcomes of apoptosis is fragmentation of the DNA. Partial apoptosis would pose a grave danger to chromosomal integrity. To permit the system to simulate a bistable switch between survival and apoptosis, we included synthesis and degradation, by approximating them with mass-action rate equations (Fig. 1 and Supplementary Tables S1.1–S1.3). This modification renders the model less quantitative, but we believe this level of simplification is still highly informative for inferring system-level effects. We made several additional modifications to Albeck’s TRAIL model: feedback from activated caspase-3 to activated caspase-9 (Zou et al., 2003), feedback from caspase-3 to caspase-8 without caspase-6 (Ferreira et al., 2012; Yang et al., 2006) and a higher concentration for the protein cFLIP (cellular FADD-like interleukin-1β-converting enzyme inhibitory protein), which was artificially lowered in the Albeck model as a side-effect of using cycloheximide (Kreuz et al., 2001). Also we used Apoptosis Repressor with a Caspase recruitment domain (Heikaus et al., 2008; Jo et al., 2004) instead of bifunctional apoptosis regulator (BAR) to better represent the inhibition of caspase-8, which was stipulated by (Eissing et al., 2004).
Fig. 1.

Schematic diagram of TRAIL-induced apoptosis. The dashed arrows indicate catalytic effects. Solid arrows indicate that the species at the base is consumed or translocated. For example, the oligomerization of mitochondrial Bax leads to formation of a pore in the mitochondrial outer membrane, which allows release of cytochrome c and Smac into the cytosol. Inhibitory relationships are denoted by a bar with crossbrace. (Details of inhibition are provided in Supplementary Tables S1.1–S1.3) Synthesis and degradation are not shown
3.1.2 LY30 model
Poh et al. identified two specific effects of LY30 that might explain its ability to sensitize HeLa carcinoma cells to TRAIL (Poh et al., 2007): (i) clustering of TRAIL receptors, and (ii) down-regulating the pro-survival protein cFLIP. Figure 2 illustrates how these effects have been modelled. Clustering is modelled by an LY30-catalysed transition in the TRAIL receptor, converting a slow-reacting form into a faster-reacting form that we call ‘Primed-receptor’. The cFLIP down-regulation is modelled as an LY30-catalysed degradation reaction, which is intended to represent any variety of possible mechanisms including transcriptional repression, ubiquitylation, etc. In addition, LY30 has been shown to produce ROS (Poh and Pervaiz, 2005; Poh et al., 2007), particularly hydrogen peroxide (H2O2) (Shenoy et al., 2009), which can promote death through a variety of pathways (Clément and Pervaiz, 2001; Pervaiz and Clément, 2002). Here, we model ROS as causing some amount of mitochondrial permeability (Yamakawa et al., 2000; Zuo et al., 2009), and also causing mitochondria-independent death in a small subpopulation of cells (Hampton and Orrenius, 1997; Ruffels et al., 2004). The parameter estimation is described in Supplementary Material 1.4. Our work is specific to TRAIL-induced apoptosis in HeLa cells, and we did not model additional phenomena found in other cell types (Shenoy et al., 2009) or in other death pathways (Kristof et al., 2005).
Fig. 2.

Schematic of how LY30 affects TRAIL-induced apoptosis. The receptors alone would have slower reaction rates than the primed receptors. Parameter values are listed in the Supplementary Material
3.1.3 LY30+trail model
The TRAIL model was combined with the LY30 model to produce a theoretical model of how the combination of LY30 and TRAIL would affect apoptosis in HeLa. To mimic the combined treatment, we followed the experimental protocol of Poh et al., pre-incubating cells with LY30 at 25 µM for 1 h before treating with TRAIL. In other words, the initial concentration of TRAIL was set to zero during the first hour with LY30 input, and then the TRAIL level was increased to the delivered dose of 20 ng/ml.
3.2 Simulation of synergistic effects
Our previous measurements of apoptotic signalling in LY30-treated HeLa cells (Poh et al., 2007) showed that the combination of LY30 and TRAIL induced synergistic (greater than additive) activation of many stages of the apoptotic pathway, including initiator and executioner caspases. To increase the statistical significance of the cell death measurements, we repeated the measurements of cell death. The combined dataset (Fig. 3) shows cell death to occur synergistically, with the rate of killing by TRAIL+LY30 to be 30% higher than the rate expected from a purely additive effect.
Fig. 3.

Simulated and observed cell viability. Cell viability was measured by crystal violet assay at 24 h after treatment with LY30 and/or TRAIL (repeated three times and normalized to untreated control)
Apoptosis proceeds in an all-or-nothing fashion, as a ‘snap action’ switch, preceded by a variable time delay (Albeck et al., 2008a; Albeck et al., 2008b). This creates significant discrepancy between the concentrations in individual cells, and in the average concentrations in a population of cells that undergo apoptosis with variable delay. Individual cells exhibit much sharper slopes in their activation levels than the population average (Albeck et al., 2008a). Because our model will be compared with data from populations of cells (immunoblots and enzyme activity assays), we need to model apoptosis signalling in a population of cells (Supplementary Fig. S1.5). We used Monte Carlo sampling to compute an average trajectory, using simulations of 10 000 instances for each treatment condition, and normally distributed initial concentrations with 40% variance. In keeping with previous work, we define apoptosis (death) to occur when poly ADP ribose polymerase is at least 50% cleaved (Albeck et al., 2008b). Cell viability was simulated for single and combination drug treatments.
Comparing simulations against the Figure 3 experimental measurements showed the model to be successful at recapitulating the observed synergy between LY30 and TRAIL. This finding provides a ‘proof of plausibility’ that the LY30-induced effects of death receptor clustering, cFLIP down-regulation and ROS production are sufficient to facilitate significant sensitization to apoptosis, in cells treated with otherwise sub-lethal doses of TRAIL.
3.2.1 Model discrepancy
When we inspected the simulated levels of individual proteins, internal to the apoptotic pathway, we found the simulations did not resemble experimental observations. A variety of estimated parameter sets and model re-optimization efforts were unable to alleviate the qualitative divergence of the model from the observations (data not shown). Figure 4 compares simulated caspase-8 activity against experimentally measured caspase-8 activity for the same three treatment conditions. Simulations agreed reasonably with experiments for the treatments with LY30 alone or TRAIL alone. However, simulations predict that LY30+TRAIL induction of caspase-8 would achieve synergy (greater than additive) effect quickly and would peak before 5 h. In contrast, experimental measurements of caspase-8 showed a sharp rise much later (10 h) and no synergy at early time points. Mismatches were also seen downstream of caspase-8 (Supplementary Figs S1.7–S1.8). Because caspase activity measurements are not isoform specific, measurements were repeated using Bcl2 over-expression to decouple upstream and downstream caspases, but the caspase-8 trends were unchanged (Supplementary Figs S4.2–S4.5). A pattern of mismatch indicates a flaw in the model, and we hypothesize that biological events upstream of caspase-8 differ from the expected model, especially at early time points.
Fig. 4.

Comparison of simulated caspase-8 activity versus experimental measurements for caspase-8 activation by LY30 and TRAIL. Solid lines represent averaged results of 10 000 Monte Carlo simulations. Caspase-8 activity is plotted as relative fold-change versus untreated, meaning that untreated cells (time = 0) have activity 1.0. Black squares show the published fold-change of protein activity relative to untreated control. Supplementary Material 1.6 describes the conversion from simulated levels of absolute caspase-8 activity, into estimates of relative fold-change of measured activity, to account for cross-talk between multiple caspase isoforms
3.3 New experimental measurements of caspase 8 and cFLIP
The mismatch between model and experiments for the onset of LY30+TRAIL synergy provided a narrow specification for the molecules and time points in greatest need of clarification. New experiments were thus performed to measure caspase-8 activity at more finely spaced time points after LY30.
Figure 5 shows the effect of LY30 on caspase-8 enzymatic activity over time, with frequently spaced time points after treatment. We had expected LY30 to increase caspase-8 activity, but this experiment showed unexpected transient behaviours, with LY30 causing a significant decrease in caspase-8 activity at 2 h. Our model of LY30 effects (Fig. 2 and Supplementary Tables) does not include any possible way for LY30 to delay caspase-8 nor to inhibit apoptosis. This puzzle motivated us to perform more detailed measurements of caspase-8 dynamics.
Fig. 5.

Caspase-8 activity measurements in Hela cells after different durations of LY30 treatment. Cells were treated with LY30 for 30, 60, 120, 180 or 240 min, or untreated (0 min). LY30 treatment caused a significant decrease of caspase-8 activity at 2 h, according to a one-sample t-test with Bonferroni correction
Some unknown effect of LY30 must occur, and we can infer it to be upstream of caspase-8, at least as soon as 2 h. Knowing that LY30 affects cFLIP (Poh et al., 2007), and knowing that cFLIP has complex regulation (Fukazawa et al., 2001; Peter, 2004), we repeated the measurements of cFLIP with denser time intervals. Figure 6 shows more complex dynamics of cFLIP protein expression. Surprisingly, cFLIP was initially up-regulated by LY30 treatment, before it declined. FADD levels were unchanged (Supplementary Fig. S4.7).
Fig. 6.

Western blot analysis of cFLIP in Hela after different durations of LY30 treatment. (a) Western blot of time dynamics of cFLIP after LY30 treatment; (b) Quantified fold-change of cFLIP protein levels after 30 min of LY30 treatment. cFLIP band intensities (with three biological replications) were normalized to β-actin intensity (loading control) before comparing with untreated to obtain relative fold-change
These up-and-down results demonstrated that the effect of LY30 on cFLIP is more complex than a simple down-regulation. To find a pathway to explain the non-monotonic regulation of cFLIP by LY30, we need to consider upstream regulators of cFLIP and downstream effectors of LY30. We next studied ROS effects in greater detail because ROS are known to be produced by LY30 (Poh and Pervaiz, 2005; Poh et al., 2007; Shenoy et al., 2009) as demonstrated by fluorescent measurements of dichlorofluorescin diacetate (DCFDA). Meanwhile, ROS is known to regulate cFLIP (Lee et al., 2009).
DCFDA is the most commonly used indicator to measure ROS, but it can be activated by
multiple types of ROS. ROS is a family of several species, with H2O2
(hydrogen peroxide) and  (superoxide) being the most abundant. In many cases, the ratio of
 to H2O2 determines
whether ROS will promote or hinder apoptosis (Clément and Pervaiz, 2001; Pervaiz
and Clement, 2007; Pervaiz and
Clément, 2002; Tang et
al., 2011). A high ratio of
to H2O2 determines
whether ROS will promote or hinder apoptosis (Clément and Pervaiz, 2001; Pervaiz
and Clement, 2007; Pervaiz and
Clément, 2002; Tang et
al., 2011). A high ratio of  to
H2O2 antagonizes apoptosis by triggering pro-survival pathways
such as PI3K/Akt and extracellular signal-regulated kinase (ERK) (Lim and Clement, 2007; Zhu et al., 2011). In contrast, a low ratio of
to
H2O2 antagonizes apoptosis by triggering pro-survival pathways
such as PI3K/Akt and extracellular signal-regulated kinase (ERK) (Lim and Clement, 2007; Zhu et al., 2011). In contrast, a low ratio of
 to H2O2 promotes
apoptosis through intracellular acidification (Pervaiz and Clément, 2002), activation of caspase-3 and -9 (Yamakawa et al., 2000),
down-regulation of cFLIP (Nitobe et
al., 2003) and down-regulation of NHE1 (Akram et al., 2006; Pervaiz and Clement, 2007).
to H2O2 promotes
apoptosis through intracellular acidification (Pervaiz and Clément, 2002), activation of caspase-3 and -9 (Yamakawa et al., 2000),
down-regulation of cFLIP (Nitobe et
al., 2003) and down-regulation of NHE1 (Akram et al., 2006; Pervaiz and Clement, 2007).
3.4 New model of LY30-induced cFLIP regulation via ROS
We constructed a simple hypothetical model of  and H2O2 production and degradation, emphasizing the differential
effects of
and H2O2 production and degradation, emphasizing the differential
effects of  and H2O2 on cFLIP
(Fig. 7a). Experimental evidence indicates
that intracellular ROS and reactive nitrogen species (RNS) regulate cFLIP expression:
nitric oxide (NO)-dependent S-nitrosylation of cFLIP prevents its ubiquitination (Iyer et al., 2008), and
S-nitrosylation can be augmented by superoxide. Conversely, H2O2
promotes ubiquitination and proteasomal degradation of cFLIP (Nitobe et al., 2003), and
H2O2 can cause a decrease in cFLIP expression. These cFLIP-related
effects are consistent with our recent findings on the differential effects of
intracellular H2O2 and
and H2O2 on cFLIP
(Fig. 7a). Experimental evidence indicates
that intracellular ROS and reactive nitrogen species (RNS) regulate cFLIP expression:
nitric oxide (NO)-dependent S-nitrosylation of cFLIP prevents its ubiquitination (Iyer et al., 2008), and
S-nitrosylation can be augmented by superoxide. Conversely, H2O2
promotes ubiquitination and proteasomal degradation of cFLIP (Nitobe et al., 2003), and
H2O2 can cause a decrease in cFLIP expression. These cFLIP-related
effects are consistent with our recent findings on the differential effects of
intracellular H2O2 and  on cell fate signalling (Clément and Pervaiz,
2001; Pervaiz and Clément,
2002). The trend of
on cell fate signalling (Clément and Pervaiz,
2001; Pervaiz and Clément,
2002). The trend of  promoting survival and H2O2 promoting apoptosis was modelled in
Figure 7a via cFLIP. This model includes
cFLIP production, cFLIP degradation, inhibition of cFLIP degradation by
promoting survival and H2O2 promoting apoptosis was modelled in
Figure 7a via cFLIP. This model includes
cFLIP production, cFLIP degradation, inhibition of cFLIP degradation by
 , inhibition of cFLIP production by
H2O2, as well as
, inhibition of cFLIP production by
H2O2, as well as  production,
  conversion into H2O2
and H2O2 degradation. (Reaction equations, parameters and literature
sources are specified in Supplementary Tables S2.1–S2.3).
conversion into H2O2
and H2O2 degradation. (Reaction equations, parameters and literature
sources are specified in Supplementary Tables S2.1–S2.3).
Fig. 7.

Hypothetical model for LY30 to cause non-monotonic regulation of
cFLIP via  and H2O2.
(a) Simplified diagram of LY30’s influence on cFLIP. This model
is roughly divided into two phases. In the earlier phase,
and H2O2.
(a) Simplified diagram of LY30’s influence on cFLIP. This model
is roughly divided into two phases. In the earlier phase,
 is produced after LY30 treatment, and
the increased
is produced after LY30 treatment, and
the increased  will block the degradation of cFLIP, thus inducing its
up-regulation. In the later phase, H2O2 is produced by
conversion of
will block the degradation of cFLIP, thus inducing its
up-regulation. In the later phase, H2O2 is produced by
conversion of  , and inhibits the production of cFLIP, lowering its
concentration. (b) Simulations of cFLIP, cFLIP_mRNA and degraded cFLIP
(cFLIP_Deg) over time, as predicted by the model in Figure 7a. The model is fully specified in Supplementary Tables
, and inhibits the production of cFLIP, lowering its
concentration. (b) Simulations of cFLIP, cFLIP_mRNA and degraded cFLIP
(cFLIP_Deg) over time, as predicted by the model in Figure 7a. The model is fully specified in Supplementary Tables
Our model of ROS and cFLIP was then simulated to explore whether the dynamics of
 and H2O2 could
plausibly explain both the cFLIP increase at 30 min and the cFLIP decrease at 6 h. Many
compounds can cause production of
and H2O2 could
plausibly explain both the cFLIP increase at 30 min and the cFLIP decrease at 6 h. Many
compounds can cause production of  ,
which then gets converted into H2O2, so we designed the model to be
generally applicable to ROS-producing anti-cancer drugs. Simulations (Fig. 7b) show that LY30-induced ROS could cause cFLIP levels to
rise at 30 min and then fall in subsequent hours, due to faster pro-cFLIP influences from
,
which then gets converted into H2O2, so we designed the model to be
generally applicable to ROS-producing anti-cancer drugs. Simulations (Fig. 7b) show that LY30-induced ROS could cause cFLIP levels to
rise at 30 min and then fall in subsequent hours, due to faster pro-cFLIP influences from
 , and slower anti-cFLIP influences from
H2O2. Up-and-down behaviour of cFLIP can introduce delay into the
apoptotic pathway (Supplementary Fig. S3.1), which explains why caspase-8 measurements did not
jump up immediately after combination treatment. However, the early up-and-down trajectory
was not sufficient to explain the later behaviour of caspase-8 (e.g. 10 h). Additional
factors may contribute to the regulation of caspase-8. It is also possible that our
measurements may be skewed by non-specific measurements, or by stochastic effects in the
population (Brennan et al.,
2012).
, and slower anti-cFLIP influences from
H2O2. Up-and-down behaviour of cFLIP can introduce delay into the
apoptotic pathway (Supplementary Fig. S3.1), which explains why caspase-8 measurements did not
jump up immediately after combination treatment. However, the early up-and-down trajectory
was not sufficient to explain the later behaviour of caspase-8 (e.g. 10 h). Additional
factors may contribute to the regulation of caspase-8. It is also possible that our
measurements may be skewed by non-specific measurements, or by stochastic effects in the
population (Brennan et al.,
2012).
Finally, we performed preliminary experiments to explore model-based hypotheses from
Figure 7, using anti-oxidant treatments (ROS
scavengers) that are specific to certain sub-types of ROS (Supplementary Fig. S4.8). If LY30 is causing cFLIP to go up at 30 min via
 , then removing
 via Tiron treatment would be expected to
halt the ability of LY30 to raise cFLIP at 30 min. Figure 8a shows that LY30 failed to increase cFLIP at 30 min when Tiron was
present. If LY30 is causing later levels of cFLIP to go down via
H2O2, then selectively removing H2O2 by
adding catalase would restore cFLIP levels to the same as untreated. Figure 8b shows that cFLIP at 6 h after treatment with both LY30
and catalase had the same relative intensity as in untreated cells. The system of
mechanisms in the Figure 7 model is plausible
and will be the subject of future LY30 studies.
via Tiron treatment would be expected to
halt the ability of LY30 to raise cFLIP at 30 min. Figure 8a shows that LY30 failed to increase cFLIP at 30 min when Tiron was
present. If LY30 is causing later levels of cFLIP to go down via
H2O2, then selectively removing H2O2 by
adding catalase would restore cFLIP levels to the same as untreated. Figure 8b shows that cFLIP at 6 h after treatment with both LY30
and catalase had the same relative intensity as in untreated cells. The system of
mechanisms in the Figure 7 model is plausible
and will be the subject of future LY30 studies.
Fig. 8.
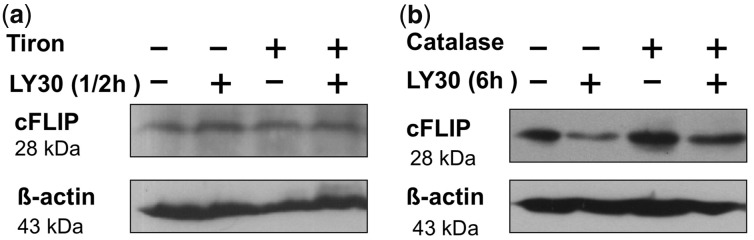
Western blots of cFLIP in Hela after LY30 treatment in the presence of ROS scavengers. (a) Western blot of cFLIP after 30 min LY30 treatment in the absence/presence of Tiron. Hela is pre-incubated with Tiron 1 h before adding LY30. (b) Western blot of cFLIP after 6 h LY30 treatment in the absence/presence of catalase
4 DISCUSSION AND CONCLUSION
An ODE model was constructed for combining the effects of two anti-cancer compounds, LY30 and TRAIL. The TRAIL effects were adapted from a previously published model (Albeck et al., 2008b), and the LY30 effects were approximated from our previously published experiments on LY30 (Poh and Pervaiz, 2005; Poh et al., 2007; Shenoy et al., 2009). Some effects of LY30 are common to multiple drugs, and our model was designed to be maximally generic for similar cases. For example, the standard chemotherapeutic drugs doxorubicin and cisplatin both cause ROS production and cFLIP down-regulation. Also, resveratrol, the widely studied compound in red wine, causes ROS production and cFLIP down-regulation (Ding et al., 2011; Ivanov et al., 2008; Juan et al., 2008). The ability of ROS to affect cFLIP is enormously important for determining whether cells are vulnerable to apoptosis (Geserick et al., 2008), because multiple TRAIL-resistant cancers have shown re-sensitization to TRAIL after cFLIP levels were lowered (Hietakangas et al., 2003; Kim et al., 2008; Lee et al., 2009; Nitobe et al., 2003).
Every protein signalling network has abundant uncertainty, because every drug can have undiscovered effects, and every time-series experiment can have undiscovered peaks or dips occurring between the observed time points. Most such effects are minor, but some are significant enough to disrupt our ability to reason about system behaviour. Any modelling research, in addition to its primary goal, can thus be considered to have an implicit surveillance function of checking the consistency of the ‘known’ facts. In building the initial model of LY30 effects, we interpolated from a few measured time points of cFLIP, to obtain a simple approximation of LY30-induced decay of cFLIP, using a constant degradation rate (Supplementary Material 1.4). When the LY30 and TRAIL effects were combined, our inability to simulate the observed dynamics of caspase-8 suggested an error in the model. Our initial model had performed simplistic interpolation to simulate how LY30 affects cFLIP. We performed subsequent experiments that showed a non-monotonic ‘up-and-down’ concentration of cFLIP after treatment with LY30. These effects do not contradict the previous findings, but rather refine the kinetics. The new observations of cFLIP explain the delayed activation of caspase-8 and the delayed onset of synergy in the execution of apoptosis, because significant concentrations of cFLIP inhibit the activation of caspase-8 (Krueger et al., 2001). Previous studies have used kinetic models of signalling pathways to detect mismatches between models and observations (Eissing et al., 2004; Smieja et al., 2008), but this work is among very few that have used pathway modelling to guide experiments towards actually confirming a previously unknown phenomenon (Hua et al., 2005).
The remaining question was how LY30 causes non-monotonic effects on cFLIP. One simple
explanation would be LY30 triggers two opposing pathways that regulate cFLIP in opposite
ways. We built a model of ‘typical’ ROS production and degradation (Fig. 7a), including the known ability of
H2O2 to cause gradual down-regulation of cFLIP (Nitobe et al., 2003), and a
hypothetical opposite effect of  on
cFLIP. In this model, the fundamental upstream–downstream relationship between
on
cFLIP. In this model, the fundamental upstream–downstream relationship between
 and H2O2, combined with
the fast effects of
and H2O2, combined with
the fast effects of  versus the slow-acting effects of H2O2, would together cause a time
difference between the
versus the slow-acting effects of H2O2, would together cause a time
difference between the  -dominant phase (early cFLIP increase) and the
H2O2-dominant phase (late cFLIP decline) of ROS-mediated effects. We
performed immunoblots for the plausibility of this model, by blocking ROS species and
testing whether LY30-induced changes in cFLIP were disrupted. Our model of cFLIP regulation
was not falsified by these tests, and future work can perform more comprehensive experiments
to characterize and validate the effects of LY30-induced
-dominant phase (early cFLIP increase) and the
H2O2-dominant phase (late cFLIP decline) of ROS-mediated effects. We
performed immunoblots for the plausibility of this model, by blocking ROS species and
testing whether LY30-induced changes in cFLIP were disrupted. Our model of cFLIP regulation
was not falsified by these tests, and future work can perform more comprehensive experiments
to characterize and validate the effects of LY30-induced  and
H2O2 on cFLIP.
and
H2O2 on cFLIP.
If LY30 is unique in causing complex cFLIP dynamics, it may be of narrow significance, but our model describes a general dynamic of ROS homeostasis. LY30 is one of many possible triggers for ROS, which might then cause two opposing effects on cFLIP. The predictions of this model may be applicable to other ROS-producing drugs, and to other redox-regulated protein levels. Future work can determine whether the same dynamics occur with doxorubicin, cisplatin and resveratrol. The timing of cell vulnerability to apoptosis (‘sensitization’) may also provide benefits for the design of optimal schedules for multi-drug treatments.
Supplementary Material
Acknowledgements
We are grateful to Josh Apgar, Jared Toettcher and Bo Kim for assistance with KroneckerBio modelling; to Nim Tri Hieu and Junjie Wang for technical advice on model building and optimization; and to Kothandharaman Subramaniam for biological discussions about ROS and cFLIP.
Funding: This work was supported by NUS ‘cross-faculty grant’ R-252-000-351-123 to L.T.-K. and S.P., by Singapore-MIT Alliance grants C-382-641-004-091 to J.W. and L.T.-K. and C-382-641-001-091 to S.P. and by BMRC grant R-185-000-113-305 and NMRC grant R-185-000-189-213 to S.P.
Conflict of Interest: none declared.
References
- Abdulghani J, El-Deiry WS. TRAIL receptor signaling and therapeutics. Expert Opin. Ther. Targets. 2010;14:1091–1108. doi: 10.1517/14728222.2010.519701. [DOI] [PubMed] [Google Scholar]
- Akram S, et al. Reactive oxygen species-mediated regulation of the Na+-H+ exchanger 1 gene expression connects intracellular redox status with cells' sensitivity to death triggers. Cell Death Differ. 2006;13:628–641. doi: 10.1038/sj.cdd.4401775. [DOI] [PubMed] [Google Scholar]
- Albeck JG, et al. Quantitative analysis of pathways controlling extrinsic apoptosis in single cells. Mol. cell. 2008a;30:11–25. doi: 10.1016/j.molcel.2008.02.012. [DOI] [PMC free article] [PubMed] [Google Scholar]
- Albeck JG, et al. Modeling a snap-action, variable-delay switch controlling extrinsic cell death. PLoS Biol. 2008b;6:2831–2852. doi: 10.1371/journal.pbio.0060299. [DOI] [PMC free article] [PubMed] [Google Scholar]
- Amm HM, et al. Combined modality therapy with TRAIL or agonistic death receptor antibodies. Cancer Biol. Ther. 2011;11:431–449. doi: 10.4161/cbt.11.5.14671. [DOI] [PMC free article] [PubMed] [Google Scholar]
- Bagci EZ, et al. Bistability in apoptosis: roles of bax, bcl-2, and mitochondrial permeability transition pores. Biophys. J. 2006;90:1546–1559. doi: 10.1529/biophysj.105.068122. [DOI] [PMC free article] [PubMed] [Google Scholar]
- Brennan MD, et al. Systems biology. How information theory handles cell signaling and uncertainty. Science. 2012;338:334–335. doi: 10.1126/science.1227946. [DOI] [PMC free article] [PubMed] [Google Scholar]
- Chait R, et al. Antibiotic interactions that select against resistance. Nature. 2007;446:668–671. doi: 10.1038/nature05685. [DOI] [PubMed] [Google Scholar]
- Clément MV, Pervaiz S. Intracellular superoxide and hydrogen peroxide concentrations: a critical balance that determines survival or death. Redox Rep. 2001;6:211–214. doi: 10.1179/135100001101536346. [DOI] [PubMed] [Google Scholar]
- Davies SP, et al. Specificity and mechanism of action of some commonly used protein kinase inhibitors. Biochem. J. 2000;351:95–105. doi: 10.1042/0264-6021:3510095. [DOI] [PMC free article] [PubMed] [Google Scholar]
- Ding L, et al. Cisplatin restores TRAIL apoptotic pathway in glioblastoma-derived stem cells through up-regulation of DR5 and down-regulation of c-FLIP. Cancer Invest. 2011;29:511–520. doi: 10.3109/07357907.2011.605412. [DOI] [PMC free article] [PubMed] [Google Scholar]
- Eissing T, et al. Bistability analyses of a caspase activation model for receptor-induced apoptosis. J. Biol. Chem. 2004;279:36892–36897. doi: 10.1074/jbc.M404893200. [DOI] [PubMed] [Google Scholar]
- Falschlehner C, et al. TRAIL signalling: decisions between life and death. Int. J. Biochem. Cell Biol. 2007;39:1462–1475. doi: 10.1016/j.biocel.2007.02.007. [DOI] [PubMed] [Google Scholar]
- Ferreira KS, et al. Caspase-3 feeds back on caspase-8, Bid and XIAP in type I Fas signaling in primary mouse hepatocytes. Apoptosis. 2012;17:503–515. doi: 10.1007/s10495-011-0691-0. [DOI] [PubMed] [Google Scholar]
- Fitzgerald JB, et al. Systems biology and combination therapy in the quest for clinical efficacy. Nat. Chem. Biol. 2006;2:458–466. doi: 10.1038/nchembio817. [DOI] [PubMed] [Google Scholar]
- Fukazawa T, et al. Accelerated degradation of cellular FLIP protein through the ubiquitin-proteasome pathway in p53-mediated apoptosis of human cancer cells. Oncogene. 2001;20:5225–5231. doi: 10.1038/sj.onc.1204673. [DOI] [PubMed] [Google Scholar]
- Geserick P, et al. Suppression of cFLIP is sufficient to sensitize human melanoma cells to TRAIL- and CD95L-mediated apoptosis. Oncogene. 2008;27:3211–3220. doi: 10.1038/sj.onc.1210985. [DOI] [PubMed] [Google Scholar]
- Gharbi SI, et al. Exploring the specificity of the PI3K family inhibitor LY294002. Biochem. J. 2007;404:15–21. doi: 10.1042/BJ20061489. [DOI] [PMC free article] [PubMed] [Google Scholar]
- Hampton MB, Orrenius S. Dual regulation of caspase activity by hydrogen peroxide: implications for apoptosis. FEBS Lett. 1997;414:552–556. doi: 10.1016/s0014-5793(97)01068-5. [DOI] [PubMed] [Google Scholar]
- Heikaus S, et al. Caspase-8 and its inhibitors in RCCs in vivo: the prominent role of ARC. Apoptosis. 2008;13:938–949. doi: 10.1007/s10495-008-0225-6. [DOI] [PubMed] [Google Scholar]
- Hietakangas V, et al. Erythroid differentiation sensitizes K562 leukemia cells to TRAIL-induced apoptosis by downregulation of c-FLIP. Mol. Cell Biol. 2003;23:1278–1291. doi: 10.1128/MCB.23.4.1278-1291.2003. [DOI] [PMC free article] [PubMed] [Google Scholar]
- Hoops S, et al. COPASI—a complex pathway simulator. Bioinformatics. 2006;22:3067–3074. doi: 10.1093/bioinformatics/btl485. [DOI] [PubMed] [Google Scholar]
- Hua F, et al. Effects of Bcl-2 levels on Fas signaling-induced caspase-3 activation: molecular genetic tests of computational model predictions. J. Immunol. 2005;175:985–995. doi: 10.4049/jimmunol.175.2.985. [DOI] [PubMed] [Google Scholar]
- Ivanov VN, et al. Resveratrol sensitizes melanomas to TRAIL through modulation of antiapoptotic gene expression. Exp. Cell Res. 2008;314:1163–1176. doi: 10.1016/j.yexcr.2007.12.012. [DOI] [PMC free article] [PubMed] [Google Scholar]
- Iyer AK, et al. Role of S-nitrosylation in apoptosis resistance and carcinogenesis. Nitric Oxide. 2008;19:146–151. doi: 10.1016/j.niox.2008.04.019. [DOI] [PMC free article] [PubMed] [Google Scholar]
- Jacobs MD, et al. Pim-1 ligand-bound structures reveal the mechanism of serine/threonine kinase inhibition by LY294002. J. Biol. Chem. 2005;280:13728–13734. doi: 10.1074/jbc.M413155200. [DOI] [PubMed] [Google Scholar]
- Jo DG, et al. Calcium binding of ARC mediates regulation of caspase 8 and cell death. Mol. Cell Biol. 2004;24:9763–9770. doi: 10.1128/MCB.24.22.9763-9770.2004. [DOI] [PMC free article] [PubMed] [Google Scholar]
- Juan ME, et al. Resveratrol induces apoptosis through ROS-dependent mitochondria pathway in HT-29 human colorectal carcinoma cells. J. Agric. Food Chem. 2008;56:4813–4818. doi: 10.1021/jf800175a. [DOI] [PubMed] [Google Scholar]
- Kim YH, et al. Rosiglitazone promotes tumor necrosis factor-related apoptosis-inducing ligand-induced apoptosis by reactive oxygen species-mediated up-regulation of death receptor 5 and down-regulation of c-FLIP. Free Radic. Biol. Med. 2008;44:1055–1068. doi: 10.1016/j.freeradbiomed.2007.12.001. [DOI] [PubMed] [Google Scholar]
- Koch G, et al. Modeling of tumor growth and anticancer effects of combination therapy. J. Pharmacokinet. Pharmacodyn. 2009;36:179–197. doi: 10.1007/s10928-009-9117-9. [DOI] [PubMed] [Google Scholar]
- Kreuz S, et al. NF-kappaB inducers upregulate cFLIP, a cycloheximide-sensitive inhibitor of death receptor signaling. Mol. Cell. Biol. 2001;21:3964–3973. doi: 10.1128/MCB.21.12.3964-3973.2001. [DOI] [PMC free article] [PubMed] [Google Scholar]
- Kristof AS, et al. LY303511 (2-piperazinyl-8-phenyl-4H-1-benzopyran-4-one) acts via phosphatidylinositol 3-kinase-independent pathways to inhibit cell proliferation via mammalian target of rapamycin (mTOR)- and non-mTOR-dependent mechanisms. J. Pharmacol. Exp. Ther. 2005;314:1134–1143. doi: 10.1124/jpet.105.083550. [DOI] [PubMed] [Google Scholar]
- Krueger A, et al. Cellular FLICE-inhibitory protein splice variants inhibit different steps of caspase-8 activation at the CD95 death-inducing signaling complex. J. Biol. Chem. 2001;276:20633–20640. doi: 10.1074/jbc.M101780200. [DOI] [PubMed] [Google Scholar]
- Lee JY, et al. The NO TRAIL to YES TRAIL in cancer therapy (review) Int. J. Oncol. 2007;31:685–691. [PubMed] [Google Scholar]
- Lee TJ, et al. Withaferin A sensitizes TRAIL-induced apoptosis through reactive oxygen species-mediated up-regulation of death receptor 5 and down-regulation of c-FLIP. Free Radic. Biol. Med. 2009;46:1639–1649. doi: 10.1016/j.freeradbiomed.2009.03.022. [DOI] [PubMed] [Google Scholar]
- Lim S, Clement MV. Phosphorylation of the survival kinase Akt by superoxide is dependent on an ascorbate-reversible oxidation of PTEN. Free Radic. Biol. Med. 2007;42:1178–1192. doi: 10.1016/j.freeradbiomed.2007.01.013. [DOI] [PubMed] [Google Scholar]
- Nitobe J, et al. Reactive oxygen species regulate FLICE inhibitory protein (FLIP) and susceptibility to Fas-mediated apoptosis in cardiac myocytes. Cardiovasc. Res. 2003;57:119–128. doi: 10.1016/s0008-6363(02)00646-6. [DOI] [PubMed] [Google Scholar]
- Pervaiz S, Clément MV. A permissive apoptotic environment: function of a decrease in intracellular superoxide anion and cytosolic acidification. Biochem. Biophys. Res. Commun. 2002;290:1145–1150. doi: 10.1006/bbrc.2001.6274. [DOI] [PubMed] [Google Scholar]
- Pervaiz S, Clement MV. Superoxide anion: oncogenic reactive oxygen species? Int. J. Biochem. Cell boil. 2007;39:1297–1304. doi: 10.1016/j.biocel.2007.04.007. [DOI] [PubMed] [Google Scholar]
- Peter ME. The flip side of FLIP. Biochem. J. 2004;382:e1–e3. doi: 10.1042/BJ20041143. [DOI] [PMC free article] [PubMed] [Google Scholar]
- Poh TW, Pervaiz S. LY294002 and LY303511 sensitize tumor cells to drug-induced apoptosis via intracellular hydrogen peroxide production independent of the phosphoinositide 3-kinase-Akt pathway. Cancer Res. 2005;65:6264–6274. doi: 10.1158/0008-5472.CAN-05-0152. [DOI] [PubMed] [Google Scholar]
- Poh TW, et al. LY303511 amplifies TRAIL-induced apoptosis in tumor cells by enhancing DR5 oligomerization, DISC assembly, and mitochondrial permeabilization. Cell Death Differ. 2007;14:1813–1825. doi: 10.1038/sj.cdd.4402177. [DOI] [PubMed] [Google Scholar]
- Polking JC. MATLAB Manual for Ordinary Differential Equations. Englewood Clis, NJ: Prentice-Hall; 1995. [Google Scholar]
- Ruffels J, et al. Activation of ERK1/2, JNK and PKB by hydrogen peroxide in human SH–SY5Y neuroblastoma cells: role of ERK1/2 in H2O2induced cell death. Eur. J. Pharmacol. 2004;483:163–173. doi: 10.1016/j.ejphar.2003.10.032. [DOI] [PubMed] [Google Scholar]
- Shenoy K, et al. LY303511 enhances TRAIL sensitivity of SHEP-1 neuroblastoma cells via hydrogen peroxide-mediated mitogen-activated protein kinase activation and up-regulation of death receptors. Cancer Res. 2009;69:1941–1950. doi: 10.1158/0008-5472.CAN-08-1996. [DOI] [PubMed] [Google Scholar]
- Smieja J, et al. Model-based analysis of interferon-beta induced signaling pathway. Bioinformatics. 2008;24:2363–2369. doi: 10.1093/bioinformatics/btn400. [DOI] [PMC free article] [PubMed] [Google Scholar]
- Tang H, et al. The scavenging of superoxide radicals promotes apoptosis induced by a novel cell-permeable fusion protein, sTRAIL:FeSOD, in tumor necrosis factor-related apoptosis-inducing ligand-resistant leukemia cells. BMC Biol. 2011;9:18. doi: 10.1186/1741-7007-9-18. [DOI] [PMC free article] [PubMed] [Google Scholar]
- Toettcher J, et al. Recycling circuit simulation techniques for mass-action biochemical kinetics. In: Peng L, editor. Simulation and Verification of Electronic and Biological Systems. Heidelberg, Germany: Springer; 2010. [Google Scholar]
- Wang S. The promise of cancer therapeutics targeting the TNF-related apoptosis-inducing ligand and TRAIL receptor pathway. Oncogene. 2008;27:6207–6215. doi: 10.1038/onc.2008.298. [DOI] [PubMed] [Google Scholar]
- Yamakawa H, et al. Activation of caspase-9 and -3 during H2O2-induced apoptosis of PC12 cells independent of ceramide formation. Neurol. Res. 2000;22:556–564. doi: 10.1080/01616412.2000.11740718. [DOI] [PubMed] [Google Scholar]
- Yang S, et al. Caspase-3 mediated feedback activation of apical caspases in doxorubicin and TNF-alpha induced apoptosis. Apoptosis. 2006;11:1987–1997. doi: 10.1007/s10495-006-0084-y. [DOI] [PubMed] [Google Scholar]
- Zhang L, Fang B. Mechanisms of resistance to TRAIL-induced apoptosis in cancer. Cancer Gene Ther. 2005;12:228–237. doi: 10.1038/sj.cgt.7700792. [DOI] [PubMed] [Google Scholar]
- Zhu P, et al. Angiopoietin-like 4 protein elevates the prosurvival intracellular O2(-):H2O2 ratio and confers anoikis resistance to tumors. Cancer Cell. 2011;19:401–415. doi: 10.1016/j.ccr.2011.01.018. [DOI] [PubMed] [Google Scholar]
- Zou H, et al. Regulation of the Apaf-1/caspase-9 apoptosome by caspase-3 and XIAP. J. Biol. Chem. 2003;278:8091–8098. doi: 10.1074/jbc.M204783200. [DOI] [PubMed] [Google Scholar]
- Zuo Y, et al. Oxidative modification of caspase-9 facilitates its activation via disulfide-mediated interaction with Apaf-1. Cell Res. 2009;19:449–457. doi: 10.1038/cr.2009.19. [DOI] [PubMed] [Google Scholar]
Associated Data
This section collects any data citations, data availability statements, or supplementary materials included in this article.