

Abstract
The cyanobacterium Synechococcus elongatus PCC 7942 exhibits global biphasic circadian oscillations in gene expression under constant-light conditions. Class I genes are maximally expressed in the subjective dusk, whereas class II genes are maximally expressed in the subjective dawn. Here, we identify sequence features that encode the phase of circadian gene expression. We find that, for multiple genes, an ∼70-nucleotide promoter fragment is sufficient to specify class I or II phase. We demonstrate that the gene expression phase can be changed by random mutagenesis and that a single-nucleotide substitution is sufficient to change the phase. Our study provides insight into how the gene expression phase is encoded in the cyanobacterial genome.
INTRODUCTION
The cyanobacterium Synechococcus elongatus PCC 7942 (here called simply S. elongatus) exhibits circadian oscillations in gene expression under continuous-light conditions (1–3). Microarray analysis has shown that the expression of at least 30 to 65% of genes oscillates with ∼24-h periodicity (2, 3), with two primary phases of gene expression: genes peaking in the subjective dusk (class I) or subjective dawn (class II). The presence of a circadian clock provides cyanobacteria with a competitive advantage when grown in light/dark cycles (4), and some of this advantage is likely to be a product of clock-controlled dynamics in gene expression. For example, 89% of circadian genes involved in photosynthesis peak in the subjective dawn, which may allow photosynthesis-related proteins to be available during the day (3).
The core circadian clock in S. elongatus is comprised of three proteins: KaiA, KaiB, and KaiC (5). KaiC phosphorylation and ATPase activity oscillate with circadian periodicity and are thought to be the two primary state variables of the clock (5). A two-component output pathway consisting of a histidine kinase and a DNA binding response regulator relays timing from the core clock to control gene expression (5). Deletion of the DNA binding response regulator of this output pathway abrogates essentially all circadian gene expression (6). KaiC-dependent circadian oscillations in chromosome supercoiling and compaction have also been shown to play a role in generating global oscillations in gene expression (3, 7, 8), but the relationship between circadian oscillations in chromosome topology and the two-component output pathway is not understood. Class I and class II promoters respond in opposite ways to changes in chromosome supercoiling, and this differential sensitivity may determine the global circadian gene expression profile (3).
What, then, are the underlying sequence determinants that dictate whether a particular gene oscillates with the class I or II phase? Previous studies of the class II purF (synpcc7942_0004) promoter identified an 89-nucleotide fragment that specifies class II phasing (9), and analysis of the class I kaiBC (synpcc7942_1217 and synpcc7942_1216) promoter identified a 56-nucleotide fragment that specifies class I phasing (10). However, neither study was able to identify the sequence within the fragments that specified phase information, nor were they able to identify mutations that switched the phase. Here, we investigate the sequence features responsible for circadian phase determination. These features may provide insight into the mechanism of circadian gene expression and may aid in understanding cyanobacterial promoter design.
MATERIALS AND METHODS
Cell culture.
S. elongatus cells were grown in modified BG-11 medium (BG-11 M) (11) containing antibiotics at 30°C with cool white fluorescent illumination of ∼60 μE s m−2 (Phillips). Antibiotic concentrations were 2.5 μg ml−1 (each) spectinomycin/streptomycin (Sp/Sm) and 5 μg ml−1 chloramphenicol (Cm). Transformations were performed with a few modifications to standard protocols (11). To reduce the number of false-positive colonies, transformants were plated onto a sterile nitrocellulose membrane placed on top of a BG-11 M agar plate and kept in low light (∼20 μE s m−2) for 2 days prior to transfer to normal light conditions. On the third and fifth days, the nitrocellulose membrane was moved to a new BG-11 M agar plate with antibiotics to ensure continuous selection. After 10 days, individual colonies were isolated and patched.
Bioluminescence measurements and data analysis.
The patched colonies were directly transferred to a transparent 96-well plate with 200 μl of liquid BG-11 M containing antibiotics. Multiple independent colonies were selected and assayed multiple times. The cells were grown in a clear 96-well plate at ∼60-μE s m−2 illumination for at least 2 days. The cells were diluted to an optical density at 750 nm (OD750) of ∼0.5 and transferred to a black, opaque 96-well plate covered with punctured TopSeal (PerkinElmer) to allow air exchange. The cells were grown under ∼60-μE s m−2 illumination for 1 day prior to two consecutive entrainments with 12 h dark-12 h light. The cells were then released into continuous light (∼60-μE s m−2 illumination), and bioluminescence measurements were made every 2 h on a TopCount (PerkinElmer). Prior to each individual bioluminescence measurement, the cells were maintained in the dark for 3 min. Five consecutive bioluminescence measurements were made for each well (each integrating incident photons over a 1-s interval) and subsequently averaged. Independent clones were assayed multiple times for each promoter fragment (see Fig. 2 or 4 for a representative trace). The phase was extracted from the first Fourier component of linearly detrended data. A period of 24 h was assumed when calculating the Fourier component. Each promoter fragment was assigned a class based on whether the calculated phase was closer to a class I control than to a class II control from the same experiment. All calculations were verified by visual inspection. The reported means and standard deviations of the phase were calculated from independent clones from the same set of experiments: at least 2 independent clones for the time course (see Fig. 2), at least 4 for mutants (see Fig. 4), and 3 for controls (P1 and P3) (see Fig. 4).
Fig 2.

A short promoter fragment is sufficient to encode the circadian gene expression phase. (A) Four promoter fragments, P1 through P4, were fused to a promoterless luxAB cassette in S. elongatus strain AMC 395. P2 and P3 are class I genes (synpcc7942_0488 and synpcc7942_2046); P1 and P4 are class II genes (synpcc7942_0004 and synpcc7942_0466). The promoter fragment from a control class II strain (AMC 408 [9, 19]) is shown as a reference. The control strain uses the full-length version (∼900 nucleotides) of the P1 fragment. (B) Bioluminescence data collected every 2 h indicates that each fragment is sufficient to reconstitute the phase of the endogenous gene. The bioluminescence values from a control class II strain (AMC 408) and a promoterless strain are shown as positive and negative controls, respectively. P4 and AMC 408 bioluminescence values were scaled by 1/10, as indicated. The mean and standard deviation of the phase were calculated from at least 2 independent clones.
Fig 4.

Single-nucleotide substitutions can change the circadian gene expression phase. (A) A particular clone (M1-1) from random mutagenesis of P1 was analyzed to determine the causal mutations. (Top) Mutations in M1-1 were subcloned in the P1 background (M1-2 through M1-8). All mutations are shown in red, boldface, and underlined. All clones with the T-to-C substitution at either −2 or −5 change phase from class II to class I. The +1 position was determined from RNA-sequencing data (12). Means and standard deviations of the phase were calculated from at least 4 independent clones for all mutants and from 3 independent clones for the P1 and P3 controls. (Bottom) Bioluminescence time course for promoter fragments shown above. M1-2, M1-3, and M1-4 bioluminescence values were scaled as indicated. (B) A particular clone (M2-1) from random mutagenesis of P1 was analyzed to determine the causal mutations. (Top) Mutations in M2-1 were subcloned in the P1 background (M2-2, M2-4, M2-6, M2-7, M2-8, and M2-9). All mutations are shown in red, boldface, and underlined. All clones with the T-to-G substitution at either −12 or −13 change phase from class II to class I. The +1 position, mean phase, and standard deviation of the phase were determined as for panel A. (Bottom) Bioluminescence time course for promoter fragments shown above. M2-6 bioluminescence was scaled as indicated.
Raw bioluminescence data are shown everywhere (for exceptions, see Fig. 3 and Fig. S2 in the supplemental material, for which bioluminescence data were linearly detrended and normalized so that minimum and maximum bioluminescence values were 0 and 1, respectively). The phase was calculated as described above. All mutant promoter fragments (see Fig. 3 and Fig. S2 in the supplemental material) are ordered from a phase of 0° (top) to 360° (bottom). Mutants marked as phase changing were determined by visual inspection. All library mutants with bioluminescence values above the background were measured in duplicate and showed qualitatively similar time courses in the replicates. To verify the libraries, two and four phase-changing clones from the P1 and P2 libraries, respectively, were constructed from scratch, and the phase change was confirmed. All raw bioluminescence data and calculated phases for mutant libraries P1 and P2 are provided in Data Set S1 in the supplemental material.
Fig 3.

Random mutagenesis of promoter fragments can alter the phase of gene expression from class I to class II, and vice versa. (A) Random mutagenesis of the promoter fragment P1 from the class II gene synpcc7942_0004 (purF) yields class I mutants. (Top) Bioluminescence from two biological replicates of P1 and P3 are shown as class II and class I controls, respectively. (Bottom) Bioluminescence from mutant clones with gene expression ordered by phase. Mutants with a phase change are marked with double lines on the y axis. All bioluminescence traces have been linearly detrended and normalized so that the minimum and maximum bioluminescence values are 0 and 1 units, respectively. All bioluminescence time courses shown were measured in duplicate, and the replicates were qualitatively similar. The raw data and calculated phase are provided in Data Set S1 in the supplemental material. (B) Random mutagenesis of the promoter fragment P2 from the class I gene synpcc7942_0488 yields class II mutants. (Top) Bioluminescence values from two biological replicates of P1 and P2 are shown as class II and class I controls, respectively. (Bottom) Same as in panel A.
All data processing, analysis, and visualization were done with custom scripts in MATLAB (MathWorks).
Cloning and library preparation.
Promoter fragments were synthesized as oligonucleotides (Eurofins MWG Operon) with 5′-GCTCTAGA-3′ appended to the 5′ end and 5′-AGGCCTTC-3′ appended to the 3′ end. The sequences of the promoter fragments without the appended sequences were as follows: P1, 5′-TCGAACGTCGTTTGGCTAAAGACTAACCGCTAGGGTTAAGTCATTGTTAAATTTGCATTAGCCGCTACA-3′; P2, 5′-TTCCCCGCCTCGCTGACTGAATCTCATTGCCAATCGCTTGCTGCCTCGCCTAGGCTCGGCATAGCACGTGGAAAGG-3′; P3, 5′-TCTCGGCTGGCCCCCCTGTTGTTCCGGACGGGCAGCGGGCAAACTGAAAGCGTCCTCTCTACTTTGTTGCGATGGCGCTGATCT-3′; and P4, 5′-AGCATCACATGGGGCGGATGATAACGGCCCCGTCACGTTAATGTGGGCACATTAACGCCGAAAGATTAAGAGAAAATGACAAGG-3′. The oligonucleotides were annealed to a primer (5′-GAAGGCCT-3′), extended with Klenow (exonuclease) (NEB) to generate double-stranded DNA, and subsequently cloned into the XbaI and StuI restriction sites of pAM1580 (9, 11). All the plasmids constructed in this study are shown in Table S1 in the supplemental material. The S. elongatus strain AMC 395 (9), expressing luxCDE, was transformed with pAM1580 containing the promoter fragment. Mutagenesis libraries were prepared using mutagenized oligonucleotides (Integrated DNA Technologies) with the previously described flanking sequences. The mutagenized oligonucleotides were synthesized at a 15% substitution rate (a 5% chance that each of three nonendogenous nucleotides replaces the endogenous nucleotide at each position) in the promoter region. The mutagenized oligonucleotides were primer extended and cloned into pAM1580 as previously described. Over 1,000 Escherichia coli colonies were combined, and plasmids were extracted to generate a plasmid library with sufficient sequence diversity. The S. elongatus strain AMC 395 was transformed with the plasmid library. The promoter fragment in each resultant S. elongatus colony with bioluminescence above the background was subjected to colony PCR (primers 5′-GACGGATGGCCTTTTTGCGTTTC-3′ and 5′-TGGTGAGTTGTTCAAAATCA-3′) and sequenced (sequencing primer, 5′-GACGGATGGCCTTTTTGCGTTTC-3′).
qPCR.
RNA was extracted every 4 h from 800-ml cultures grown in BG-11 M supplemented with 10 mM HEPES-KOH, pH 8.0, and no antibiotics. Cultures were entrained with two consecutive 12-h dark–12-h light periods prior to release into continuous light and manually maintained at an OD750 of ∼0.3 during sampling. The cultures were bubbled at ∼100 ml min−1 with ∼1% CO2 in air and grown at 30°C under ∼100 μE s m−2 cool white fluorescent lights. Cells (60 ml) were collected every 4 h by vacuum filtration onto nitrocellulose membranes and subsequently frozen in liquid nitrogen. RNA was extracted and reverse transcribed into cDNA as previously described (3). Quantitative PCR (qPCR) was performed using SYBR green qPCR master mix (Invitrogen) on an MX3000p (Stratagene) qPCR machine. The hslO (synpcc7942_0559) transcript was used for loading normalization of time points, since its expression is relatively constant over circadian time both by microarray and by RNA polymerase chromatin immunoprecipitation (ChIP) (3, 12). Standards for each individual primer pair were created by qPCR of a dilution series of cDNA from an arbitrary time point. As a result, only the relative levels of expression of a single primer pair across a time course can be compared, and not the relative level of one primer pair versus another. The following primer pairs were used for qPCR analysis: luxAB primers (5′-GTATGAGTCGTACCAATGGC-3′ and 5′-GCTACGATGTGACTAAGATT-3′), hslO primers (5′-CAGACCAACTGATTCGAGCG-3′ and 5′-GGAGGCCAGGAGCAGTC-3′), kaiBC primers (5′-TACATTCTCAAGCTCTACG-3′ and 5′-CGTCGCTAGGATTTTATCC-3′), and purF primers (5′-CTAAGAACCACGAGCTGAC-3′ and 5′-CGATCGTCAGGCTAAAGG-3′).
RESULTS AND DISCUSSION
Identification of a promoter region sufficient to encode the circadian gene expression phase.
A previous study analyzing the relationship between sequence and phase in S. elongatus identified a long-range (∼3-kb), statistically significant enrichment in AT content (∼1%) in both the promoters and open reading frames of genes activated when the chromosome is relaxed versus those that are repressed (3). These AT content differences were similar in magnitude and location to those found in genes activated and repressed after induction of chromosomal relaxation in E. coli (13). The concordance in sequence signature, combined with the observation of circadian changes in chromosome supercoiling (7, 8), suggested a role for supercoiling in circadian gene expression in S. elongatus (3).
Although a long-range (∼3-kb) enrichment in AT content exists between genes activated when the chromosome is relaxed and those that are repressed (3), circadian transcripts (median length, 1,320 nucleotides [12]) of a given phase are randomly distributed along the densely transcribed genome (2, 3). This suggests that the relevant sequence information encoding the phase is not long range but more proximal to each transcript. Recent RNA sequencing and transcription start site identification in S. elongatus (12) allows analysis based on transcription start sites as opposed to translation start sites, which were used in both of the previous bioinformatics studies (3, 13). This added resolution enables a more detailed analysis of sequence content. In the region between −20 and −100 relative to the transcription start site, we find an enrichment of AT content in transcripts that are activated when the chromosome is relaxed (subjective dawn) (Fig. 1A). To identify the location of the most statistically significant enrichment in AT content, we computed a P value across the promoter and the transcript and found a particularly significant value—corresponding to a 1-in-14-nucleotide GC-to-AT substitution—for the sequence between −20 and −30, often called the “spacer” (Fig. 1B). This spacer region is directly between the −10 and −35 elements at which the RNA polymerase complex makes its initial contacts (14, 15).
Fig 1.
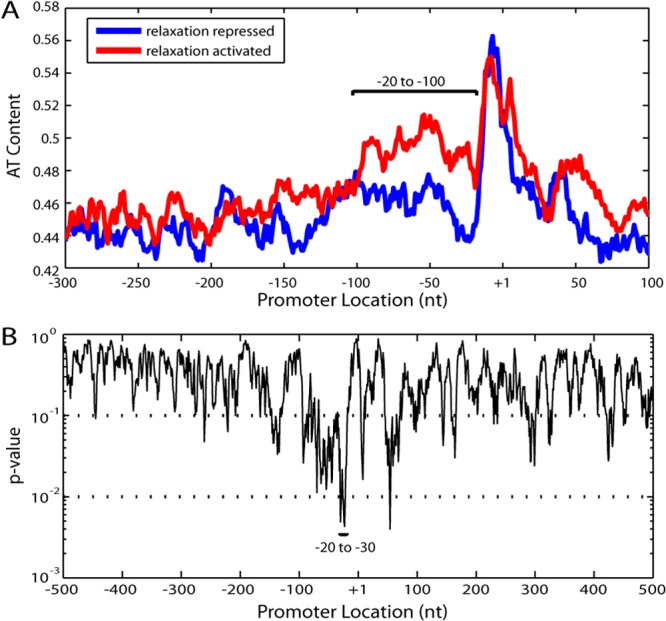
A local difference in AT content is observed between transcripts activated or repressed when the chromosome is relaxed. (A) Comparison of the AT contents of transcripts activated or repressed when the chromosome is relaxed. The transcripts were aligned by transcription start location (+1) (12), and their AT contents were averaged. An 11-nucleotide (nt) smoothing window was applied to the average AT content. A large difference in AT content exists between −20 and −100. The relaxation-repressed transcripts were defined as those with greater than 0.5 correlation with chromosomal supercoiling (n = 211 of 1,473 total transcripts) and the relaxation activated transcripts as those with less than −0.5 correlation (n = 244) (3). (B) P values for AT content difference calculated in 11-nucleotide bins. For every 11-nucleotide bin, the probability of having as extreme an AT enrichment as the relaxation-activated set was calculated by 10,000 simulations with randomized sets of relaxation-activated and relaxation-repressed transcripts. The majority of the bins between −20 and −100 nucleotides are significant (P < 0.1), with the most significant bins in the spacer region (−20 to −30).
Identification of a local difference in AT content in the spacer suggested that a single fragment containing the −10, spacer, and −35 elements may be capable of both transcription and encoding the circadian phase. To determine if this is the case, we asked if an ∼70-nucleotide fragment encompassing these elements from four different circadian transcripts (Fig. 2A), two class I and two class II, could drive expression with the same phase as the endogenous transcript. The transcription start site and circadian phase for each of these transcripts were obtained from RNA sequencing (12) and microarray experiments (3), respectively. These fragments (P1 through P4) were fused to a promoterless luxAB (luciferase) bioluminescence reporter and subsequently inserted into a defined chromosomal locus, NS 2.1 (11), in the strain AMC 395 (9) (see Materials and Methods). AMC 395 expresses the luxCDE genes, which encode enzymes for synthesis of the luciferase substrate, using the highly expressed class I psbAI promoter (11, 16–18). We assume that the luciferase substrate is in excess at all time points (11). The promoterless luxAB alone does not lead to any detectable bioluminescence, but when fused to a promoter fragment, it can recapitulate the phase of the endogenous transcript (Fig. 2B). To verify that the bioluminescence reporter accurately reports the phase, we confirmed that the phase of mRNA accumulation is also preserved by measuring the abundance of the luxAB transcript in strains with the P1 fragment by qPCR (see Fig. S1A in the supplemental material). Our results indicate that the information required to encode the phase is at least partially contained in a short fragment surrounding the spacer region of the promoter. Although the tested promoter fragments are able to reproduce the phase of circadian gene expression, they do not always preserve the overall level of bioluminescence. Cells with a much larger, ∼900-nucleotide version of the P1 fragment (AMC 408 [9, 19]) have much higher overall expression levels than the P1 fragment, even though the phase and amplitude (peak-to-trough ratio) are identical (Fig. 2B).
Random mutagenesis of promoter fragments can change the phase of gene expression.
Since we found that the information encoding the phase is contained in an ∼70-nucleotide fragment, we asked if mutagenesis of this fragment could alter the phase of gene expression. Promoter fragments P1 (class II), P2 (class I), and P3 (class I) were synthesized with a 15% per base substitution rate (a 5% chance that each of three nonendogenous nucleotides replaces the endogenous nucleotide at each position), fused to the promoterless luxAB cassette, and integrated into the NS 2.1 chromosomal locus of AMC 395 (see Materials and Methods). A 15% substitution rate was chosen so that at least one substitution could be expected in the spacer region of the promoter. Approximately 200 individual colonies from each library (P1, P2, and P3), each with a unique mutagenized promoter fragment, were assayed for bioluminescence.
Nearly half of the colonies in each library had bioluminescence above the background, and all of these colonies also exhibited circadian gene expression oscillations (Fig. 3; see Fig. S2 in the supplemental material). The observation that mutagenesis of these three promoters resulted in no active promoter without circadian oscillations suggests that the transcription of all transcribed genes oscillates with a 24-h period, in agreement with a previous bioluminescence promoter trap experiment (1). Previous microarray measurements reporting that the expression of 30 to 65% of the genes oscillates may not have had the resolution to detect all oscillations in mRNA abundance (2, 3), or there may be an additional translational aspect to the circadian rhythms.
Over 20% of colonies with bioluminescence above the background from P1, P2, and P3 exhibited a change in the gene expression phase after mutagenesis (Fig. 3; see Fig. S2 in the supplemental material). In addition to the phase of expression, several other characteristics, including shape, amplitude, and expression level, were affected. To determine which mutations may cause the change in phase, the promoter fragment of each clone from the P1 and P2 libraries with bioluminescence above the background was sequenced (see Data Set S1 in the supplemental material). Mutations in clones with altered phases were very diverse in sequence and location. Since on average, nearly 1 in every 7 nucleotides is substituted, and a large fraction of colonies changed phase, we expect the majority of the substitutions in phase-changing clones to be noncausal.
Single-nucleotide substitutions are sufficient to change the phase of gene expression.
Since each promoter fragment contained many substitutions, further subcloning was used to identify which mutations caused the change in phase. Substitutions from two mutagenized promoters with class I phase, M1-1 and M2-1, both from the parent class II P1 library, were subcloned to identify the causal substitutions (Fig. 4). M1-1 has substitutions in 11 of 69 nucleotides and M2-1 in 9 of 69 nucleotides. For M1-1, all strains that retained substitutions at either −2 or −5, or both locations, maintained the phase change to class I (M1-6, M1-7, and M1-8 in Fig. 4A). The T-to-C substitution at either −2 or −5 is sufficient to change the phase of the P1 parent promoter from class II to class I. A strain that does not contain either substitution does not change the phase of the P1 parent promoter (M1-5 in Fig. 4A). A similar result was observed for M2-1. All strains that retained substitutions at either −12 or −13, or both locations, maintained the phase change to class I (M2-4, M2-8, and M2-9 in Fig. 4B). The T-to-G substitution at either −12 or −13 is sufficient to change the phase of the P1 parent promoter. Three other substitutions downstream of −12 were also sufficient to change the phase of P1 to class II, but the strain exhibited very weak rhythmicity (M2-7 in Fig. 4B). Quantification of mRNA by qPCR shows altered temporal dynamics of mRNA abundance in all four strains with single-nucleotide substitutions (see Fig. S1 in the supplemental material).
Although a small sample, all four of the causal substitutions in M1-1 and M2-1 increased the GC content, consistent with our genome-wide observations (Fig. 1A). The class II P1 promoter is highly expressed when the chromosome is relaxed (3), and substitutions increasing the GC content may switch the promoter to be repressed, resulting in a change in phase. Although only two of the four identified single-nucleotide substitutions fall near or within the spacer between the −10 and −35 elements, all substitutions are located proximal to where the RNA polymerase holoenzyme makes initial contact.
Concluding remarks.
Here, we have shown that short promoter fragments centered around the spacer region, the region between the −10 and −35 elements, are sufficient to encode the circadian phase for multiple circadian genes. Furthermore, we show, using random mutagenesis of these fragments, that single-nucleotide substitutions are sufficient to change the circadian gene expression phase.
Previous studies suggested a role for chromosome supercoiling in controlling circadian gene expression in cyanobacteria (3, 7, 8). However, very little is known about the general relationship between the sequence and the supercoiling sensitivity of promoters in any organism. A genome-wide study in E. coli observed a long-range (several-kilobase) AT content enrichment in genes repressed by chromosomal relaxation compared to those activated by this perturbation (13). Here, we identify a local difference in AT content in the spacer of the promoter, using transcription start site information, and find that an ∼70-nucleotide promoter fragment encompassing this region is sufficient to encode the circadian gene expression phase. This promoter fragment has the potential to affect the binding, open-complex formation, or even promoter clearance of the RNA polymerase complex. Several studies on individual promoters in other organisms have found that the region between −35 and +1 is critical for a promoter's sensitivity to changes in supercoiling (20–23), but no consensus mechanism has been identified. Our analysis of the relationship between the sequence and phase in S. elongatus provides an entry point for studying the mechanism and sequence dependence of supercoiling-mediated gene expression changes.
Our findings suggest that the phase of circadian gene expression is not firmly encoded in the S. elongatus genome. Strikingly, even a single-nucleotide substitution can dramatically alter the phase of gene expression. Although this lack of sequence structure makes it difficult to design a class I or class II promoter de novo, it may play a role in the fine-tuning of circadian gene expression during the course of evolution. Even though cyanobacteria did not evolve under continuous-light conditions, the phase under continuous light is indicative of a gene's expression dynamics in the first 12 h of light under the more natural light/dark conditions (Fig. 2B, first 12 h). Random mutations in the promoter region have the potential to switch the phase of a gene, and if this phase change is beneficial, it may be fixed in the population. Since the mutations required to change the phase of a gene are minimal, each gene may be able to sample a different phase in a relatively short time. This may explain why almost all of the circadian genes involved in the photosynthesis pathway are more highly expressed in the dawn (3). This strategy of nonstringent sequence encoding may be applicable to other genome-wide responses where fine-tuning may be beneficial.
Supplementary Material
ACKNOWLEDGMENTS
This work was funded by the Howard Hughes Medical Institute, National Defense Science and Engineering (V.V.), and National Science Foundation Graduate Research Fellowships (V.V.).
We thank members of the O'Shea laboratory for comments and discussion.
Footnotes
Published ahead of print 30 November 2012
Supplemental material for this article may be found at http://dx.doi.org/10.1128/JB.02012-12.
REFERENCES
- 1. Liu Y, Tsinoremas NF, Johnson CH, Lebedeva NV, Golden SS, Ishiura M, Kondo T. 1995. Circadian orchestration of gene expression in cyanobacteria. Genes Dev. 9:1469–1478 [DOI] [PubMed] [Google Scholar]
- 2. Ito H, Mutsuda M, Murayama Y, Tomita J, Hosokawa N, Terauchi K, Sugita C, Sugita M, Kondo T, Iwasaki H. 2009. Cyanobacterial daily life with Kai-based circadian and diurnal genome-wide transcriptional control in Synechococcus elongatus. Proc. Natl. Acad. Sci. U. S. A. 106:14168–14173 [DOI] [PMC free article] [PubMed] [Google Scholar]
- 3. Vijayan V, Zuzow R, O'Shea EK. 2009. Oscillations in supercoiling drive circadian gene expression in cyanobacteria. Proc. Natl. Acad. Sci. U. S. A. 106:22564–22568 [DOI] [PMC free article] [PubMed] [Google Scholar]
- 4. Woelfle MA, Ouyang Y, Phanvijhitsiri K, Johnson CH. 2004. The adaptive value of circadian clocks: an experimental assessment in cyanobacteria. Curr. Biol. 14:1481–1486 [DOI] [PubMed] [Google Scholar]
- 5. Dong G, Kim YI, Golden SS. 2010. Simplicity and complexity in the cyanobacterial circadian clock mechanism. Curr. Opin. Genet. Dev. 20:619–625 [DOI] [PMC free article] [PubMed] [Google Scholar]
- 6. Takai N, Nakajima M, Oyama T, Kito R, Sugita C, Sugita M, Kondo T, Iwasaki H. 2006. A KaiC-associating SasA-RpaA two-component regulatory system as a major circadian timing mediator in cyanobacteria. Proc. Natl. Acad. Sci. U. S. A. 103:12109–12114 [DOI] [PMC free article] [PubMed] [Google Scholar]
- 7. Woelfle MA, Xu Y, Qin X, Johnson CH. 2007. Circadian rhythms of superhelical status of DNA in cyanobacteria. Proc. Natl. Acad. Sci. U. S. A. 104:18819–18824 [DOI] [PMC free article] [PubMed] [Google Scholar]
- 8. Smith RM, Williams SB. 2006. Circadian rhythms in gene transcription imparted by chromosome compaction in the cyanobacterium Synechococcus elongatus. Proc. Natl. Acad. Sci. U. S. A. 103:8564–8569 [DOI] [PMC free article] [PubMed] [Google Scholar]
- 9. Min H, Liu Y, Johnson CH, Golden SS. 2004. Phase determination of circadian gene expression in Synechococcus elongatus PCC 7942. J. Biol. Rhythms 19:103–112 [DOI] [PubMed] [Google Scholar]
- 10. Kutsuna S, Nakahira Y, Katayama M, Ishiura M, Kondo T. 2005. Transcriptional regulation of the circadian clock operon kaiBC by upstream regions in cyanobacteria. Mol. Microbiol. 57:1474–1484 [DOI] [PubMed] [Google Scholar]
- 11. Mackey SR, Ditty JL, Clerico EM, Golden SS. 2007. Detection of rhythmic bioluminescence from luciferase reporters in cyanobacteria. Methods Mol. Biol. 362:115–129 [DOI] [PubMed] [Google Scholar]
- 12. Vijayan V, Jain IH, O'Shea EK. 2011. A high resolution map of a cyanobacterial transcriptome. Genome Biol. 12:R47. [DOI] [PMC free article] [PubMed] [Google Scholar]
- 13. Peter BJ, Arsuaga J, Breier AM, Khodursky AB, Brown PO, Cozzarelli NR. 2004. Genomic transcriptional response to loss of chromosomal supercoiling in Escherichia coli. Genome Biol. 5:R87. [DOI] [PMC free article] [PubMed] [Google Scholar]
- 14. Schaller H, Gray C, Herrmann K. 1975. Nucleotide sequence of an RNA polymerase binding site from the DNA of bacteriophage fd. Proc. Natl. Acad. Sci. U. S. A. 72:737–741 [DOI] [PMC free article] [PubMed] [Google Scholar]
- 15. Pribnow D. 1975. Nucleotide sequence of an RNA polymerase binding site at an early T7 promoter. Proc. Natl. Acad. Sci. U. S. A. 72:784–788 [DOI] [PMC free article] [PubMed] [Google Scholar]
- 16. Kondo T, Strayer CA, Kulkarni RD, Taylor W, Ishiura M, Golden SS, Johnson CH. 1993. Circadian rhythms in prokaryotes: luciferase as a reporter of circadian gene expression in cyanobacteria. Proc. Natl. Acad. Sci. U. S. A. 90:5672–5676 [DOI] [PMC free article] [PubMed] [Google Scholar]
- 17. Liu Y, Golden SS, Kondo T, Ishiura M, Johnson CH. 1995. Bacterial luciferase as a reporter of circadian gene expression in cyanobacteria. J. Bacteriol. 177:2080–2086 [DOI] [PMC free article] [PubMed] [Google Scholar]
- 18. Nair U, Thomas C, Golden SS. 2001. Functional elements of the strong psbAI promoter of Synechococcus elongatus PCC 7942. J. Bacteriol. 183:1740–1747 [DOI] [PMC free article] [PubMed] [Google Scholar]
- 19. Liu Y, Tsinoremas NF, Golden SS, Kondo T, Johnson CH. 1996. Circadian expression of genes involved in the purine biosynthetic pathway of the cyanobacterium Synechococcus sp. strain PCC 7942. Mol. Microbiol. 20:1071–1081 [DOI] [PubMed] [Google Scholar]
- 20. Niehus E, Cheng E, Tan M. 2008. DNA supercoiling-dependent gene regulation in Chlamydia. J. Bacteriol. 190:6419–6427 [DOI] [PMC free article] [PubMed] [Google Scholar]
- 21. Figueroa-Bossi N, Guerin M, Rahmouni R, Leng M, Bossi L. 1998. The supercoiling sensitivity of a bacterial tRNA promoter parallels its responsiveness to stringent control. EMBO J. 17:2359–2367 [DOI] [PMC free article] [PubMed] [Google Scholar]
- 22. Menzel R, Gellert M. 1987. Modulation of transcription by DNA supercoiling: a deletion analysis of the Escherichia coli gyrA and gyrB promoters. Proc. Natl. Acad. Sci. U. S. A. 84:4185–4189 [DOI] [PMC free article] [PubMed] [Google Scholar]
- 23. Straney R, Krah R, Menzel R. 1994. Mutations in the −10 TATAAT sequence of the gyrA promoter affect both promoter strength and sensitivity to DNA supercoiling. J. Bacteriol. 176:5999–6006 [DOI] [PMC free article] [PubMed] [Google Scholar]
Associated Data
This section collects any data citations, data availability statements, or supplementary materials included in this article.