Abstract
Purpose: Dynamic contrast-enhanced (DCE) MRI has been widely used as a quantitative imaging method for monitoring tumor response to therapy. The simultaneous challenges of increasing temporal and spatial resolution in a setting where the signal from the much smaller voxel is weaker have made this MR technique difficult to implement in small-animal imaging. Existing protocols employed in preclinical DCE-MRI acquire a limited number of slices resulting in potentially lost information in the third dimension. This study describes and compares a family of four-dimensional (3D spatial + time), projection acquisition, radial keyhole-sampling strategies that support high spatial and temporal resolution.
Methods: The 4D method is based on a RF-spoiled, steady-state, gradient-recalled sequence with minimal echo time. An interleaved 3D radial trajectory with a quasi-uniform distribution of points in k-space was used for sampling temporally resolved datasets. These volumes were reconstructed with three different k-space filters encompassing a range of possible radial keyhole strategies. The effect of k-space filtering on spatial and temporal resolution was studied in a 5 mM CuSO4 phantom consisting of a meshgrid with 350-μm spacing and in 12 tumors from three cell lines (HT-29, LoVo, MX-1) and a primary mouse sarcoma model (three tumors/group). The time-to-peak signal intensity was used to assess the effect of the reconstruction filters on temporal resolution. As a measure of heterogeneity in the third dimension, the authors analyzed the spatial distribution of the rate of transport (Ktrans) of the contrast agent across the endothelium barrier for several different types of tumors.
Results: Four-dimensional radial keyhole imaging does not degrade the system spatial resolution. Phantom studies indicate there is a maximum 40% decrease in signal-to-noise ratio as compared to a fully sampled dataset. T1 measurements obtained with the interleaved radial technique do not differ significantly from those made with a conventional Cartesian spin-echo sequence. A bin-by-bin comparison of the distribution of the time-to-peak parameter shows that 4D radial keyhole reconstruction does not cause significant temporal blurring when a temporal resolution of 9.9 s is used for the subsamples of the keyhole data. In vivo studies reveal substantial tumor heterogeneity in the third spatial dimension that may be missed with lower resolution imaging protocols.
Conclusions: Volumetric keyhole imaging with projection acquisition provides a means to increase spatiotemporal resolution and coverage over that provided by existing 2D Cartesian protocols. Furthermore, there is no difference in temporal resolution between the higher spatial resolution keyhole reconstruction and the undersampled projection data. The technique allows one to measure complex heterogeneity of kinetic parameters with isotropic, microscopic spatial resolution.
Keywords: DCE-MRI, MR microscopy, 3D projection acquisition, keyhole imaging, mouse tumor model
INTRODUCTION
Dynamic contrast-enhanced (DCE) MRI has become an important imaging tool in the study of several diseases. This technique has been particularly useful in oncology for monitoring therapeutic response in solid tumors.1, 2 A typical DCE-MRI protocol consists of the following steps: (1) acquisition of pre-injection images for calculating the native T1 and the equilibrium longitudinal magnetization (M0) maps; (2) acquisition of post-injection images for determining the time-dependent tracer concentration; and (3) analysis of tracer dynamics to extract physiological characteristics of the tumor under study. Numerous methods exist for the implementation of each of the above steps: T1 and M0 maps can be acquired with several techniques;3, 4, 5, 6 different mathematical models can be used to analyze the dynamic data;7, 8, 9, 10, 11, 12, 13, 14 and finally, various pulse sequences differing in sampling strategies and acquisition parameters have been developed to sample the signal in k-space.15, 16, 17, 18
The vast majority of preclinical sampling strategies used for DCE-MRI acquire a limited number of relatively thick slices. Volume averaging and limited coverage make it difficult to characterize the heterogeneity in the tumor microenvironment. The limitations are: (1) the location of the imaging slice is arbitrary (which slice should be imaged?); (2) longitudinal imaging is unreliable due to irreproducible slice selection (how do we pinpoint the location of the same slice in the tumor after a few weeks?); and (3) even if the first two limitations are avoided, there is no guarantee that the functional parameters measured in a few slices are representative of the entire tumor (what is the variation in the third spatial dimension?)
The goal of this work is to develop a 4D imaging method for preclinical studies in which temporal and spatial resolution are increased to allow measures of tumor heterogeneity. The work is an extension of previous efforts employing projection imaging with keyhole sampling.17, 19, 20, 21 Keyhole sampling, initially defined for rectilinear MRI,22 refers to a post-acquisition filtering technique in which the center of k-space is updated more frequently than the periphery with the purpose of increasing temporal resolution. Projection imaging, when implemented as a 3D sequence, provides inherently volumetric measurements, has reduced sensitivity to motion and flow artifacts, and allows for shorter echo times as compared to traditional Cartesian methods.23 The acquisition of radial trajectories leads to substantial oversampling at the center of k-space where most of the information related to pixel intensity is encoded. Hence, as shown for 2D sequences,20, 24 radial sampling lends itself naturally to k-space filtering strategies having a fundamental principle similar to keyhole imaging. In this work, we will refer to these techniques as “radial keyhole.” Based on these advantages, several post-acquisition methods can be developed to further improve temporal resolution, while minimizing sampling artifacts.
MATERIALS AND METHODS
The method was implemented on a 7-T small animal, MRI scanner (Bruker BioSpin MRI GmbH, Ettlingen, Germany) equipped with self-shielded gradient coils having a maximum gradient strength of 450 mT/m and rise time of 110 μs. An actively detuned volume excite RF-coil was used in conjunction with a four-element array coil for surface receive.
Acquisition method
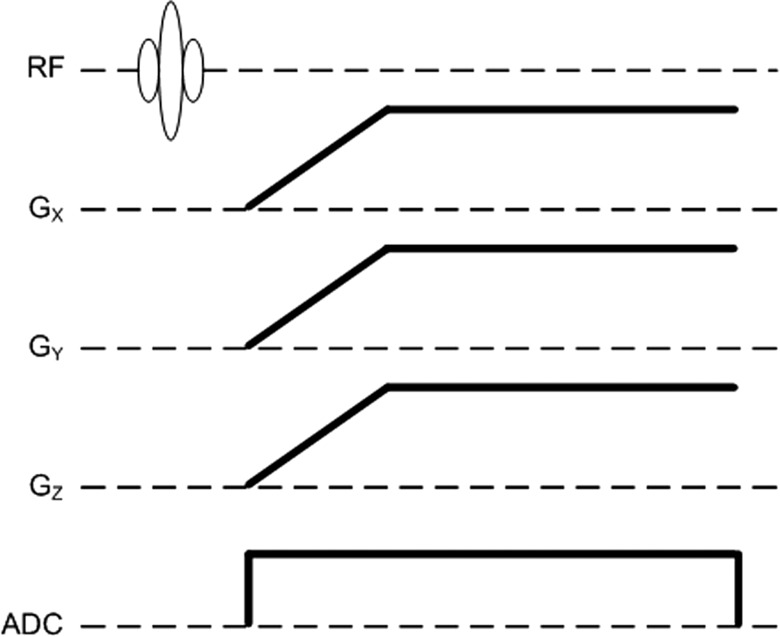
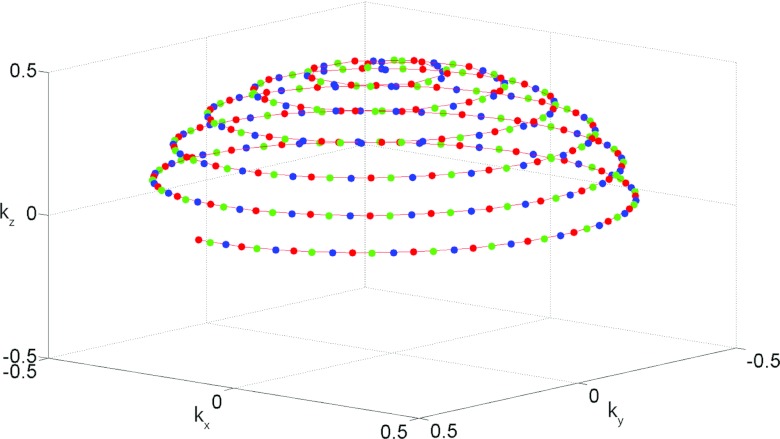
The radial acquisition sequence was implemented on the ParaVision 5.1 software platform (Bruker BioSpin MRI GmbH). The pulse sequence consists of an excitation hard pulse followed with the encoding gradients in three directions as shown in Fig. 1. The sampling trajectory was adapted from Wong et al.25 This technique defines the location of the endpoints of the individual radial spokes (views) using a continuous spiral path on the surface of the unit sphere, resulting in a nearly uniform distribution of samples in k-space. The fully sampled k-space volume was divided into Vt interleaved acquisitions, where Vt − 1 is the rotated version of Vt as illustrated in Fig. 2. If N is the total number of acquired spokes, then the kx, ky, kz coordinates of the endpoints of each spoke in our interleaved trajectory are given by
| (1) |
where the index j = 1, 2, …, Vt references interleaves and i = 1, 2, …, N/Vt references the spokes of a specific interleaf. Hence kz(i, j) is to be interpreted as the kz coordinate of the endpoint of the ith view in the jth interleaf and similarly for kx(i, j) and ky(i, j). The constant c in the expression for the angle α effectively randomizes the order in which views are acquired in the kx–ky direction, thus minimizing artifacts arising from incoherent signal buildup. In our sequence we used c = 203. Fast imaging sequences impose high demands on the scanner hardware leading to k-space trajectories that may deviate significantly from the theoretical projections. Therefore, the k-space trajectory was measured at the beginning of each scan with the method described by Zhang et al.26
Figure 1.
Pulse sequence diagram for 3D radial encoding. During the ramp portion of the gradients, the sampling distance in the radial direction is not uniform. Ideally, the k-space locations can be calculated from the area under the gradient curves. However, in the presence of system nonlinearities (gradient amplifiers, eddy currents) coordinates in k-space may deviate significantly from the theoretical projections. Therefore, the trajectory was measured at the beginning of each study.
Figure 2.
k-Space sampling strategy demonstrating the interleaved radial acquisition. Only the endpoint of each view (spoke) is shown here. Undersampling is implemented by dividing the fully sampled k-space volume into Vt interleaved acquisitions, where Vt − 2 (blue) is the rotated version of Vt − 1 (green), which in turn is the rotated version of Vt (red). Each interleave provides a quasi-uniform sampling of the surface of the sphere.
Acquisition parameters were as follows: FOV = 20 mm3, reconstruction matrix size = 1283, TR/TE = 5/0.02 ms, NEX = 1, flip angle = 10°, digitizer bandwidth = 100 kHz, 1024 dummy views, 1980 views per interleaf, total number of interleaves = 13, and 64 readout points along each projection. The total acquisition time per interleaf was 9.9 s.
Radial keyhole reconstruction
Projection acquisition lends itself naturally to keyhole imaging because of the high oversampling rate at the center of k-space. Assume four interleaves were acquired in the order A, B, C, D. To assess the effect of radial keyhole reconstruction on effective temporal resolution, the following filtering methods were tested on the same raw datasets:
-
1.
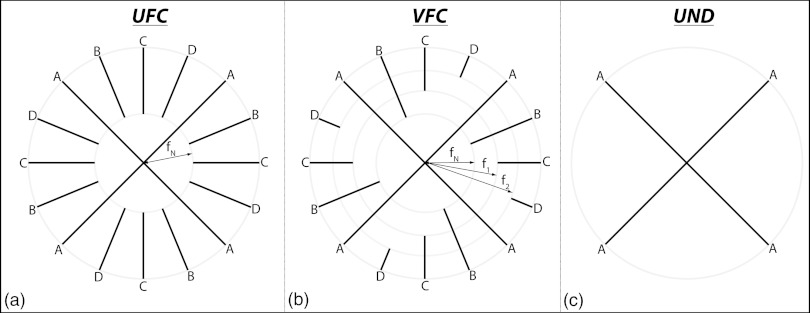
Uniform frequency-cutoff (UFC): To reconstruct a given time point of the DCE study, e.g., time point 1 (interleaf A), the views from the remaining time points (interleaves B, C, and D) were filtered such that only the data in the outer shell of inner radius fN were used. The views from interleaf A were left intact. The sampling function for this case is shown schematically in Fig. 3a.
-
2.
Variable frequency-cutoff (VFC): In this case, to reconstruct the first time point, the views from interleaf B were filtered such that only the data in the outer shell of inner radius fN were used, the views from interleaf C were filtered such that only the data in the outer shell of inner radius f1 were used, and similarly for the following interleaves. Again, as shown in Fig. 3b, the views from interleaf A were not filtered.
-
3.
Undersampled (UND): The data from a single interleaf (e.g., A) were used to reconstruct the respective time point (e.g., time point 1) without the addition of data from the remaining interleaves B, C, or D. The sampling function for this method is shown in Fig. 3c.
Figure 3.
Radial keyhole reconstruction strategies (2D shown for clarity). In this example, interleaves are acquired in the order A, B, C, D and amount to time points 1, 2, 3, 4 in the DCE study. (a) UFC filtering, (b) VFC filtering, and (c) UND filtering. In UFC filtering, all interleaves contribute equally to the reconstruction of the high spatial-frequency features in image space; VFC filtering is an intermediate strategy in which the contribution to high spatial frequencies from consecutive time points is slowly, in this case linearly, reduced; in UND filtering the absence of keyhole combination does not cause temporal blurring.
The cutoff frequency can be described by
| (2) |
where i = 1,2, …,Vt and the parameter δi is
| (3) |
with kmax representing the maximum k-space coordinate that defines the particular spatial resolution being reconstructed and fN defining the region of a single interleaf beyond which the Nyquist criterion is not satisfied (see the Appendix for details). Equation 2 can be used to generate a family of filters by defining different parameters δi which may depend on the variable i.
The standard regridding algorithm was used in the reconstruction of our radial keyhole data. A modified Kaiser–Bessel kernel27 allowing for a faster reconstruction was employed in the gridding step. The kernel parameters were: window size = 3 pixels and oversampling ratio = 3. Analytical density compensation factors for the k-space sampling functions used in this work cannot be found in the published literature. We calculated these factors using the iterative algorithm described by Zwart et al.28 and the gridding kernel from Johnson and Pipe.29 Prior to gridding, the projections from different interleaves were selected using the sliding window method30 providing a continuously updated outer shell in k-space. The raw data from each channel in the four-element array coil were reconstructed separately and combined with the sum-of-squares technique.31 Finally, the reconstructed images were filtered with a 3D Hamming32 window to reduce spatial domain ringing arising by the finite extent of the acquired MR data.
Calculation of T1 and Ktrans
The signal value for our pulse sequence at steady state is given by33
| (4) |
where S0 is a constant proportional to the equilibrium longitudinal magnetization and to the spatially dependent system gain function. The T 2* term can be reduced to unity since TE = 0.02 ms ≈ 0 ms. Equation 4 can then be linearized as
| (5) |
where E1 = exp(−TR/T1). A varying flip-angle acquisition3, 4 with α = 2°, 4°, 6°, 8°, 10°, 12°, 14°, and 16° and TR = 5 ms was used to measure S(α). The T1 and S0 maps were obtained (by linear regression) from the slope and interception of Eq. 5. To minimize sampling artifacts, keyhole filtering was not applied to the radial sequence during the varying flip-angle acquisition. The 3D-radial varying-flip angle technique was verified against a Cartesian varying-TR spin-echo acquisition with the following parameters: TR = 12.5, 25, 50, 100, 200, 400, 800, and 1600 ms, matrix size = 128 × 128, and 1-mm slice at isocenter. The estimated T1 values were compared using a two-tailed t-test.
In the fast exchange limit the relaxation rate, R1 = 1/T1, is given by34
| (6) |
where R10 is the native relaxation rate, C(t) is the time-dependent contrast concentration, and r1 is the longitudinal relaxivity of Gd-DTPA (Magnevist, Schering AG, Berlin, Germany) which at 7 T was found to be r1 = 3.275 mM−1 s−1.35 It has been shown36, 37 that for high accuracy, a nonlinear relation between signal intensity and concentration needs to be assumed. The nonlinear time-dependent relaxation rate3, 36 is given by
| (7) |
where E10 = exp(−TR × R10), S(0) = signal intensity before contrast injection, and S(t) = time-dependent signal intensity. The concentration of the contrast agent is then calculated by rearranging Eq. 6.
The extended Tofts model38 was used in the analysis of our dynamic data. In this framework, the time-dependent contrast agent concentration in the tissue compartment is described by
| (8) |
where Cp(t) is the arterial input function (AIF), vp is the fractional volume of the plasma compartment, ve is the fractional volume of the extravascular–extracellular space (EES), and Ktrans is the rate constant for the transfer of the contrast agent from plasma to EES measured in ml/s of contrast agent per ml of tissue. Equation 8 can be written in matrix form and solved using the linear least-squares method.39Ktrans calculated using a population AIF is highly correlated with the Ktrans estimated using the individual AIF.40 Hence, in the analysis of our dynamic data, the population AIF reported by Loveless et al.40 was used when solving Eq. 8.
Animal and phantom experiments
All animal studies were approved by the Duke University Institutional Animal Care and Use Committee. Female nu/nu mice with the following tumor cell lines, implanted in the mammary fat pad, were imaged: HT-29, LoVo, and MX-1 (three tumors/group, Charles River Laboratories Wilmington, MA). A genetically engineered mouse model of soft tissue sarcoma41 induced in the right hind leg was also imaged (three tumors) with the same protocol. Tumors ranged in volume from 118 to 1318 mm3. During the MR experiment, a custom-made animal positioning system was used to maintain the mouse under anesthesia by isoflurane delivery via a nose cone. Body temperature was controlled between 36 and 37 °C by circulating warm water in the animal cradle. The animals were free-breathing and no respiratory gating was employed. The contrast agent was injected after the acquisition of 15 interleaves (i.e., time points) and dynamic imaging lasted for approximately 40 min (245 time points) post-injection. An automatic syringe pump (KD Scientific Inc., Holliston, MA) provided a consistent contrast injection. Gd-DTPA was administered as a bolus via a 27-gauge tail vein catheter at a dose of 0.5 mmol/kg and flow rate of 2.4 ml/min as described by Loveless et al.40
The effect of the 3D keyhole-sampling technique on spatial resolution and artifacts was validated in a 5 mM CuSO4 phantom consisting of a nylon mesh with 350-μm spacing. The scanning parameters were identical to those used for the in vivo studies.
RESULTS
Acquisition and reconstruction
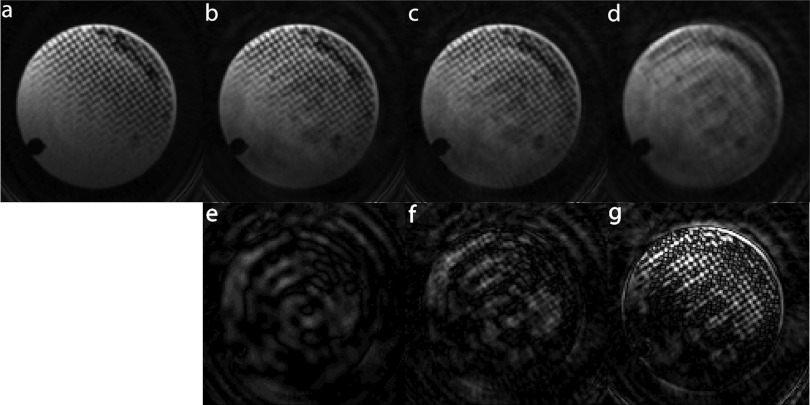
Keyhole imaging is based on the premise that image intensity is encoded at the center of k-space. To test the validity of this assumption in 3D and particularly the effect on spatial resolution, the same raw data acquired on the nylon mesh phantom were reconstructed with the filters presented above. These images are compared in Fig. 4. Figure 4a shows an image of the phantom reconstructed using the views acquired in all interleaves. This image represents the ground truth with respect to spatial resolution. Figure 4d demonstrates the loss of high-frequency information when the UND filter is applied to the raw data. After the data in the periphery of k-space are added in the reconstruction of the images using the UFC or VFC filter, it is clear from Figs. 4b, 4c that the spatial resolution is recovered. A decrease of approximately 40% in the signal-to-noise ratio (SNR) is seen when comparing the fully sampled image in Fig. 4a with the radial keyhole images reconstructed with the VFC and UND filters and a decrease of 20% when comparing with the UFC reconstructed image. No significant SNR difference was observed between the images reconstructed with the VFC and UND filters.
Figure 4.
Effect of radial keyhole reconstruction on spatial resolution. (a) Fully sampled, (b) UFC filtered, (c) VFC filtered, and (d) UND filtered reconstructions. The second row (e)–(g) shows the absolute difference between the fully sampled and the respective radial keyhole image shown in the first row. The spacing in the nylon mesh and pixel size is 350 and 160 μm, respectively. Keyhole reconstruction with projection acquisition is a feasible technique for imaging at the theoretical Nyquist spatial resolution (∼2.3 × pixel size). A maximum SNR decrease of 40% is seen when comparing the fully sampled image with the radial keyhole images.
The second row in Fig. 4 presents the absolute difference between the fully sampled and the respective radial keyhole image shown in the first row. In the difference images of Figs. 4e, 4f, background noise levels are equal to or higher than signal values indicating that indeed the majority of image intensity lies at the inner sphere of radius fN in k-space. This result was also verified in vivo.
The T1 values of the copper sulfate solution estimated with the Cartesian spin-echo sequence and with the variable flip-angle acquisition using the 3D-radial sampling method described above were found to be, respectively, 161 ± 53 and 152 ± 12 ms. At the 5% significance level, these values are not significantly different. Vautier et al.42 have found similar results.
In vivo dynamic MRI
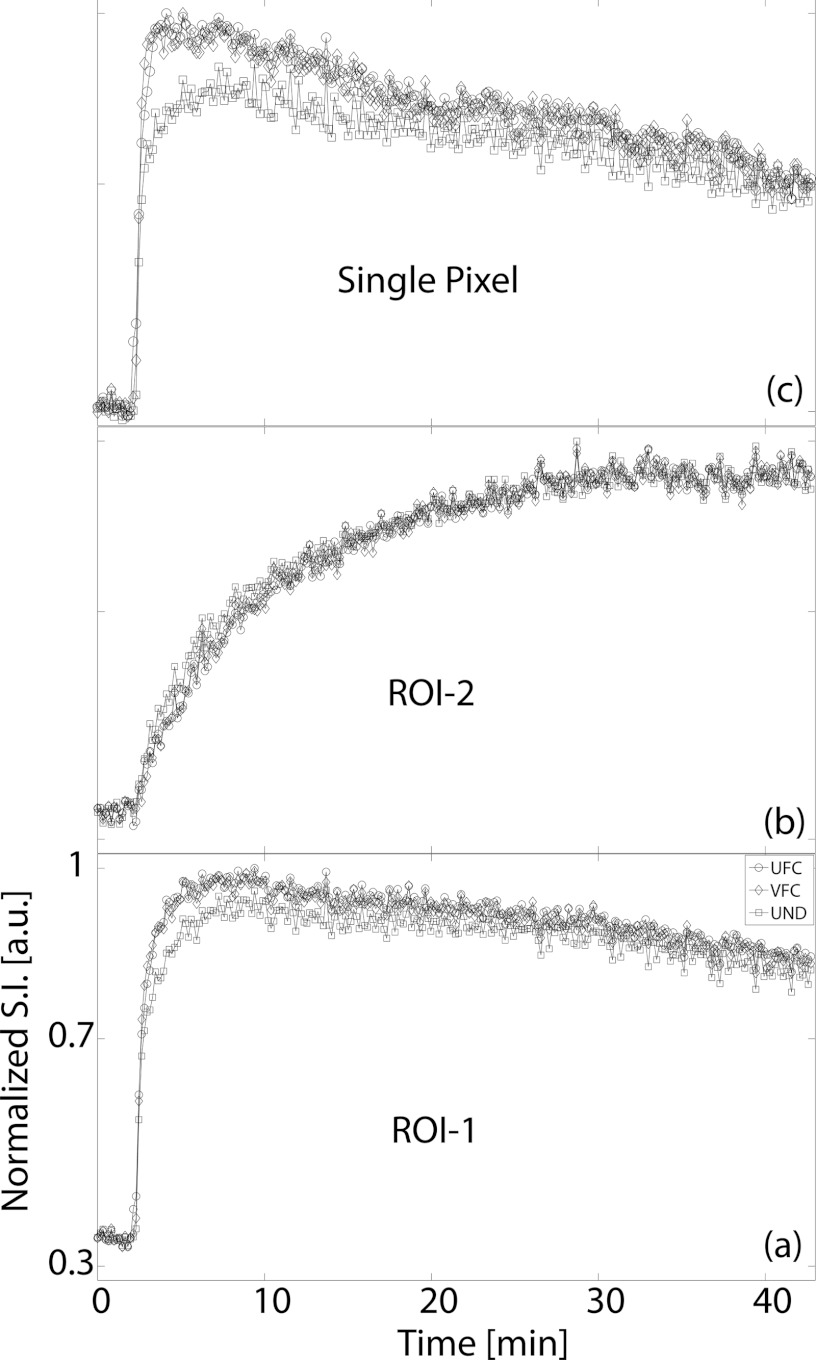
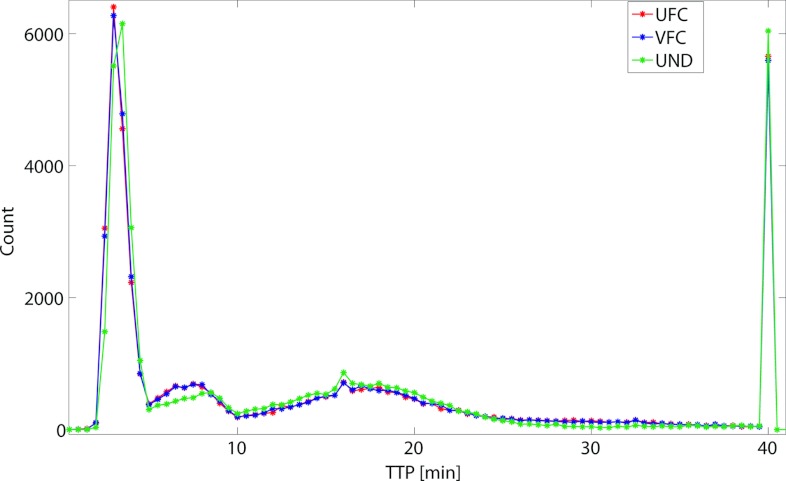
The in vivo native T1 values obtained in this study were consistent with the published literature.14, 40 In the quadriceps femoris muscle group, T1 was in the range (μ ± 2σ) 1.43–2.10 s, while tumor T1 was between 2.76 and 4.93 s. Figure 5 presents the Ktrans map from a central slice in one of the HT-29 tumors overlaid on the grayscale image reconstructed with each of the radial keyhole filters. A region of interest (ROI) of 24 pixels was selected in a fast-enhancing (ROI-1) and a slow-enhancing (ROI-2) region in the tumor. The Ktrans values calculated from the dynamic volumes reconstructed with the UFC, VFC, and UND filters are listed in Table 1 for comparison. There is no significant difference at the 5% significance level between these values. The normalized time-dependent signal in ROI-1, ROI-2, and a single pixel inside the fast-enhancing region, is plotted in Fig. 6 illustrating the time evolution of signal intensity as a function of the k-space filter used for reconstruction. The time-to-peak (TTP) parameter is found as the time in seconds it takes the signal intensity to reach its maximum value. We used TTP as a measure of temporal blurring. To assess whether the use of the reconstruction filters resulted in curves with significantly different time-to-peak values, 3D maps of the TTP parameter were generated and compared. The tumor volume was manually segmented and the mask was used to compare the pixels only in the tumor region. As shown previously,20 reconstructing with the UND filter does not cause temporal blurring: the undersampled 4D dataset represents the ground truth with respect to temporal resolution. The histogram of TTP from a representative animal is shown in Fig. 7. A bin-by-bin comparison of the distribution of TTP revealed that the UFC and VFC filters did not lead to significantly different values (Wilcoxon Sign-Rank test at the 5% significance level) as compared to the TTP calculated when UND was used. This finding was confirmed in all tumors studied in this work.
Figure 5.

Ktrans map overlayed on the grayscale image reconstructed with (a) UFC, (b) VFC, and (c) UND filtering. Regions 1 and 2, where the time–intensity curves of Fig. 6 were measured, were selected in a fast-enhancing and a slow-enhancing location, respectively. Ktrans values calculated from the 4D images reconstructed with each of the radial keyhole filters were not significantly different from each other in these locations (Table 1).
Table 1.
Ktrans at ROI-1 and ROI-2 (Fig. 5) calculated from the 4D volumes reconstructed with the UFC, VFC, and UND filters. At the 5% significance level, there is no significant difference between these values.
| UFC (s−1) | VFC (s−1) | UND (s−1) | |
|---|---|---|---|
| ROI-1 | 0.26 ± 0.07 | 0.26 ± 0.07 | 0.23 ± 0.04 |
| ROI-2 | 0.12 ± 0.04 | 0.12 ± 0.04 | 0.13 ± 0.04 |
Figure 6.
Signal intensity vs time curves from (a) ROI-1, (b) ROI-2, and (c) a single pixel inside ROI-1 (ROIs shown in Fig. 5). TTP signal intensity was used in this study as a measure of temporal blurring. Notice that even though the peak signal value is not necessarily the same between the three filters, TTP does not differ significantly. All plots have the same x- and y-axis range as that shown in panel (a).
Figure 7.
Comparison of TTP histograms when the UFC, VFC, and UND filters were used in reconstruction. TTP calculated with the UND filter was used as the ground truth. In all studied tumors, no significant difference was found between the histograms calculated with either UFC or VFC filtering.
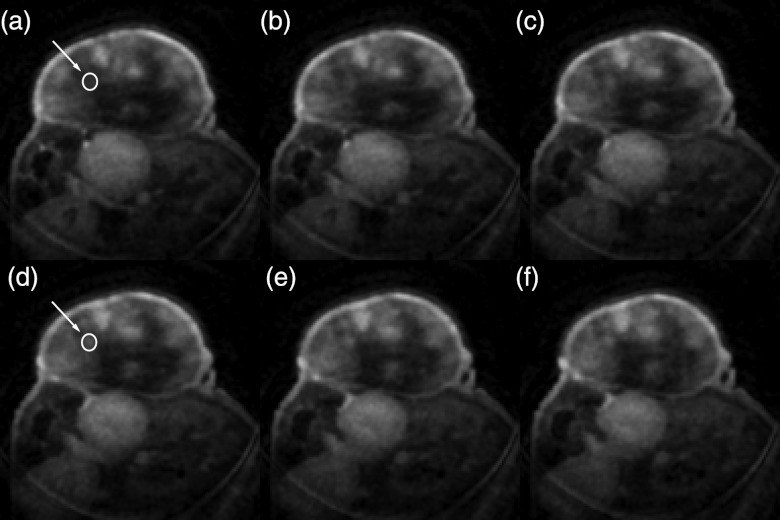
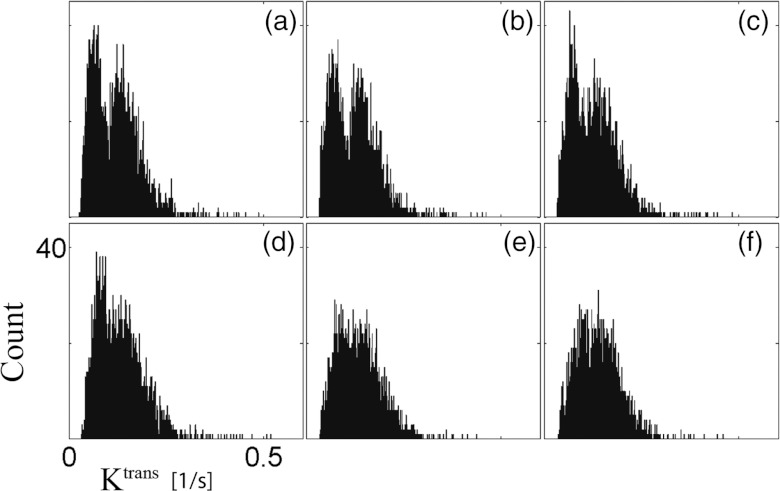
A montage of six consecutive slices is shown in Fig. 8. Two identical ROIs with an area of 32 pixels were defined at the same location in slice 91 [arrow in Fig. 8a] and slice 94 [arrow in Fig. 8d]. Ktrans in these regions was 0.066 ± 0.007 and 0.117 ± 0.021 s−1, respectively; these values are significantly different from each other (at the 5% significance level). A montage of the histogram of Ktrans for each respective slice is shown in Fig. 9. Care was taken to exclude the fatty tissue surrounding the tumor.
Figure 8.
Montage of six consecutive slices [slices 91–96 corresponding to panels (a)–(f)]. The arrows point to the circular ROIs, selected in slices 91 and 94, where the Ktrans values were compared. In this case, tumor heterogeneity in the z direction is being investigated. Ktrans in these two locations was significantly different. The distance between slices is 160 μm.
Figure 9.
Montage of the histogram of Ktrans in the tumor region for the respective slices shown in Fig. 8. The tumor was manually segmented at each slice. Notice the different distributions in slices 91–93 (a)–(c) and 94–96 (d)–(f). All histograms have the same x- and y-axis range as that shown in panel (d).
DISCUSSION
Keyhole imaging can be implemented through several filtering strategies20, 43 for which the main tradeoff is between temporal resolution, spatial resolution, and sampling artifacts. In general, reduced filtering leads to a decreased level of artifacts, which in turn may introduce temporal blurring. The filtering methods chosen in this study are meant to encompass a wide range of radial keyhole strategies combining the data in the periphery of k-space: in UFC filtering, all interleaves contribute equally to the reconstruction of the high spatial-frequency features in image space and potentially lead to temporal blurring in these regions; VFC filtering is an intermediate strategy in which the contribution to high spatial-frequencies from consecutive time points is slowly, in our case linearly, reduced [for VFC, δi in Eq. 3 assures there is no contribution from the farthest temporal interleaf]; as was shown by Song and Dougherty,20 in UND filtering the absence of keyhole combination does not cause temporal blurring. A comparison of Figs. 4a, 4b, 4c, 4d reveals that spatial resolution is preserved for UFC filtering and only partially degraded when VFC filtering is employed. The effect of VFC filtering on spatial resolution arises from the fact that in regions of k-space that satisfy fN < kr < fV (V = total number of interleaves) the Nyquist criterion is generally not satisfied. Partial blurring of some of the highest frequency features in image space is demonstrated in the difference image of Fig. 4f.
The spacing in the nylon meshgrid (350 μm) was chosen because it is approximately equal to the theoretical achievable resolution of the system which is ∼2.3 × pixel size due to the effect of the density compensation factors and the Hamming filter.44 Therefore, both radial keyhole filters retain the system resolution at the cost of reduced SNR. As expected, we observe a decrease in SNR since the amount of raw MR data at the center of k-space, which encodes signal intensity, is reduced by a factor of Vt.
Methods for sufficient sampling of k-space with non-Cartesian sequences, such as the bit-reversed (BR) or golden-angle (GA) scheme, have been recently compared in the literature.45 While it is true that these sampling strategies can provide evenly spaced projections in k-space, they have certain limitations. Both the BR and GA techniques are defined for sampling k-space in two dimensions and the extension to 3D is nontrivial. Most importantly, the Archimedean spiral trajectory described in Eq. 1 is well suited for 4D contrast-enhanced MRI for these two reasons: first, each interleaf provides a quasi-uniform sampling of the 3D k-space, and second, all combined interleaves provide a quasi-uniform sampling of the 3D k-space. Such distribution of spokes in k-space minimizes the sampling artifacts for each temporally resolved interleaf.
It is well known that perfusion curves can be modeled by a lognormal distribution having a global maximum early in the enhancement stage.46 Therefore, a method that causes temporal blurring would result in temporal curves with shifted time-to-peak signal intensities. While the TTP parameter is used extensively in perfusion imaging, we use it in this study as a measure of effective temporal resolution. When compared to the ground truth with respect to temporal resolution, no significant difference was found between the distributions of TTP calculated when either UFC or VFC filtering was used in the reconstruction of the temporally resolved volumes. Hence, these two filters retain the temporal resolution of 9.9 s achieved with the UND filter. Of critical importance is the finding by Loveless et al.,40 which has shown that a population arterial input function can be used when calculating the kinetic parameters of the extended Tofts model. This allows a relaxation of the requirement of very high temporal resolution (usually 1–2 s) needed for the sampling of the AIF and provides an opportunity for implementing these 3D keyhole-sampling techniques with a sufficiently high temporal resolution.
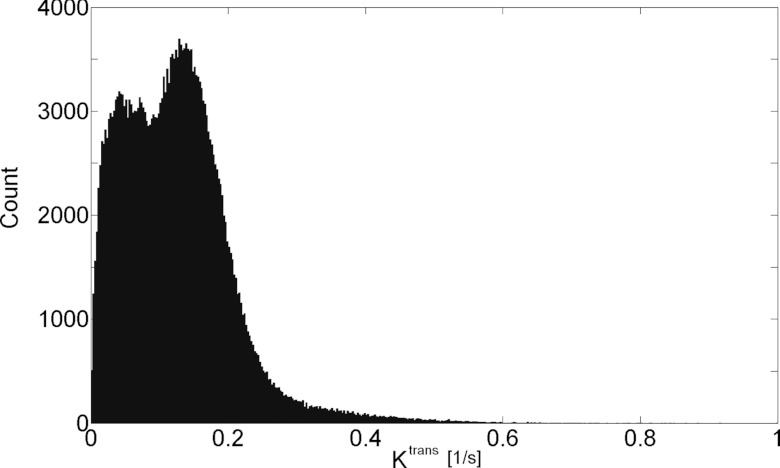
Given that the voxel size in this study is 160 μm, it is remarkable that Ktrans is significantly different at the two ROIs shown in Fig. 8. More importantly, note that in Fig. 9 the histogram of Ktrans at these regions is drastically different. A bimodal distribution at slice 91 is changed into a skewed Gaussian distribution at slice 94. The results above demonstrate that the heterogeneity in the third dimension (z direction in this case) is significant and should not be ignored. Bigger voxels may lead to an incomplete survey of the tumor microenvironment. This finding is further supported in Fig. 10. It is clear that the distribution of Ktrans over the entire tumor volume is bimodal and skewed to the right. If, for example, a 2D sampling protocol was employed in the study of the tumor heterogeneity and slice 94 was imaged, the results would not be representative of the true distribution of the kinetic parameters found in the tumor.
Figure 10.
Histogram of Ktrans over the entire tumor volume. The volume was manually segmented. Care was taken not to include in the segmentation the capsule of fatty tissue surrounding the tumor. The distribution of Ktrans over this volume is bimodal and skewed to the right. Compare with the distribution of Ktrans in slices 94–96 [Figs. 9d, 9e, 9f].
In vivo experiments of four different tumor types (n = 3/type) were undertaken to address the issue of what temporal resolution would be required considering the tradeoffs between temporal and spatial resolution. Our concern was whether the sampling interval (9.9 s) was sufficiently short to appropriately measure the signal intensity changes related to contrast exchange kinetics. The entire 4D volume of each dynamic study was examined on a pixel-by-pixel basis to determine the shortest time to peak in the tumor. The results are shown in Table 2. For all but the last case, there were at least seven samples before reaching the time to peak. We believe the last point was an outlier arising from a motion artifact. For the majority of the tumors there were at least 14 points in the rising portion of the curve—for the shortest TTP in the entire volume. Thus, we believe the temporal sampling interval we have used should be sufficient to adequately sample the initial rapidly changing signal in the tumor.
Table 2.
Minimum value of TTP in tumor volume when UND was used as a reconstruction filter. The temporal sampling interval was 9.9 s. In all but one of the tumors studied, there are at least seven sample points in the rising portion of the dynamic curve.
| Tumor | TTPmin (s) | ||
|---|---|---|---|
| HT29 | 237.6 | ||
| HT29 | 168 | ||
| Sarcoma | 158.4 | ||
| MX1 | 148.5 | ||
| MX1 | 148.5 | ||
| MX1 | 148.5 | ||
| LoVo | 138.6 | ||
| LoVo | 138.6 | ||
| HT29 | 79.2 | ||
| Sarcoma | 79.2 | ||
| Sarcoma | 69.3 | ||
| LoVo | 39.6 |
CONCLUSIONS
The study of the heterogeneous microenvironment in tumors necessitates the use of high spatial and temporal resolution DCE-MRI. Radial sampling is less sensitive to motion and flow artifacts. More importantly, this sampling technique lends itself naturally to keyhole reconstruction because of the high oversampling rate at the center of k-space where most of the image intensity is encoded. We have shown here that 4D-radial keyhole imaging is a feasible technique for high resolution DCE-MRI. This technique retains the spatial resolution as compared to a fully sampled dataset and the temporal resolution achieved with an undersampled dataset. An in vivo study reveals tumor regions less than 500 μm apart in the z-direction with significantly different contrast kinetics. The biomarker used in this project was Ktrans, but the method is also suitable for the study of other pharmacokinetic parameters. Indeed, it has been suggested that the complexity of the tumor microenvironment needs to be analyzed with biomarkers that are not only sensitive to kinetic parameters, but also to their spatial distribution.47 It is in these cases that we see the use of a high spatial resolution method, such as the radial keyhole technique described here, of particular relevance.
Kermode and Tofts48 presented some of the first attempts at quantitative dynamic MRI more than 20 years ago. Since that time, DCE-MRI has found a wide range of applications in the clinical and preclinical arena. Advances in acquisition methods, reconstruction, and hardware have lead to great improvements in spatial and temporal resolution. Kim et al.49 have reported a protocol with a voxel size of 0.23 × 0.23 × 1 mm3 and temporal resolution of 58.9 s while Loveless et al.40 achieved a temporal resolution of 1.5 s with a voxel of 0.39 × 0.39 × 2 mm3. If the product of voxel size and temporal resolution is used as the figure of merit, the work here presents an improvement by more than an order of magnitude over that previously reported. Currently, no unified protocol exists for the implementation of a DCE-MRI experiment in the preclinical domain. We believe the proposed technique satisfies some of the spatial/temporal resolution requirements for preclinical DCE-MRI and may serve as a reference for future efforts in standardization.
ACKNOWLEDGMENTS
This work was performed at the Duke Center for In Vivo Microscopy, a NIH/NIBIB National Biomedical Technology Resource Center (P41 EB015897). The authors wish to thank Dr. Jim Pipe and colleagues at the Barrow Neurological Institute for the regridding algorithm (http://www.ismrm.org/mri_unbound/sequence.htm) and Dr. Jacqueline Maurer and Sally Zimney for the careful editorial assistance.
APPENDIX: CALCULATION OF k-SPACE CUTOFF FREQUENCY
The number of views for full sampling with 3D radial is given by50
where N = total number of spokes (acquired from the center to the periphery of k-space) and Np = the number of samples in the radial direction. For a total of Vt interleaves, the solid angle associated with each view in a single interleaved acquisition increases by a factor of Vt. Therefore, the Nyquist criterion is satisfied only in an inner sphere of radius:
where fN is the k-space cutoff frequency shown in Fig. 3. Since in the proposed sequence spatial encoding happens also during the ramp portion of the gradients, the number of samples in the radial direction that determines fN is not found by but should be calculated by looking at the k-space radial sampling rate, Δkr (which in our study was measured). Ideally, when using rectangular gradients, Δkr is constant, but with trapezoidal gradients Δkr will increase linearly in the ramp portion.
References
- O’Connor J. P. B., Jackson A., Parker G. J. M., Roberts C., and Jayson G. C., “Dynamic contrast-enhanced MRI in clinical trials of antivascular therapies,” Nat. Rev. Clin. Oncol. 9(3), 167–177 (2012). 10.1038/nrclinonc.2012.2 [DOI] [PubMed] [Google Scholar]
- Padhani A. R. and Miles K. A., “Multiparametric imaging of tumor response to therapy,” Radiology 256(2), 348–364 (2010). 10.1148/radiol.10091760 [DOI] [PubMed] [Google Scholar]
- Li K.-L., Zhu X. P., Waterton J., and Jackson A., “Improved 3D quantitative mapping of blood volume and endothelial permeability in brain tumors,” J. Magn. Reson. Imaging 12(2), 347–357 (2000). [DOI] [PubMed] [Google Scholar]
- Deoni S. C. L., Rutt B. K., and Peters T. M., “Rapid combined T1 and T2 mapping using gradient recalled acquisition in the steady state,” Magn. Reson. Med. 49(3), 515–526 (2003). 10.1002/mrm.10407 [DOI] [PubMed] [Google Scholar]
- Treier R., Steingoetter A., Fried M., Schwizer W., and Boesiger P., “Optimized and combined T1 and B1 mapping technique for fast and accurate T1 quantification in contrast-enhanced abdominal MRI,” Magn. Reson. Med. 57(3), 568–576 (2007). 10.1002/mrm.21177 [DOI] [PubMed] [Google Scholar]
- Cheng H.-L. M., “T1 measurement of flowing blood and arterial input function determination for quantitative 3D T1-weighted DCE-MRI,” J. Magn. Reson. Imaging 25(5), 1073–1078 (2007). 10.1002/jmri.20898 [DOI] [PubMed] [Google Scholar]
- Johnson J. and Wilson T., “A model for capillary exchange,” Am. J. Physiol.—Legacy Content 210(6), 1299–1303 (1966). [DOI] [PubMed] [Google Scholar]
- Patlak C. S., Blasberg R. G., and Fenstermacher J. D., “Graphical evaluation of blood-to-brain transfer constants from multiple-time uptake data,” J. Cereb. Blood Flow Metab. 3(1), 1–7 (1983). 10.1038/jcbfm.1983.1 [DOI] [PubMed] [Google Scholar]
- Tofts P. S. and Kermode A. G., “Measurement of the blood-brain barrier permeability and leakage space using dynamic MR imaging. 1. Fundamental concepts,” Magn. Reson. Med. 17(2), 357–367 (1991). 10.1002/mrm.1910170208 [DOI] [PubMed] [Google Scholar]
- Østergaard L., Weisskoff R. M., Chesler D. A., Gyldensted C., and Rosen B. R., “High resolution measurement of cerebral blood flow using intravascular tracer bolus passages. Part I: Mathematical approach and statistical analysis,” Magn. Reson. Med. 36(5), 715–725 (1996). 10.1002/mrm.1910360510 [DOI] [PubMed] [Google Scholar]
- Lawrence K. S. St. and Lee T.-Y., “An adiabatic approximation to the tissue homogeneity model for water exchange in the brain: I. theoretical derivation,” J. Cereb. Blood Flow Metab. 18(12), 1365–1377 (1998). 10.1097/00004647-199812000-00011 [DOI] [PubMed] [Google Scholar]
- Tofts P. S., Brix G., Buckley D. L., Evelhoch J. L., Henderson E., Knopp M. V., Larsson H. B. W., Lee T.-Y., Mayr N. A., Parker G. J. M., Port R. E., Taylor J., and Weisskoff R. M., “Estimating kinetic parameters from dynamic contrast-enhanced T1-weighted MRI of a diffusable tracer: Standardized quantities and symbols,” J. Magn. Reson. Imaging 10(3), 223–232 (1999). [DOI] [PubMed] [Google Scholar]
- Brix G., Kiessling F., Lucht R., Darai S., Wasser K., Delorme S., and Griebel J., “Microcirculation and microvasculature in breast tumors: Pharmacokinetic analysis of dynamic MR image series,” Magn. Reson. Med. 52(2), 420–429 (2004). 10.1002/mrm.20161 [DOI] [PubMed] [Google Scholar]
- Yankeelov T. E., Luci J. J., Lepage M., Li R., Debusk L., Lin P. C., Price R. R., and Gore J. C., “Quantitative pharmacokinetic analysis of DCE-MRI data without an arterial input function: A reference region model,” Magn. Reson. Imaging 23(4), 519–529 (2005). 10.1016/j.mri.2005.02.013 [DOI] [PubMed] [Google Scholar]
- Daniel B. L., Yen Y. F., Glover G. H., Ikeda D. M., Birdwell R. L., Sawyer-Glover A. M., Black J. W., Plevritis S. K., Jeffrey S. S., and Herfkens R. J., “Breast disease: dynamic spiral MR imaging,” Radiology 209(2), 499–509 (1998). [DOI] [PubMed] [Google Scholar]
- Yen Y.-F., Han K. F., Daniel B. L., Heiss S., Birdwell R. L., Herfkens R. J., Sawyer-Glover A. M., and Glover G. H., “Dynamic breast MRI with spiral trajectories: 3D versus 2D,” J. Magn. Reson. Imaging 11(4), 351–359 (2000). [DOI] [PubMed] [Google Scholar]
- Dougherty L., Isaac G., Rosen M. A., Nunes L. W., Moate P. J., Boston R. C., Schnall M. D., and Song H. K., “High frame-rate simultaneous bilateral breast DCE-MRI,” Magn. Reson. Med. 57(1), 220–225 (2007). 10.1002/mrm.21114 [DOI] [PubMed] [Google Scholar]
- Han M., Daniel B. L., and Hargreaves B. A., “Accelerated bilateral dynamic contrast-enhanced 3D spiral breast MRI using TSENSE,” J. Magn. Reson. Imaging 28(6), 1425–1434 (2008). 10.1002/jmri.21427 [DOI] [PubMed] [Google Scholar]
- Song H. K. and Dougherty L., “k-Space weighted image contrast (KWIC) for contrast manipulation in projection reconstruction MRI,” Magn. Reson. Med. 44(6), 825–832 (2000). [DOI] [PubMed] [Google Scholar]
- Song H. K. and Dougherty L., “Dynamic MRI with projection reconstruction and KWIC processing for simultaneous high spatial and temporal resolution,” Magn. Reson. Med. 52(4), 815–824 (2004). 10.1002/mrm.20237 [DOI] [PubMed] [Google Scholar]
- Lethmate R., Ratiney H., Wajer F. T. A. W., Crémillieux Y., Ormondt D., and Graveron-Demilly D., “Dynamic magnetic resonance imaging with radial scanning: a post-acquisition keyhole approach,” MAGMA (N.Y.) 16(1), 21–28 (2003). 10.1007/s10334-003-0003-y [DOI] [PubMed] [Google Scholar]
- Van Vaals J. J., Brummer M. E., Thomas Dixon W., Tuithof H. H., Engels H., Nelson R. C., Gerety B. M., Chezmar J. L., and Den Boer J. A., ““Keyhole” method for accelerating imaging of contrast agent uptake,” J. Magn. Reson. Imaging 3(4), 671–675 (1993). 10.1002/jmri.1880030419 [DOI] [PubMed] [Google Scholar]
- Glover G. H. and Pauly J. M., “Projection reconstruction techniques for reduction of motion effects in MRI,” Magn. Reson. Med. 28(2), 275–289 (1992). 10.1002/mrm.1910280209 [DOI] [PubMed] [Google Scholar]
- Mistry N. N., Pollaro J., Song J., De Lin M., and Johnson G. A., “Pulmonary perfusion imaging in the rodent lung using dynamic contrast-enhanced MRI,” Magn. Reson. Med. 59(2), 289–297 (2008). 10.1002/mrm.21353 [DOI] [PMC free article] [PubMed] [Google Scholar]
- Wong S. T. S. and Roos M. S., “A strategy for sampling on a sphere applied to 3D selective RF pulse design,” Magn. Reson. Med. 32(6), 778–784 (1994). 10.1002/mrm.1910320614 [DOI] [PubMed] [Google Scholar]
- Zhang Y., Hetherington H. P., Stokely E. M., Mason G. F., and Twieg D. B., “A novel k-space trajectory measurement technique,” Magn. Reson. Med. 39(6), 999–1004 (1998). 10.1002/mrm.1910390618 [DOI] [PubMed] [Google Scholar]
- Beatty P. J., Nishimura D. G., and Pauly J. M., “Rapid gridding reconstruction with a minimal oversampling ratio,” IEEE Trans. Med. Imaging 24(6), 799–808 (2005). 10.1109/TMI.2005.848376 [DOI] [PubMed] [Google Scholar]
- Zwart N. R., Johnson K. O., and Pipe J. G., “Efficient sample density estimation by combining gridding and an optimized kernel,” Magn. Reson. Med. 67(3), 701–710 (2012). 10.1002/mrm.23041 [DOI] [PubMed] [Google Scholar]
- Johnson K. O. and Pipe J. G., “Convolution kernel design and efficient algorithm for sampling density correction,” Magn. Reson. Med. 61(2), 439–447 (2009). 10.1002/mrm.21840 [DOI] [PubMed] [Google Scholar]
- Riederer S. J., Tasciyan T., Farzaneh F., Lee J. N., Wright R. C., and Herfkens R. J., “MR fluoroscopy: Technical feasibility,” Magn. Reson. Med. 8(1), 1–15 (1988). 10.1002/mrm.1910080102 [DOI] [PubMed] [Google Scholar]
- Roemer P. B., Edelstein W. A., Hayes C. E., Souza S. P., and Mueller O. M., “The NMR phased array,” Magn. Reson. Med. 16(2), 192–225 (1990). 10.1002/mrm.1910160203 [DOI] [PubMed] [Google Scholar]
- Lowe M. J. and Sorenson J. A., “Spatially filtering functional magnetic resonance imaging data,” Magn. Reson. Med. 37(5), 723–729 (1997). 10.1002/mrm.1910370514 [DOI] [PubMed] [Google Scholar]
- Callaghan P. T., Principles of Nuclear Magnetic Resonance Microscopy (Oxford University Press, New York, 1991). [Google Scholar]
- Landis C. S., Li X., Telang F. W., Coderre J. A., Micca P. L., Rooney W. D., Latour L. L., Vétek G., Pályka I., and Springer C. S., “Determination of the MRI contrast agent concentration time course in vivo following bolus injection: Effect of equilibrium transcytolemmal water exchange,” Magn. Reson. Med. 44(4), 563–574 (2000). [DOI] [PubMed] [Google Scholar]
- Noebauer-Huhmann I. M., Szomolanyi P., Juras V., Kraff O., Ladd M. E., and Trattnig S., “Gadolinium-based magnetic resonance contrast agents at 7 Tesla: In vitro T1 relaxivities in human blood plasma,” Invest. Radiol. 45(9), 554–558 (2010). 10.1097/RLI.0b013e3181ebd4e3 [DOI] [PubMed] [Google Scholar]
- Heilmann M., Kiessling F., Enderlin M., and Schad L. R., “Determination of pharmacokinetic parameters in DCE MRI: Consequence of nonlinearity between contrast agent concentration and signal intensity,” Invest. Radiol. 41(6), 536–543 (2006). 10.1097/01.rli.0000209607.99200.53 [DOI] [PubMed] [Google Scholar]
- Schabel M. C. and Parker D. L., “Uncertainty and bias in contrast concentration measurements using spoiled gradient echo pulse sequences,” Phys. Med. Biol. 53(9), 2345–2373 (2008). 10.1088/0031-9155/53/9/010 [DOI] [PMC free article] [PubMed] [Google Scholar]
- Tofts P. S., “Modeling tracer kinetics in dynamic Gd-DTPA MR imaging,” J. Magn. Reson. Imaging 7(1), 91–101 (1997). 10.1002/jmri.1880070113 [DOI] [PubMed] [Google Scholar]
- Murase K., “Efficient method for calculating kinetic parameters using T1-weighted dynamic contrast-enhanced magnetic resonance imaging,” Magn. Reson. Med. 51(4), 858–862 (2004). 10.1002/mrm.20022 [DOI] [PubMed] [Google Scholar]
- Loveless M. E., Halliday J., Liess C., Xu L., Dortch R. D., Whisenant J., Waterton J. C., Gore J. C., and Yankeelov T. E., “A quantitative comparison of the influence of individual versus population-derived vascular input functions on dynamic contrast enhanced-MRI in small animals,” Magn. Reson. Med. 67(1), 226–236 (2012). 10.1002/mrm.22988 [DOI] [PMC free article] [PubMed] [Google Scholar]
- Kirsch D. G., Dinulescu D. M., Miller J. B., Grimm J., Santiago P. M., Young N. P., Nielsen G. P., Quade B. J., Chaber C. J., Schultz C. P., Takeuchi O., Bronson R. T., Crowley D., Korsmeyer S. J., Yoon S. S., Hornicek F. J., Weissleder R., and Jacks T., “A spatially and temporally restricted mouse model of soft tissue sarcoma,” Nat. Med. 13(8), 992–997 (2007). 10.1038/nm1602 [DOI] [PubMed] [Google Scholar]
- Vautier J., Heilmann M., Walczak C., Mispelter J., and Volk A., “2D and 3D radial multi-gradient-echo DCE MRI in murine tumor models with dynamic R*2-corrected R1 mapping,” Magn. Reson. Med. 64(1), 313–318 (2010). 10.1002/mrm.22396 [DOI] [PubMed] [Google Scholar]
- Altbach M. I., Bilgin A., Li Z., Clarkson E. W., Trouard T. P., and Gmitro A. F., “Processing of radial fast spin-echo data for obtaining T2 estimates from a single k-space data set,” Magn. Reson. Med. 54(3), 549–559 (2005). 10.1002/mrm.20611 [DOI] [PubMed] [Google Scholar]
- Haacke E. M., Brown R. W., Thompson M. R., and Venkatesan R., Magnetic Resonance Imaging: Physical Principles and Sequence Design (Wiley, New York, NY, 1999). [Google Scholar]
- Chan R. W., Ramsay E. A., Cheung E. Y., and Plewes D. B., “The influence of radial undersampling schemes on compressed sensing reconstruction in breast MRI,” Magn. Reson. Med. 67(2), 363–377 (2012). 10.1002/mrm.23008 [DOI] [PubMed] [Google Scholar]
- Strouthos C., Lampaskis M., Sboros V., McNeilly A., and Averkiou M., “Indicator dilution models for the quantification of microvascular blood flow with bolus administration of ultrasound contrast agents,” IEEE Trans. Ultrason. Ferroelectr. Freq. Control 57(6), 1296–1310 (2010). 10.1109/TUFFC.2010.1550 [DOI] [PubMed] [Google Scholar]
- Rose C. J., Mills S. J., O’Connor J. P. B., Buonaccorsi G. A., Roberts C., Watson Y., Cheung S., Zhao S., Whitcher B., Jackson A., and Parker G. J. M., “Quantifying spatial heterogeneity in dynamic contrast-enhanced MRI parameter maps,” Magn. Reson. Med. 62(2), 488–499 (2009). 10.1002/mrm.22003 [DOI] [PubMed] [Google Scholar]
- Kermode A. G., Tofts P. S., Macmanus D. G., Kendall B. E., Kingsley D. P. E., Moseley I. F., Du Boulay E. P. G. H., and McDonald W. I., “Early lesion of multiple sclerosis,” Lancet 332(8621), 1203–1204 (1988). 10.1016/S0140-6736(88)90278-4 [DOI] [PubMed] [Google Scholar]
- Kim H., Folks K., Guo L., Stockard C., Fineberg N., Grizzle W., George J., Buchsbaum D., Morgan D., and Zinn K., “DCE-MRI detects early vascular response in breast tumor xenografts following anti-DR5 therapy,” Mol. Imaging Biol. 13(1), 94–103 (2011). 10.1007/s11307-010-0320-2 [DOI] [PMC free article] [PubMed] [Google Scholar]
- Bernstein M., King K., and Zhou X., Handbook of MRI Pulse Sequences (Elsevier, Burlington, MA, 2004). [Google Scholar]


