Abstract
Purpose: The purpose of this work is to present a performance study of the digital beam attenuator (DBA) for implementing fluence field modulated CT (FFMCT) using a simulation framework developed to model the incorporation of the DBA into an existing CT system. Additionally, initial results will be presented using a prototype DBA and the realization of the prototype will be described. To our knowledge, this study represents the first experimental use of a device capable of modulating x-ray fluence as a function of fan angle using a CT geometry.
Methods: To realize FFMCT, the authors propose to use a wedge design in which one wedge is held stationary and another wedge is moved over the stationary wedge. Due to the wedge shape, the composite thickness of the two wedges changes as a function of the amount of overlap between the wedges. This design allows for the wedges to modulate the photon fluence incident onto a patient. Using a simulation environment, the effect of changing the number of wedges has on dose, scatter, detector dynamic range, and noise uniformity is explored. Experimental results are presented using a prototype DBA having ten Fe wedges and a c-arm CT system geometry. The experimental DBA results are compared to non-DBA scans using scatter and detector dynamic range as metrics. Both flat field and bowtie filtered CT acquisitions were simulated for comparison with the DBA.
Results: Numerical results suggest that substantial gains in noise uniformity and scatter-to-primary ratio (SPR) can be obtained using only seven wedges. After seven wedges, the decrease in noise ununiformity and SPR falls off at a lower rate. Simulations comparing CT acquisitions between flat field, bowtie enabled, and DBA CT acquisitions suggest DBA-FFMCT can reduce dose relative to flat field CT by ≈3 times. A bowtie filter under the same imaging conditions was shown to only allow a dose reduction of 1.65 times. Experimentally, a 10 wedge DBA prototype result showed a SPR reduction of ≈4 times relative to flat field CT. The dynamic range for the DBA prototype was 3.7 compared to 84.2 for the flat field scan.
Conclusions: Based on the results presented in this paper and the companion paper [T. Szczykutowicz and C. Mistretta, “Design of a digital beam attenuation system for computed tomography. Part I. System design and simulation framework,” Med. Phys. 40, 021905 (2013)]10.1118/1.4773879, FFMCT implemented via the DBA device seems feasible and should result in both a dose reduction and an improvement in image quality as judged by noise uniformity and scatter reduction. In addition, the dynamic range reduction achievable using the DBA may allow photon counting imaging to become a clinical reality. This study may allow for yet another step to be taken in the field of patient specific dose modulation.
Keywords: dose modulation, fluence field modulation
INTRODUCTION
The trend in CT dose reduction systems using hardware modifications has been to allow for patient specific image acquisition.2, 3, 4, 5, 6 The imaging energy, bowtie filter size, and mA modulation all take into account changes in patient attenuation. In Part I (Ref. 1) of this paper, the concept of digital beam attenuation (DBA) (Ref. 7) was introduced and a study of filter material was presented. This concept enables a new level of patient specific dose modulation that, to our knowledge, is not possible using any other imaging system for conventional and c-arm based CT. While some results have been presented using inverse geometry CT in which fluence modulation (FM) within the fan beam is possible,8, 9 this geometry marks a radical shift from the current geometry used in conventional and c-arm CT imaging today. These inverse geometry techniques have been referred to as “virtual bowties” and essentially provide a similar modulation of x-ray fluence over the fan angle. The major difference, other than the scanner geometry, is the nature of the modulation. The approach presented here relies on attenuation of the x-ray fluence, while virtual bowtie filters actually modulate the x-ray fluence itself. The DBA, as implemented in this paper, could be added to existing CT scanners with modification to the collimator assembly.
Of emerging interest in the x-ray CT community is volume of interest (VOI) imaging.10, 11, 12, 13, 14 In VOI, regions within a patient can be prescribed different levels of SNR. In the literature, there are two different approaches to VOI. Bartolac et al.12, 13, 14 and Heuscher and Noo10, 11 have looked at binary FM (i.e., ensuring the VOI is always irradiated at a higher dose and all other areas receive some lower amount, in such a system there is only two different fluence modulation levels). While Bartolac et al.12, 13, 14 have also considered FM where there are more than two or a continuum of FM levels available. The DBA device described in this paper and the companion paper1 offers the ability to either work in conjunction with x-ray collimators to achieve VOI or to implement VOI alone. DBA-VOI should be able to implement both types of VOI described above. Work in this area with the DBA is ongoing and will be presented in the future.
In this study, the number of DBA wedges was varied and its effect on image quality (dose, scatter, noise uniformity, and detector dynamic range) was evaluated. This paper then considers experimental data taken using an experimental prototype made of ten Fe wedge pairs using a clinical c-arm system. The scatter-to-primary ratio (SPR) and detector dynamic range were determined for this prototype system.
METHODS
Simulation environment
The simulation environment used to perform the wedge number and wedge positioning algorithm analysis was introduced in the companion paper.1 In brief, the environment is composed of a Monte Carlo scatter and dose calculation for each view angle, an analytic forward projection model that incorporates polychromatic x-ray spectra, scatter and beam hardening corrections, and a filtered back projection reconstruction.
Wedge number
As the wedge number increases, one would expect increases in the performance of the DBA relative to a static bowtie or to not using any type of FM. The relationship between the metrics described in Sec. 2B2 and the number of DBA wedges must be well understood due to the difficult engineering required to actuate the wedges. This type of study allows one to avoid employing too many wedges when a fewer number could have been used at a marginal expense in DBA performance. To evaluate the number of wedges effect on DBA performance, the number was set to 3, 5, 7, 9, 11, 15, and 111. Fifteen wedges was considered the maximum number due to engineering constraints. 111 wedges was also simulated for comparison to a highly modulated scan and represents the “ideal” case.
Wedge position algorithm
In this paper, no a priori patient information is assumed. The wedge thicknesses were set based on the previous view angle's detector signal. The wedge positioning algorithm has two adjustable parameters. The first is the desired detector signal (Nq). The second takes into account the fact that some wedge projections (wedgelets) will cover both patient material and air. The contribution of air in the mean signal calculation is much greater than the signal contribution from the patient (i.e., the signal from rays passing for the air will be much much higher on the detector than will any rays passing through patient material). Ideally, the wedge positions would not be set based on any signal due to air. To enable this type of positioning, the second parameter determines what part of the detector signal from each wedgelet is used. In stead of calculating the mean over the entire wedgelet projection on the detector, only the smallest q percent of the max signal for each wedgelet is used. In other words, for each wedgelet the maximum signal is determined and q is used to determine a threshold below which the mean is taken. This affect will not only be present at air/tissue interfaces, but will also be present at tissue interfaces in which the attenuation varies greatly (i.e., at wedge projections containing soft tissue/bone interfaces). The q parameter used here is different than the α proposed by Gies et al.3 In this work, the modulation performed via the DBA is always proportional to signal attenuation which would correspond to an α of 1.0. The q factor takes into account the finite size of each wedge; if the wedges were made thin enough such that a one to one correspondence between wedgelets and detector signals was obtained, the q parameter would not be required.
Experimental setup
For the experimental study, a single phantom was used to assess the performance of the DBA. The phantom was an anthropomorphic thorax phantom (Atom dosimetry verification phantom 706, CIRS Inc., Norfolk, Virginia).
A c-arm (Zeego, Siemens AG, Forchheim Germany) was used to acquire x-ray projections in service mode. Service mode allowed the automatic exposure control to be turned off. The data was acquired at 125 kVp and 3.6 mAs. “Raw” images were taken directly off the scanner before any image postprocessing was performed. Software provided by Siemens was used to convert the “raw” images into a readable data format.
DBA prototype
The DBA prototype is pictured in Fig. 1. The dimensions of the prototype are listed in Table 1. The DBA was positioned just outside the x-ray tube housing and had a SDD of 31.75 cm. As seen in the companion paper,1 DBA performance in terms of dynamic range and “relative” tube loading increases as the DBA is moved closer to the x-ray tube. Without removing any collimator components, 31.75 cm was as close as the DBA could get to the x-ray source. The DBA wedges were made from Fe as this material showed promise based on the results presented in the companion paper.1 The DBA wedges rest on an acrylic baseplate and are each affixed with acrylic guides that run in grooves within the baseplate to keep them from binding on each other. The current prototype design relies on gravity to keep the wedges in place, so additional engineering would have to be employed to make the design capable of being mounted on a rotating gantry.
Figure 1.
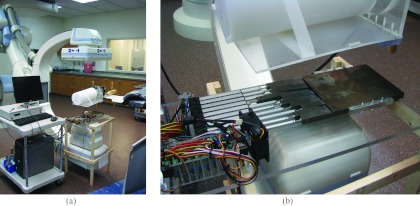
(a) Current experimental prototype setup in a c-arm interventional suite. (b) Zoomed in view of the DBA device.
Table 1.
Dimensions for the prototype.
| Parameter | Value | ||
|---|---|---|---|
| th | 1.5 cm | ||
| tt | 0.13 mm | ||
| l | 17 cm | ||
| lmo | 3.9 cm | ||
| tmin | 3.7 mm1 | ||
| dmax | 10 cm | ||
| w | 1.75 cm |
Assuming only half of the detector in the z-direction is being utilized. If the entire 29.6 cm of the detector is used, tmin = 7.1 mm. These thicknesses represent highly unoptimized configurations. In a clinical implementation, the DBA would be positioned much closer to the x-ray source, making this thickness approximately 1 mm depending on how thin the wedge toe can be constructed (see Ref. 1).
The DBA device and drive system was constructed in house. For each wedge pair, one wedge was held fixed and one was free to move. 10 cm stroke length linear actuators (Model L-12P, Firgelli Technologies Inc., Victoria, BC, Canada) moved the wedges. The linear actuators were coupled with control boards (Model LAC, Firgelli Technologies Inc., Victoria, BC, Canada) provided by the manufacturer and controlled by a 12 channel USB motion controller (12 channel Mini Maestro, Pololu Robotics and Electronics, Las Vegas, NV, USA) which was sent serial commands via MATLAB (MATLAB 7.9.0, The MathWorks Inc., Natick, MA).
It should be noted that while the prototype DBA employs ten wedges, ten wedges was not simulated due to the simulation environment being written only for odd numbers of wedges.
Simulation framework metrics
Dose was calculated using the MC-GPU (Ref. 15) Monte Carlo software package. The dose was calculated for an image volume (256 × 256 × 256 voxels) containing a three-dimensional version of the phantom shown in Fig. 9. Each voxel measured 0.117 cm in the Monte Carlo code. The dose value reported in Sec. 3 are the sum over all voxels within the phantom.
Figure 9.
A comparison of different q values in the wedge positioning algorithm's mean signal calculation. All the signal (q = 1), the lowest 10% (q = 0.1), and the lowest 1% (q = 0.01) of the maximum projection signal for a single wedge were used to calculate the mean signal value for (a)–(c), respectively. Images (d)–(f) respectively show the difference between (a)–(c) and a noiseless reconstruction. Three wedges were simulated in this comparison.
The metric employed to measure noise uniformity is defined as follows: subtract a noiseless reconstruction from the noisy reconstruction to get an image of the noise; divide this image into small ROIs; take the standard deviation of each ROI; take the standard deviation of each ROI's standard deviation to get the “uniformity” in the standard deviation across the image. In the results presented in this study, images reconstructed using 512 × 512 voxels were divided into 36 square ROIs for noise uniformity analysis.
The MC-GPU (Ref. 15) Monte Carlo software package outputs the primary and scatter radiation at the detector plane. To calculate the scatter to primary ratio, the scatter component was divided by the primary component.
To quantify detector dynamic range requirements, the highest detector signal was divided by the lowest. Prior to this calculation, the projection images were convolved with a Gaussian blurring filter to reduce noise.
Experimental metrics
The scatter signal was obtained along a single line on the detector orientated along the fan angle of the x-ray beam and located at a cone angle of 0°. The scatter signal was estimated by acquiring a series of images at smaller and smaller cone beam angles and then extrapolating the detector signal for each detector row down to a cone beam angle size of zero. The cone beam angle was changed using the x-ray collimator.16
For the scatter signal determination and the dynamic range calculation, raw detector access was provided by Siemens (Siemens AG, Healthcare Sector, Erlangen, Germany).
Simulated DBA comparison to flat field and bowtie CT
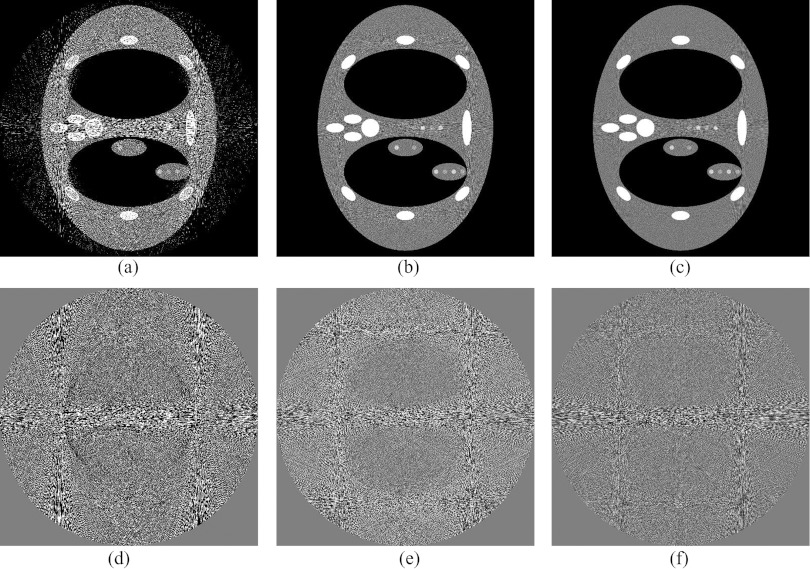
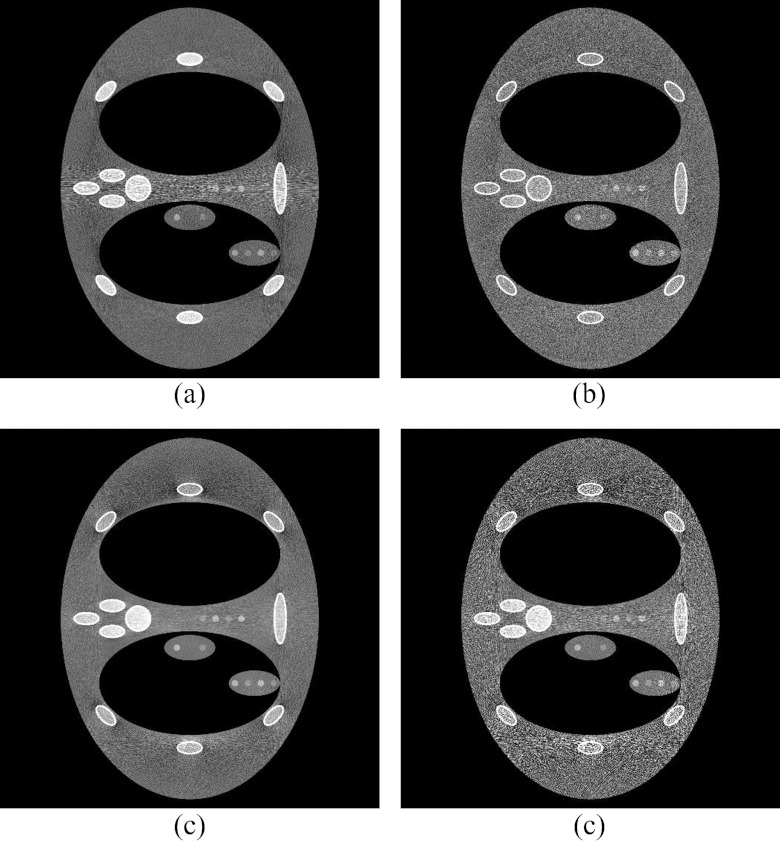
Once results have been presented characterizing the DBA's dependence on wedge number and wedge positioning algorithm parameters, a comparison between the DBA and conventional flat field (unmodulated) CT is warranted. An 11 wedge DBA was compared to flat field CT and CT implemented with a bowtie filter. In both the flat field and bowtie filter cases, no tube current modulation was simulated. A thorax phantom was used that contained four low contrast dots in the mediastinum region at two different contrast levels. The dose level was then adjusted for the three different scans until an equal level of maximum noise variance was obtained in each scan. For the DBA and flat field scans the maximum noise will correspond to the mediastinum region of the phantom. As will be observed in Sec. 3, however, the bowtie filter scan exhibited maximum noise between the ribs. These regions were lateral to the lung fields and near the edges of the phantom. Due to the incident fluence distribution of the bowtie limiting the amount of fluence near the edges of the phantom these regions were underdosed. The bowtie filter for this comparison was simulated to perfectly equalize the detector signal from a cylinder having a diameter equal to the average of the short and long axis of the simulated thorax phantom. Both the bowtie filter and DBA wedges were simulated to be composed of Fe in the simulations.
The dose level was adjusted for the non-DBA flat field acquisition method until the higher of the two contrast level dots became just detectable based on a subjective reading performed by the authors. By using two different contrast levels, the point at which the higher contrast level is just detectable was easy to determine as the lower contrast level dots are still indistinguishable from background noise at this point. This method is subjective, but due to the presence of structured noise and in lieu of a more sophisticated detectability index metric, the human observer results provided a more clinically relevant comparison compared to simple noise variance or CNR measurements. The dose for the DBA and bowtie filter scans was then adjusted until the noise variance corresponding to the mediastinum region matched the non-DBA flat field scan. In the absence of a more complex detectability metric, matching noise variance was assumed to also match dot detectability. An additional dose level was also computed for the bowtie scan since it was found that while the bowtie could provide adequate noise variance in the mediastinum, the image noise near the periphery of the phantom between the ribs was higher than in the mediastinum. Therefore, a second dose level image was generated for the bowtie scan in which the maximum noise in the image matched the noise in the mediastinum of the flat field scan.
RESULTS AND DISCUSSION
Simulation environment results
Effect of wedge number
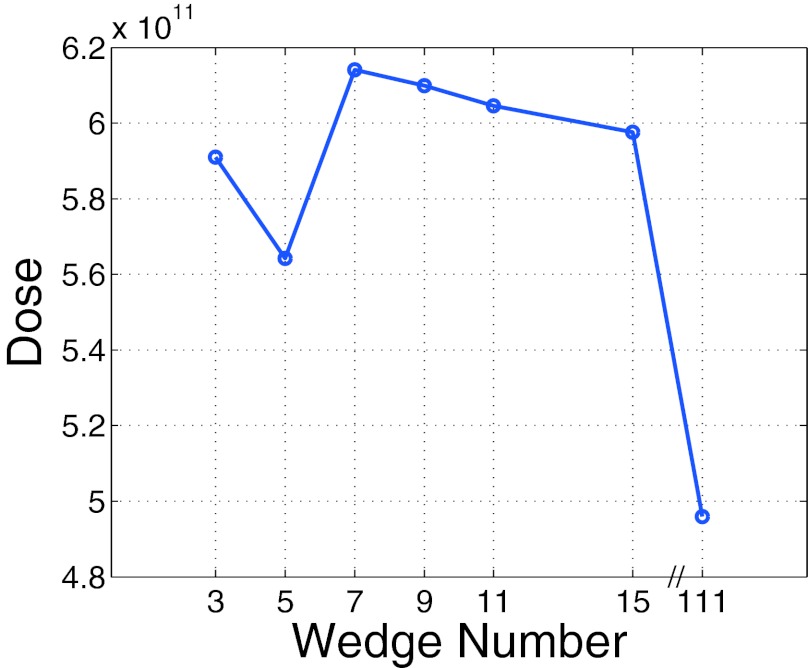
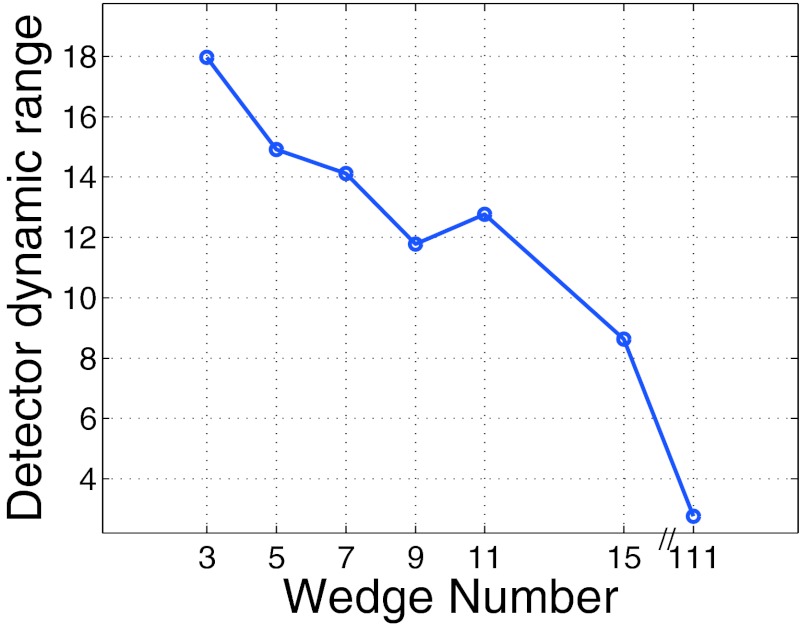
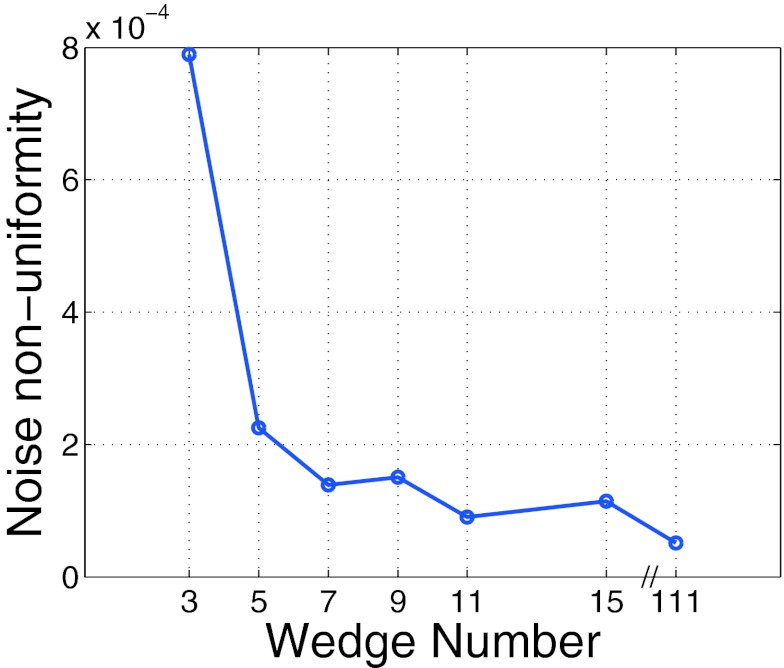
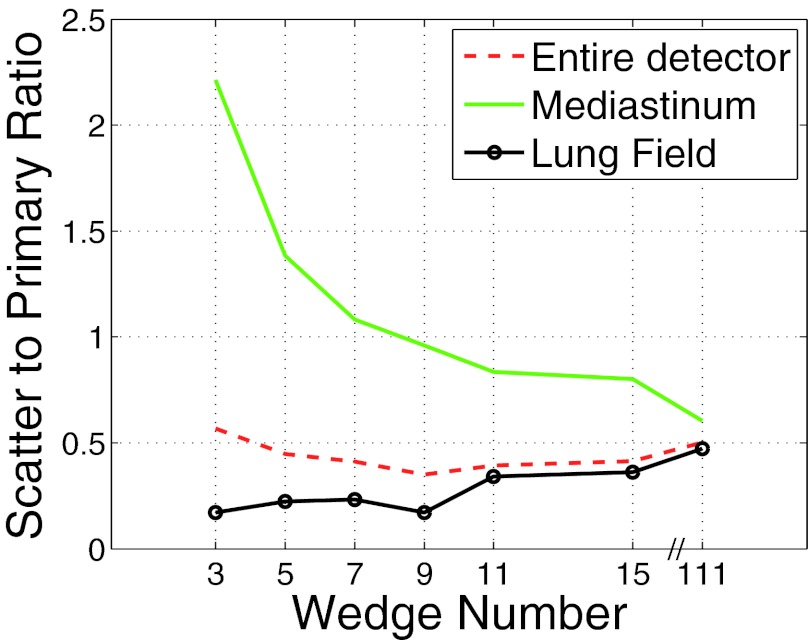
Figures 2345 plot the dose, SPR, noise uniformity, and detector dynamic range as a function of wedge number, respectively. The results presented in Figs. 2345 were obtained at a fixed q value of 5% (q = 0.05) and at a Nq value of 15 000 a.u.
Figure 2.
Total dose to phantom (sum of voxel dose over phantom) as a function of wedge number. The dose does not monotonically decrease as a function of wedge number due to the presence of scatter radiation as described in the text.
Figure 3.
Detector dynamic range as a function of wedge number.
Figure 4.
Noise uniformity as a function of wedge number.
Figure 5.
Scatter to primary ratio as a function of wedge number. The SPR was measured over three different regions for an AP projection. The three regions represent: (a) the entire detector, (b) the detector under the mediastinum, and (c) the detector under the lung fields.
In theory, the dose should decrease as a function of wedge number as just enough dose is delivered per wedgelet to obtain the desired image quality. However, the relationship between wedge number and dose is not this simple due to the presence of scatter radiation. The wedge positioning algorithm cannot tell the difference between scatter radiation and primary radiation. As Fig. 2 depicts, the dose for the three and five wedges is lower than the dose for 7–15 wedges. Since the lower wedge number cases must overdose some areas of the phantom and therefore generate more scatter than do the higher wedge number cases, the wedge position algorithm sets the wedge thicknesses higher for the lower wedge number cases (the presence of scatter increases wedge thickness as it makes the wedgelet mimic a more lightly attenuating patient anatomy). This effect in turn makes the dose decrease. As the wedge number increases, this savings in dose is reduced as the scatter decreases and the wedges enable lightly attenuating regions of the phantom to not get overdosed. Overdosing a region will also produce excess scattered radiation.
The detector dynamic range results presented in Fig. 3 are intuitive. As the number of wedges increases the ability to compensate for the changes in patient anatomy increases and therefore the detector dynamic range decreases.
The noise nonuniformity metric is plotted in Fig. 4. As can be appreciated from the figure, after ≈7 wedges, the gains in noise nonuniformity level off.
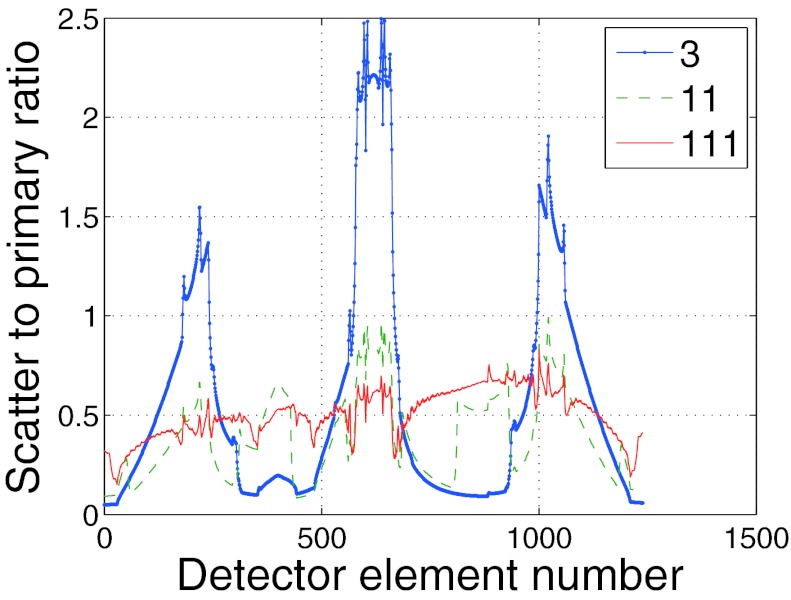
Figure 5 depicts the SPR for over three different regions of the phantom from an anterior-posterior projection. In order to better understand the SPR results presented in Fig. 5, Fig. 6 depicts the SPR as a function of detector position for three different wedge numbers corresponding to the view angle used to plot Fig. 5. From Fig. 6 it is apparent that while a higher number of wedges enables a more uniform scatter profile, it is possible that the SPR can still be larger than lower wedge number cases in some regions. This effect is due to, the fact that for some rays, the primary signal is reduced relatively more than the scatter signal causing the SPR to increase. For the phantom used in the present study, large amounts of scattered radiation are created in the lung fields and travel to the detector over the mediastinum. For the 3 wedge case, since the dose to the lungs was higher relative to the 111 wedge case, the amount of scattered radiation to the mediastinum was also higher and this explains why the SPR was so much higher for three wedges compared to 111. Over the lung fields, the 111 case used a much smaller dose relative to the 3 wedge case which accounts for the fact that even while the 3 wedge case had a higher scatter signal over the lung fields, the primary radiation making it through the lung field more than compensated for the increased scatter and resulted in a lower SPR relative to the 111 wedge case.
Figure 6.
Comparison of three different SPR plots as a function of detector position along the fan beam (corresponding to an AP projection in the phantom).
Effect of adjusting the wedge position algorithm
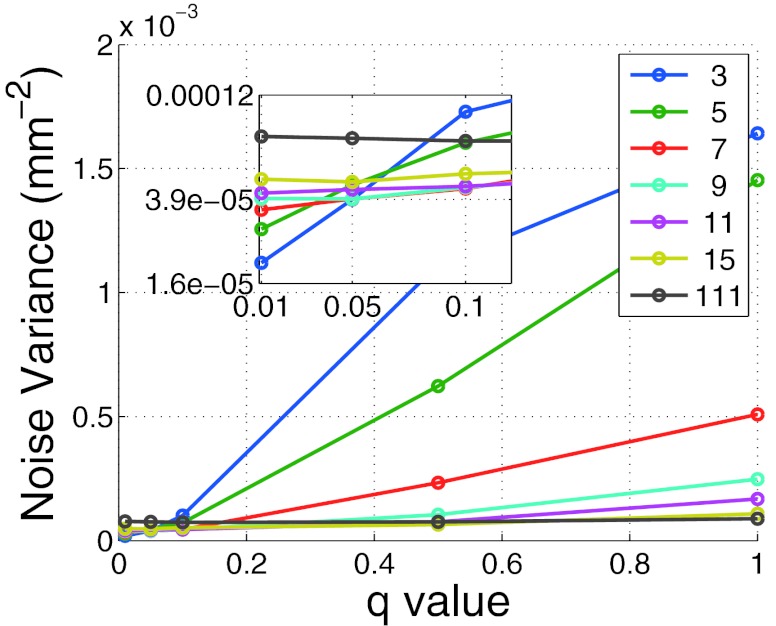
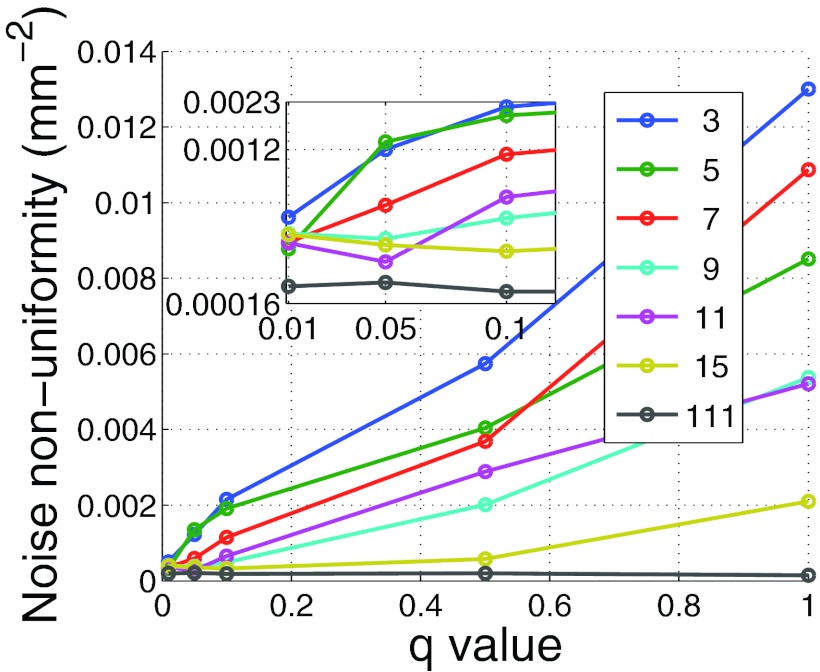
Before comparing the DBA to bowtie filtration or to flat field CT, the effect of q and Nq on image quality must be examined. Figure 7 depicts the noise variance in the mediastinum region for the phantom shown in Fig. 9 as a function of nDBA and q. Figure 8 depicts the noise nonuniformity metric value as a function of nDBA and q as well. It can be observed that both the q parameter and nDBA effect the noise variance and noise uniformity in a similar manner. A low q and nDBA can yield similar noise variance performance as a higher q and nDBA. The noise uniformity as seen in Fig. 8 clearly shows that the noise uniformity increases with wedge number as expected for a fixed q. The noise uniformity decreases as q increases because as q increases, more and more rays in a wedgelet are under dosed. The relation between image variance and dose can be approximated by σ2∝1/Dose. If one considers the difference in noise variance caused by a slight decrease in dose and a slight increase in dose, the slight decrease in dose will always yield the greater change in noise variance as |1/(Dose − a) − 1/(Dose)| > |1/(Dose + a) − 1/(Dose)|. Therefore under dosing regions causes a larger noise nonuniformity than over dosing. This effect can be observed in Fig. 9 in which larger variations in noise are visible for higher q values. It should be noted that the results presented in Fig. 8 do not represent the same data used in Fig. 4 as the Monte Carlo scatter and dose calculation were turned off. These features were turned off due to the additional computation time they add to the simulation.
Figure 7.
Noise variance in the mediastinum as a function of q and nDBA.
Figure 8.
Noise nonuniformity metric as a function of wedge number and q. These results were calculated with the scatter and dose calculations features of the Monte Carlo code off to save computation time and therefore do not represent the same data used to generate Fig. 4.
At a low q value, low nDBA images resulted in a lower noise variance since the imaging dose will be set for a small, highly attenuating region of the wedgelet, meaning all other regions in the wedgelet received too much dose. In other words, when a low number of wedges is used but the dose through each wedge is set to the most attenuating part of the wedglet, large portions of the wedgelet get overdosed. The higher nDBA, the lower the noise variance dependence on q. This observation is simple to understand since in the limit that the wedges becomes infinitely small, the wedgelets become infinitely small and the mean signal over an entire wedgelet becomes equal to the smallest q percent of the maximum signal over a wedgelet.
The results presented in Fig. 8 show that for a given q value, one is not guaranteed that more wedges will always provide more noise uniformity. This observation is counterintuitive. We found this discrepancy to be due to the dependence of the noise uniformity metric on ROI number. Changing this ROI number was found to cause the curves presented in Fig. 8 to fluctuate enough to cross each other. However, as these fluctuations are due to our metric, which is only a surrogate for noise uniformity, the general observations that noise uniformity increases with nDBA and decreases with increasing q still hold.
DBA to flat field comparison
Figure 10 depicts the results of the DBA, flat field CT, and bowtie filtered CT scan comparison. The 11 wedge scan was 2.77 times lower dose than the flat field scan with an equal maximum noise. The lower and higher dose bowtie scans were 5.04 and 1.65 times lower than the flat field scan, respectively. Two different bowtie filter dose levels were included to make it clear why uniform image noise is important. Figures 10a, 10b, 10c all have the same maximum noise. Figure 10d matches the 11 wedge case [Fig. 10b] noise in the mediastinum, but not around the ribs lateral to the lungs. To obtain the similar peak noise variance as the 11 wedge case, the bowtie result had to increase the dose level as is seen in Fig. 10c. Based on these results, the DBA is capable of outperforming standard flat field and bowtie imaging by a factor of roughly 3 and 2 times, respectively, in terms of dose reduction.
Figure 10.
A comparison between (a) flat field CT (no bowtie filter), (b) an 11 wedge DBA scan [2.77 times lower dose relative to (a)], (c) a bowtie filter CT [1.65 times lower dose relative to (a)], and (d) another bowtie acquisition at a lower dose level [5.04 times lower dose relative to (a)]. The low contrast dot detectability was matched for (a and b) and (d). The peak noise variance in between the ribs lateral to the lungs was matched for (b) and (c).
Experimental results
Scatter
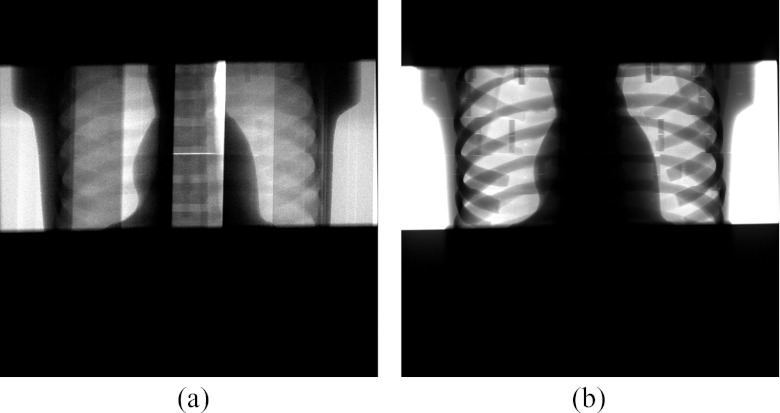
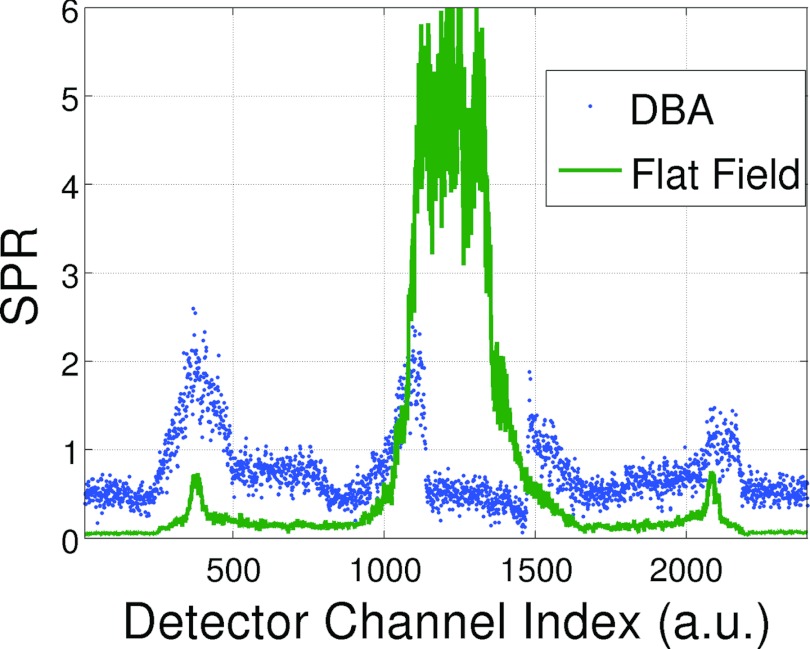
SPR measurements were taken for the single CT projection acquisitions shown in Fig. 11. Figure 12 plots the SPR as a function of detector position for a flat field and an equalized DBA scan. The more uniform SPR of the DBA acquisition over the flat field acquisition is clearly evident. In addition, the SPR ratio over the mediastinum region is reduced by roughly 4 times. In the detector regions not corresponding to the mediastinum, the SPR of the DBA scan was elevated compared to the flat field scan. This observation is due to two factors: the DBA (1) decreases primary fluence to areas outside of the mediastinum; and (2) increases fluence to the mediastinum which produces more scatter in the mediastinum region that will travel to areas outside of the mediastinum. In addition, an increase in off-focal scatter radiation due to the presence of the DBA device (and support structure, in this case a 1.27 cm plexiglass sheet) will also cause an increase in scatter. The magnitude and form of this DBA induced off-focal scatter remains to be measured.
Figure 11.
Experimental projections images acquired using the (a) 10 wedge DBA prototype and (b) flat field acquisition. The images have been windowed and leveled separately. The phantom used for these images is not solid, but is actually composed of cross-sectional pieces which, if not fit together perfectly, can produce a horizontal bright line as is visible in the DBA image. The vertical lines in the DBA image are the junctions between DBA wedges.
Figure 12.
Plots of the experimental SPR for the scans shown in Fig. 11.
Detector dynamic range
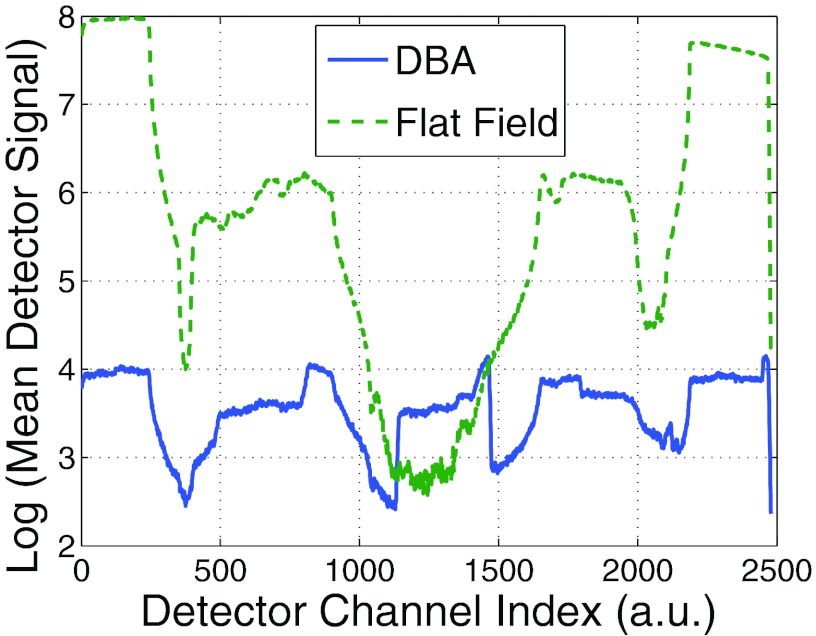
Figure 13 plots the average detector signal across the fan angle for the images shown in Fig. 11. The dynamic range for the flat field and DBA scans were 84.2 and 3.7, respectively. This dynamic range reduction could enable the same positive effects observed by Mail et al.6 at the skin line and allows for advances in photon counting CT as will be discussed in Sec. 5.
Figure 13.
A plot of the log of the detector signal as a function of detector position for an experimental 10 wedge DBA prototype (solid) and flat field (dashed) acquisition.
The 3.7 dynamic range for the 10 wedge DBA does not agree well with the simulated result of 12.8 presented in Fig. 3. However, the phantom used in the simulations was 20 by 28 cm and the experimental phantom was 14 by 20 cm. If one assumes the dynamic range to change as a function of this 6 cm of tissue attenuation difference (e.g., the difference between the anterior-posterior axis lengths of the simulated and experimental thorax phantoms), the results become comparable. 6 cm of soft tissue at 60 keV would attenuate the beam by a factor of 0.27. Using this factor to scale the simulated dynamic range yields a dynamic range of 3.5.
CONCLUSIONS
Based on the results presented in this paper and the companion paper,1 fluence field modulated CT (FFMCT) implemented via the DBA device seems feasible and should result in a dose reduction and improvement in image quality as judged by noise uniformity and scatter reduction. The results presented here also suggest that the best DBA performance is realized when the number of DBA wedges is maximized. The prototype in this paper was limited by the size of the actuators. For our prototype, the actuators were only 0.5 mm smaller than the wedges, making the addition of more DBA wedges for the same space impossible with the current design. However, it is important to understand that the gains in dose, noise uniformity, and SPR all exhibited a relatively slow rate of change after roughly seven wedges. The detector dynamic range did, however, decrease roughly constantly with wedge number. These results will hopefully guide further prototyping development.
One aspect of the study that needs to be investigated further is the addition of phantoms representing different body regions. It may be that the conclusions made from the results presented in this study are only valid for the thorax phantom simulated in this work. Investigation is ongoing to evaluate different phantom sizes and body regions.
It can be expected that the performance of the DBA will depend on the object being imaged, just as is the case for mA modulation.3 However, the dependence on the imaging object should have less of an effect on DBA performance than on mA modulation performance. This characteristic is present because while a patient can present a relatively uniform amount of attenuation as a function of view angle (e.g., any cylindrical cross section of the body), it is not possible for a patient to present an attenuation profile that is constant over the fan angle for every view angle. In other words, DBA performance should always be equal to or greater than that of an optimized static bowtie filter mA modulated scan.
FUTURE DIRECTIONS
Filtering the imaging spectrum has many consequences other than modulating the photon fluence; beam hardening caused by the DBA will have to be studied in future works. While metrics such as noise, scatter, and dose were used to evaluate DBA performance in this paper, future works must also include changes in contrast due to changes in the imaging spectrum. Comparisons with non-FFMCT must be made carefully, ensuring that each scan is optimized with respect to kVp and that the optimization criteria are clearly explained. Another consequence of filtering the beam with the DBA is a potential increase in off focal radiation due to scatter from the DBA wedges. This effect could be quite challenging to deal with if the magnitude since the scatter profile is a function of the wedge positions. The incorporation of a more complex wedge positioning algorithms similar to Sperl et al.8 is also being considered for future work. In addition, volume of interest (VOI) imaging10, 11 is being looked at as a possible candidate for use with the DBA since the DBA would easily allow for VOI imaging both when the VOI was located at isocenter and when the VOI is located off isocenter and in addition would allow for region specific SNR prescriptions as Bartolac et al.12, 13, 14 suggest. The DBA may also fill the requirements for photon counting CT. In a special report to Radiology17 on reducing CT dose to the sub mSv level, one of the methods purposed was photon counting CT. To enable this method, the authors of the report listed four hurdles yet to be passed. One of these hurdles (“rather, dynamic filtrations/collimation of the beam across the field of view will be required to reduce the high fluence rate outside of the object”) could potentially be cleared using the DBA.
ACKNOWLEDGMENTS
This work is supported by a National Institutes of Health (NIH) training (Grant No. 5T32CA009206-33) and a grant from Siemens Medical Systems. The authors would also like to thank Nick Bevins, Joe Zambelli, and Gary Frank for their advice concerning prototyping and machine shop skills; and Kevin Royalty for assisting in raw data access and training on the Zeego.
References
- Szczykutowicz T. and Mistretta C., “Design of a digital beam attenuation system for computed tomography. Part I. System design and simulation framework,” Med. Phys. 40, 021905 (2013). 10.1118/1.4773879 [DOI] [PMC free article] [PubMed] [Google Scholar]
- Kalender W., Deak P., Kellermeier M., van Straten M., and Vollmar S., “Application-and patient size-dependent optimization of x-ray spectra for CT,” Med. Phys. 36, 993–1007 (2009). 10.1118/1.3075901 [DOI] [PubMed] [Google Scholar]
- Gies M., Kalender W., Wolf H., Suess C., and Madsen M., “Dose reduction in CT by anatomically adapted tube current modulation. I. simulation studies,” Med. Phys. 26, 2235–2247 (1999). 10.1118/1.598779 [DOI] [PubMed] [Google Scholar]
- Kalender W., Wolf H., and Suess C., “Dose reduction in CT by anatomically adapted tube current modulation. II. Phantom measurements,” Med. Phys. 26, 2248–2253 (1999). 10.1118/1.598738 [DOI] [PubMed] [Google Scholar]
- McCollough C., Bruesewitz M., and Kofler J., “CT dose reduction and dose management tools: Overview of available options1,” Radiographics 26(2), 503–512 (2006). 10.1148/rg.262055138 [DOI] [PubMed] [Google Scholar]
- Mail N., Moseley D., Siewerdsen J., and Jaffray D., “The influence of bowtie filtration on cone-beam CT image quality,” Med. Phys. 36, 22–32 (2009). 10.1118/1.3017470 [DOI] [PubMed] [Google Scholar]
- Szczykutowicz T. and Mistretta C., “Practical considerations for intensity modulated CT,” Proc. SPIE 8313, 83134E (2012). 10.1117/12.911355 [DOI] [Google Scholar]
- Sperl J., Beque D., Claus B., De Man B., Senzig B., and Brokate M., “Computer-assisted scan protocol and reconstruction (caspar) reduction of image noise and patient dose,” IEEE Trans. Med. Imaging 29(3), 724–732 (2010). 10.1109/TMI.2009.2034515 [DOI] [PubMed] [Google Scholar]
- Burion S., Sandman A., Bechtel K., Solomon E., and Funk T., “X-ray dose reduction by adaptive source equalization and electronic region-of-interest control,” Proc. SPIE 7961, 79612B-1–79612B-6 (2011). 10.1117/12.877250 [DOI] [Google Scholar]
- Heuscher D. and Noo F., “CT dose reduction using dynamic collimation,” in Nuclear Science Symposium and Medical Imaging Conference (NSS/MIC), 2011 IEEE, Valencia (IEEE, New York, NY, 2011), pp. 3470–3473.
- Heuscher D. and Noo F., “CT dose reduction using dynamic collimation,” in The Second International Conference on Image Formation in X-ray Computed Tomography, 2012 (Utah Center for Advanced Imaging Research, Salt Lake City, 2012) pp. 115–118.
- Bartolac S., Graham S., Siewerdsen J., and Jaffray D., “Fluence field optimization for noise and dose objectives in CT,” Med. Phys. 38, S2–S17 (2011). 10.1118/1.3574885 [DOI] [PubMed] [Google Scholar]
- Bartolac S., Graham S., Siewerdsen J., and Jaffray D., “Compensator approaches for intensity modulated computed tomography,” in International Conference on Image Formation in X-ray Computed Tomography (Utah Center for Advanced Imaging Research, Salt Lake City, 2010), p. 101.
- Bartolac S. and Jaffray D., “Fluence field modulated computed tomography,” in International Conference on Image Formation in X-ray Computed Tomography (Utah Center for Advanced Imaging Research, Salt Lake City, 2012), pp. 119–122.
- Badal A. and Badano A., “Accelerating monte carlo simulations of photon transport in a voxelized geometry using a massively parallel graphics processing unit,” Med. Phys. 36, 4878–4880 (2009). 10.1118/1.3231824 [DOI] [PubMed] [Google Scholar]
- Graham S., Moseley D., Siewerdsen J., and Jaffray D., “Compensators for dose and scatter management in cone-beam computed tomography,” Med. Phys. 34, 2691–2703 (2007). 10.1118/1.2740466 [DOI] [PubMed] [Google Scholar]
- McCollough C., Chen G., Kalender W., Leng S., Samei E., Taguchi K., Wang G., Yu L., and Pettigrew R., “Achieving routine submillisievert CT scanning: Report from the summit on management of radiation dose in CT,” Radiology 264(2), 567–580 (2012). 10.1148/radiol.12112265 [DOI] [PMC free article] [PubMed] [Google Scholar]


