

Abstract
Purpose: The purpose of this work is to introduce a new device that allows for patient-specific imaging-dose modulation in conventional and cone-beam CT. The device is called a digital beam attenuator (DBA). The DBA modulates an x-ray beam by varying the attenuation of a set of attenuating wedge filters across the fan angle. The ability to modulate the imaging dose across the fan beam represents another stride in the direction of personalized medicine. With the DBA, imaging dose can be tailored for a given patient anatomy, or even tailored to provide signal-to-noise ratio enhancement within a region of interest. This modulation enables decreases in: dose, scatter, detector dynamic range requirements, and noise nonuniformities. In addition to introducing the DBA, the simulation framework used to study the DBA under different configurations is presented. Finally, a detailed study on the choice of the material used to build the DBA is presented.
Methods: To change the attenuator thickness, the authors propose to use an overlapping wedge design. In this design, for each wedge pair, one wedge is held stationary and another wedge is moved over the stationary wedge. The composite thickness of the two wedges changes as a function of the amount of overlap between the wedges. To validate the DBA concept and study design changes, a simulation environment was constructed. The environment allows for changes to system geometry, different source spectra, DBA wedge design modifications, and supports both voxelized and analytic phantom models. A study of all the elements from atomic number 1 to 92 were evaluated for use as DBA filter material. The amount of dynamic range and tube loading for each element were calculated for various DBA designs. Tube loading was calculated by comparing the attenuation of the DBA at its minimum attenuation position to a filtered non-DBA acquisition.
Results: The design and parametrization of DBA implemented FFMCT has been introduced. A simulation framework was presented with which DBA-FFMCT, bowtie filter CT acquisitions, and unmodulated CT acquisitions can be simulated. The study on wedge filter design concluded that the ideal filter material should have an atomic number in the range of 21–34. Iron was chosen for an experimental relative-tube-loading measurement and showed that DBA-FFMCT scans could be acquired with negligible increases in tube power demands.
Conclusions: The basic idea of DBA implemented fluence field modulated CT, a simulation framework to verify the concept, and a filter selection study have been presented. The use of a DBA represents another step toward the ultimate in patient specific CT dose delivery as patient dose can be delivered uniquely as a function of view and fan angle using this device.
Keywords: dose modulation, fluence field modulation, dynamic bowtie
INTRODUCTION
Image formation in CT involves sending a known amount of x-rays through a patient and measuring how many make it out of the patient and reach the detector. The number of photons reaching the detector must provide enough CNR in the final CT image such that it is of clinical value. If the composition of the human body were uniform and cylindrically shaped, it would be easy to ensure enough photons always reach the detector; one could simply use the same exposure setting and the same bowtie filter for all patients for the entire body. The bowtie filter would be constructed such that the detector signal for all rays was equal and sufficient to provide the required CNR in the CT image (this concept could easily be generalized to cone beam CT as well by extending the bowtie filter along the z direction). In reality, this concept does not work perfectly as different body parts have strong variations in attenuation and patient to patient variation must also be taken into account.1 Current state of the art conventional CT scanners have different size bowtie filters that allow for some patient to patient and body region attenuation differences. Any single exposure setting that ensures enough photons reach the detector for all projections must be determined by the most attenuating projection. Due to the exponential nature of attenuation, the exposure level required for very attenuating rays could be orders of magnitude above the required exposure setting for other less attenuating projections. Therefore, no single exposure setting will simultaneously ensure enough photons reach the detector for all rays and minimize the patient imaging dose. This effect is well known in CT imaging and this is why almost all modern CT scanners use some form of x-ray fluence modulation (FM).1, 2
Recent work by Graham et al.3 in cone-beam CT found that scatter and dose could both be lowered by 50% in some cases using such a filter. While these results are very promising, the phantom used in the experiments was circular, making the interpretation of the results difficult for patients that are not circularly symmetric and may not be located directly at isocenter during their CT examination.4 It can be expected that an even further dose and scatter reduction could be achieved if a compensator could adjust its FM in real time. Work in this area has already begun and promising results have been demonstrated by Sperl et al.5 and Bartolac et al.6, 7, 8
In the present study, we are considering CT images that will be read by clinicians for general use; therefore, image quality must be maintained over the entire imaging FOV. This differs from the FFMCT work of Bartolac et al.6, 7, 8 and Heuscher and Noo9, 10 in which subregions inside the FOV were defined and signal-to-ratio (SNR) was boosted inside these regions and lowered outside allowing for an overall dose savings for the patient. Our work is more similar to the work of Sperl et al.5 in this regard. However, the work of Bartolac et al.6, 7, 8 was purely simulation based and our proposed FM method could theoretically be used to implement their methods experimentally.
Before any prototyping is performed, a simulation of the proposed device is warranted to guide the physical construction. In this paper, a simulation framework will be presented that features polychromatic x-ray spectra, Monte Carlo scatter generation, beam hardening and scatter corrections, a filtered-backprojection reconstruction, and a model of the digital beam attenuator (DBA) device. The environment allows for different DBA configurations to be explored, such as varying the number of wedges and the source to wedge distance.
Adding material into the path of the beam prior to the patient will change the beam's quality. This will change the dose distribution within the patient and the contrast of the images generated using the filtered beam. In addition, x-ray tube power ratings may be exceeded if too much beam filtration is used. As the DBA operates by attenuating the beam, a study of the changes to dose distributions, image contrast, and tube loading is warranted. As a starting point, in this paper, the issue of tube loading is addressed for the DBA.
MATERIALS AND METHODS
Introducing the DBA concept
Most CT systems currently employ the use of a bowtie filter. While these filters are commonplace on conventional generation three CT scanners, they are becoming more common on CBCT as well.3, 11 The purpose of a bowtie filter is threefold: (1) to reduce the demands on the detector dynamic range; (2) to reduce the patient scatter arising from the edges of the patient; and (3) to reduce the patient dose.12 The bowtie filter accomplishes these tasks by modulating the incident x-ray fluence such that more x-rays are incident upon very attenuating ray paths and less x-rays are incident upon lightly attenuating ray paths. To first order, most patients can be thought of as elliptical in cross section. An elliptical cross section is more attenuating in the center and lightly attenuating at the periphery. Therefore, a bowtie filter increases in thickness as a function of the absolute distance from its center.
Bowtie filters are effective because they allocate incident x-rays as a function of patient attenuation. Since bowtie filters cannot change their modulation profile as a function of view angle, and almost every clinical imaging application exhibits a substantial change in patient attenuation with view angle, it is natural to hypothesize that a dynamic bowtie filter (i.e., a bowtie filter that is free to change its attenuation profile as a function of time) would perform better than a static bowtie filter.
Figure 1 depicts the DBA concept.13 In this figure, the composite thickness of two wedges is seen to change as a function of how much they overlap each other. When an array of DBA wedges is formed, it is possible to modulate the incident x-ray fluence over the entire fan angle of a CT imaging system as is shown in Fig. 2. The volume defined by all the rays passing through a given wedge pair will be referred to as a wedgelet. The width of each wedgelet at a distance equal to source to DBA distance (SDD) is equal to lmo (see Table 1 for a description of these parameters). The wedges are designed such that a uniform thickness of wedge material is always present over the z direction. The wedges could be pulled further apart than the position shown in Fig. 1, but doing so would cause the wedges to provide more attenuation near the edges of the wedgelet than in the center.
Figure 1.

Depiction of how the composite wedge thickness changes as a function of wedge overlap. (a) The wedge position of minimum overlap. (b) The position of maximum overlap. The gray trapezoid shown over the wedges represents the area irradiated by the x-ray cone beam. The width of the wedgelet at the position of the wedges is equal to lmo. Note: The images have been cropped in width so the entire moving wedge is not visible in either image. The stationary wedge is entirely visible in both images.
Figure 2.

(a) Three-dimensional view of the DBA position with respect to the rest of the imaging system. (b) System geometry of the x-y plane. (c) System geometry of the y-z plane.
Table 1.
A summary of the variables and notations used to parametrize the DBA and imaging system.
| Notation | Description |
|---|---|
| SID | Source to image (detector) distance |
| SDD | Source to DBA distance |
| FOV | Field of view at isocenter |
| U | Width of detector along x-ray fan direction |
| (along wedge modulation direction) | |
| V | Width of detector along x-ray cone direction |
| (along wedge length direction) | |
| nDBA | Number of DBA wedges |
| w | Width of each wedge |
| th | Thickness of wedge at heel (thick end) |
| tt | Thickness of wedge at toe (thin end) |
| l | Length of wedge |
| lmo | Length of minimum overlap1 |
| tmin | Minimum composite wedge thickness |
| tmax | Maximum composite wedge thickness |
| dmax | Maximum wedge travel |
| t | Composite wedge thickness |
| d | Wedge travel distance |
See Fig. 1 for a description of this length. Wedge length and thickness are always cited for the moving wedge, not the stationary wedge.
Figure 3 depicts a DBA consisting of 19 wedge pairs compensating for a numerical phantom as a function of view angle. The phantom in this case is a anthropomorphic chest phantom. For this phantom, no single static bowtie filter could provide the desired modulation for all view angles as shown in Fig. 3.
Figure 3.
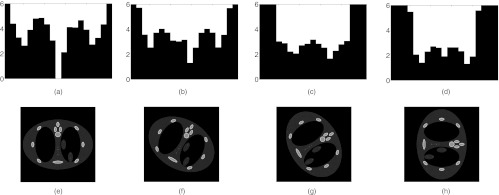
A demonstration of DBA-FFMCT. The top row represents wedge thicknesses (in this case the wedges were made of Fe and a monochromatic 50 keV imaging spectrum was used) required to equalize the detector signal for the phantom images displayed in the bottom row.
Wedge design
The DBA is composed of pairs of wedges, or more precisely, triangular prisms. For each wedge pair, one wedge will remain stationary and the other will move. The stationary wedge can be made smaller than the moving wedge due to this design as is seen in Fig. 1. Each wedge is parametrized by a toe and heel thickness, length, and a width as listed in Table 1. All of these parameters (except the width) effect the amount of soft tissue compensation and relative tube loading using the DBA. Soft tissue compensation refers to the ability of the DBA to provide an equal fluence to the detector for two different cases: (1) the thickest wedge configuration with no patient material; and (2) the thinnest wedge configuration and some amount of soft tissue. This amount of soft tissue is referred to as the soft tissue compensation amount.
Due to the nature of the design, some amount of wedge material will always remain in the imaging beam as shown in Fig. 1. The minimum DBA thickness is the main factor effecting relative tube loading and the amount of soft tissue compensation as will be soon discussed.
Wedge positioning algorithm
Traditional bowtie filters take advantage of the cylindrical approximation of human patients. Gains from using a DBA over existing bowtie filters will come from either: (1) better a priori patient attenuation approximations; or (2) realtime patient attenuation approximations. Accurate a priori patient attenuation estimates can come from low dose prescans as was suggested by Sperl et al.5 or perhaps from scout scans as is currently done in some CT mAs z-axis modulation schemes.1 When the DBA is employed in the c-arm CT setting, in which CT is being used in conjunction with fluoroscopy and complimenting or replacing digital subtraction angiography for interventional procedures,14, 15 patient attenuation information could be extracted from these previously acquired x-ray images. If a prescan were to be performed, it could be made at a very low dose since the information required to set the wedges positions could be derived from the integral over an entire wedgelet. Realtime patient attenuation approximations can be made using predictive algorithms that take advantage of the slowly varying sinogram values of most clinical applications.2 Such an algorithm could also be made to directly respond to detector data in a feedback loop in which wedge thicknesses are set based on previous view angles detector signals. For example, if the detector signal for a given wedgelet is above/below the desired signal, the wedge thickness corresponding to that wedgelet would be increased/decreased.
The choice to position the wedges such that the detector signal is equalized corresponds to an α parameter of 1 using the x-ray fluence modulation framework developed by Gies et al.2, 16 In framework of Gies et al.,2, 16 a given amount of x-ray dose is distributed to each view angle according to a weighting function proportional to the attenuation to the power of α. Gies et al.2, 16 found that an α parameter of 0.5 yielded the best results in terms of minimizing noise and dose. The goal of the work presented here is to increase image noise uniformity, decrease dose, and decrease the generated scatter during a CT imaging acquisition, not to only decrease image noise and dose. Since the goals of this work and that of Gies et al.2, 16 differ and the work of Gies et al.2, 16 did not include x-ray scatter in their simulation, their results (and α parameter selection) cannot be directly applied to the current work. An α parameter of 1 was chosen to mimic existing static bowtie filters attempts to equalize the detector signal. Further work remains as to what α parameter would yield clinically useful images using a DBA when scatter radiation and clinical tasks are taken into account.
Wedge actuation requirements
In the clinical setting, the stroke length of the wedges will be limited by the size of the collimator housing for c-arm CT and by the size of the gantry housing for conventional CT. In the prototype, we present in the companion paper,17 a stroke length of 10 cm was used. Any means to actuate the DBA wedges must be capable of such a translation magnitude. In addition to magnitude, the wedge actuation system must either provide for: (1) a means to monitor the wedge position in time; (2) assurance that the actuation system can accurately and precisely move a wedge to a desired location (i.e., no actuation system independent wedge translation feedback would be required); or (3) a combination of (1) and (2). Knowledge of the wedge position in time will be required in order to demodulate (i.e., normalize) the projection data for CT image reconstruction.
Wedge velocity requirements
An approximation on the upper limit for wedge velocity can be calculated assuming a given wedge must translate from its minimum thickness to maximum thickness position within one quarter of the gantry rotation. This assumption applies to elliptically shaped patients. Essentially, central wedges would be compensating for the changes in the minor and major axis of the patient and the periphery wedges for the changing location of the patient skin line assuming the patient was located at isocenter.
An approximate upper limit for wedge velocity can be calculated as
| (1) |
where T is the gantry rotation time. An evaluation of this equation is presented in the results section assuming a dmax of 10 cm and gantry rotation times ranging from 0.25 to 5 s to cover both conventional CT and c-arm CT applications.
Presenting the simulation environment
Polychromatic spectra and beam hardening correction
Polychromatic x-ray sources were simulated using the Spektr (Ref. 18) software tool kit. This tool kit is based on the TASMIP algorithm developed by Boone and Seibert.19 In all simulations, 2.5 mm of Aluminium filtration was added to the beam on top of whatever DBA wedge material may or may not have been present. This filtration represents the x-ray tube housing assembly.
Different materials common to the human body and for wedge construction were used to construct a numerical phantom and to simulate the DBA wedge. The materials included lung, soft tissue, water, cortical bone, and all elements with atomic number from 1 to 92. The energy specific attenuation values and mass densities for these materials were obtained from NIST (Ref. 20) databases. The anthropomorphic phantom pictured in Fig. 3 was constructed using ellipsoids and the DBA wedges using a cuboid model. Each of these shapes can be numerically modeled and allowed for the projection data to be analytically calculated. For the Monte Carlo scatter and dose calculations, which will be described later, a voxelized phantom was required and was constructed using an image volume generated from the analytically calculated projections.
A water correction scheme was used to correct for beam hardening artifacts. For each ray, assuming the only materials in the beam are water and the wedge material, the signal on the detector can be given by
| (2) |
lwedge is known a priori since one can simply save the wedge position for each view angle. Therefore, this equation can be solved for lwater as it is the only unknown. The secant type of Newton's method21 was used to solve Eq. 2 for lwater.
lwater was then multiplied by the attenuation coefficient for soft tissue (ICRU-44).22 The soft tissue attenuation value used was that corresponding to the mean energy of the imaging spectrum after traversing through 20 cm of soft tissue.
Figure 4 depicts a DBA acquisition with no beam hardening correction, with correction, and with a modified correction. The modified correction models the patient as 97% water and 3% bone. It was found that this approximation yields a more accurate beam hardening correction as judged by the presence of ring artifacts at the DBA wedge boundaries. This finding was strictly empirical and a more robust beam hardening correction scheme will likely have to be designed to deal with experimental data representing different body regions.
Figure 4.

Comparison of DBA images reconstructed without (a) and with (b) and (c) a beam hardening correction applied. In this example, scatter is not simulated and three wedge pairs were used. In (b), all rays were corrected assuming the path length was all soft tissue. In (c), all rays were corrected assuming the path length was 97% soft tissue and 3% bone. No noise was simulated, the “textured” background present in the images is due to view aliasing.
Scatter generation and correction
In order to calculate x-ray scatter in a manageable amount of time, a Monte Carlo method was used which was written to run on a graphics processor unit (GPU). A program named MC-GPU written by Badal and Badano23 was slightly modified and used in the simulation framework. The modifications included incorporating the presence of the DBA wedges. The code, by default, started primary x-rays with a uniform probability of starting anywhere within a cone beam directed at the detector. The presence of the DBA wedges must modulate this sampling. To do so, the aliasing method developed by Walker24 was used to sample primary photons such that their sampling resulted in a modulation of the incident x-ray fluence consistent with the presence of a set of DBA wedges.
Running the code on a GPU can be thought of as a variance reduction technique, as for the same amount of time, more particles can be simulated reducing the uncertainty of the results. In order to further speed up the computation time, a denoising technique was employed based on the Richardson-Lucy deblurring method.25, 26 This technique assumes some denoised signal can be expressed as the convolution of some virtual scatter signal λ(x) and a Gaussian function G(x) as
| (3) |
where λ(x) is obtained according to the Richardson-Lucy algorithm as
| (4) |
and where p is the noisy Monte Carlo signal. Using this model, the tunable parameters are the number of iterations and the width of the Gaussian function G.
Figure 5 compares simulation run times of 10, 100, 1000, and 10 000 s for a single projection view angle. Figure 5d depicts applying the denoising method to a 10 s run time Monte Carlo scatter calculation and shows how a scatter profile similar to a 10 000 s run are obtained.
Figure 5.

Comparison of scatter profiles at different Monte Carlo simulation times. (a) 10 s run, (b) 100 s run, (c) 1000 s run and (d) 10 s run from (a) denoised and plotted with a 10 000 s run.
For DBA implemented FFMCT, the presence of scatter has been shown to induce severe ring artifacts if no correction scheme is implemented.13 In the current simulation framework, the scatter correction method described by Maltz et al.27 was implemented to estimate the scatter signal. The method described by Maltz et al.27 is iterative. We used five iterations in our implementation. The scatter kernels required for the method were generated using MC-GPU.23 Figure 6 depicts a DBA scan with and without the scatter correction applied.
Figure 6.

(a) DBA scan with Monte Carlo generated scatter signal added to the projection data but with no scatter correction scheme applied. (b) Same as (a) but with a scatter correction scheme applied to the projection data. The ring artifact present in (a) is a result of the scatter signal not being corrected for in the CT normalization procedure (Ref. 13).
System optics and forward projection models
Focal spot blurring was simulated due to the proximity of the DBA wedges to the x-ray anode. Since the DBA wedges are close to the anode and the simulated patient object is not, the focal spot blurring differs between these two objects. Therefore, the system response of the finite focal spot size is a function of the location of the imaging object and no simple projection space filtering can accurately model focal spot blurring. To simulate focal spot blurring, five CT projections were simulated equally spaced along an arc about the ideal source position for a given view angle (keeping the detector location fixed). These five different projections were then averaged to form the focal spot blurred projection for a given view angle. The averaging was performed on the raw detector signal (as opposed to the CT projections themselves) since the CT normalization procedure is not a linear operation.
In order to simulate CT projection data, a numerical phantom was constructed consisting of elliptical objects arranged to mimic a human thorax. The wedges were modeled as rectangular prisms. Analytically exact intersection lengths were calculated for both the elliptical and rectangular prism models for each source to detector element ray. Each detector element was only sampled once.
The beam hardening and scatter corrections were applied to both DBA and non-DBA projection data sets before reconstruction using filtered backprojection12 with a Ram-Lak filtering kernel.
Dose calculation
Fortunately, the MC-GPU (Ref. 23) Monte Carlo code used to simulate the x-ray scatter also computes the dose delivered to each voxel. The code does not, however, currently simulate the transport of secondary electrons (from pair production and bremsstrahlung). This makes the dose calculation inaccurate for high energies and near material interfaces and small voxels.28 The code uses the KERMA approximation and therefore deposits all electron energy where the electrons are created. Since the simulations, in this application of the code, are performed at energies of 150 keV or below (CT diagnostic energy range), and the effective range of secondary bremsstrahlung electrons at 150 keV (assuming all of the x-ray energy is given to the electron which is not likely) in water is only 0.28 mm,29 not modeling the transport of such electrons should not effect the results as they are presented here.
DBA filter selection and tube loading concerns
Relative tube loading concerns
Tube loading is a concern due to the logistics of implementing fluence modulation via the DBA concept. As the wedges cannot pull completely out of the beam without a nonuniform z direction modulation, a minimum amount of wedge material (tmin) will be present in the beam. tmin can be derived by inserting the maximum wedge translation amount into an expression for the wedge composite thickness as a function of translation distance (i.e., the wedge composite thickness decreases as the wedges pull apart). If the maximum wedge composite thickness is given by the toe (tt) plus heel (th) thickness, the wedge composite thickness as a function of wedge translation can be given by
| (5) |
Inserting the maximum translation amount dmax = l − lmo into Eq. 5 for d will yield tmin as
| (6) |
We can also write the minimum thickness in terms of SID, SDD, and V as
| (7) |
Here, the relation was used. This expression simply projects the width of the detector in the z dimension into the DBA plane and therefore equals the amount of wedge overlap required to irradiate the entire detector in the z direction.
To calculate relative tube loading, the detector signal obtained without and with a DBA can be compared. The no DBA acquisition assumes no bowtie filter is present, but 1 mm of Al and 0.9 mm of Cu filtration are filtering the beam. The 1 mm of Al was chosen to mimic the amount of inherent beam filtration due to the existing x-ray tube and collimator. The 0.9 mm of Cu was chosen to represent the maximum amount of Cu filtration available on a Siemens Zeego (Siemens AG, Healthcare Sector, Erlangen, Germany) system. The Zeego system geometry and filtration specification were used in the simulations because the Zeego system was used to evaluate the DBA experimentally as will be shown later in this and the companion17 paper. DBA acquisitions assumed no tube filtration was in place other than the DBA tmin amount. A set amount of soft tissue can then be simulated and the detector signal for the no DBA case calculated. This amount was simulated to be 35 cm of soft tissue. This soft tissue thickness was chosen to represent an adult body size as it is similar to the standard 32 cm CTDI body phantom size.30 While this thickness does not represent the largest obese patients, who can approach 50 cm, it does represent patients on the large side of what is seen clinically at our institution. Different amounts of soft tissue can then be added to DBA acquisitions and the detector signal compared to the no DBA case. The quantity obtained by dividing the no DBA detector signal by the DBA detector signal reflects the amount of mAs increase required to match the DBA acquisition to the no DBA case. This ratio is referred to as the tube loading ratio.
Tube loading and filter selection simulation details
A polychromatic spectrum (Φ(E)) was generated as a function of energy (E) using the Spektr toolkit18 at 100 kVp with 2.5 mm of inherent Al filtration. This tool kit is based on the TASMIP algorithm developed by Boone and Seibert.19 The spectrum was binned into 150 bins from 1 to 150 keV. An energy integrating detector with an absorption efficiency of 100% for all energies was simulated. Linear attenuation coefficients and densities were obtained from the NIST (Ref. 20) database for both elemental compounds and ICRU-44 (Ref. 22) human mimicking tissues.
The relative tube loading was calculated as
| (8) |
This expression for relative tube loading essentially represents the detector signal one would measure with a large patient divided by the detector signal one would measure with the DBA for a given soft tissue thickness. In this paper, the tube loading factor is plotted as the mAs increase factor since changes in mAs should scale linearly with detector signal which is not the case for kVp. The total wedge translation, dmax, is assumed to be kept constant for the calculations presented in Fig. 8.
The material selection study was carried out in two steps. In step one, an analysis was performed over all elements from Hydrogen to Uranium and an approximate level of the loading and wedge thickness was calculated. This allowed for excessive tube loadings and extremely small or large wedge materials to be rejected. Following this analysis, a more detailed study was carried out on a subset of elements that showed promise for use in the DBA based on their tube loading and thickness.
In the preliminary elemental search, the amount of soft tissue and tt were fixed, and the resulting th and tube loading were calculated. Equation 9 was minimized as a function of th for system configurations A and B, a tt value of 1 mm, and soft tissue thicknesses of 20 and 35 cm. This allowed for elements that require an excessively high wedge thickness or relative tube loading to be rejected before a more detailed study was performed. Heel plus toe (total thickness) thicknesses over 10 cm and under 1 mm served as the thickness based rejection criteria. Relative tube loading factors (referred to as mAs increase in the results section) over ten times served as the relative tube loading based rejection criteria. Equation 9 is defined as
| (9) |
where the first term represents the detector signal due to some thickness of soft tissue and the minimum DBA thickness and the second term the maximum wedge thickness. A constrained minimization was used and only th values less than 10 cm were allowed.
For a given element, Eq. 9 is first minimized as a function of the heel thickness required to compensate for either 20 or 35 cm of soft tissue. Minimizing Eq. 9 involves evaluating tmin since tmin is a function of th. Therefore, after Eq. 9 is minimized for th, tmin is also determined. tmin is then inserted into Eq. 8 to calculate the relative tube loading. After the preliminary element search, a more detailed study was conducted on only a couple of elements. In this more focused study, tt was varied and 20 and 35 cm of soft tissue thickness were again compensated for and the resulting th and relative tube loading were calculated.
The minimum SDD achievable on the Zeego from the source to the edge of the collimator is 31.75 cm without taking off and/or apart the collimator housing. This distance was therefore used to design the first proof-of-principle prototype. In the second set of simulations, a SDD value of 10 cm was used. This distance is thought to represent a more realistic SDD if the collimator could be designed around the DBA. The collimator housing is roughly 28 cm square. This distance limits l and correspondingly dmax (since dmax = l − lmo). Even though the prototype will be sitting outside of the collimator housing, we still felt that constraining the DBA to fit within the housing would be more realistic and make the further miniaturization of the DBA easier. Table 2 lists the values used for the simulated results. Configuration A refers to the DBA implementation assuming one is limited to a SDD of 31.75 cm and configuration B refers to a SDD of 10 cm. For both configurations, dmax was chosen to be 10 cm as this distance should allow the DBA to fit inside the existing collimator used on the experimental system used to study the DBA in our work.
Table 2.
A summary of the values used in the first set of simulations.
| Parameter | Configuration A | Configuration B |
|---|---|---|
| SID | 120 cm | 120 cm |
| SDD | 31.75 cm | 10 cm |
| U | 19.096 cm | 19.096 cm |
| V | 14.784 cm | 14.784 |
| th | Varied | Varied |
| tt | Varied | Varied |
| l | 13.91 cm | 11.2 cm |
| lmo | 3.91 cm | 1.23 cm |
| tmin | Dependent parameter | Dependent parameter |
| dmax | 10 cm | 10 cm |
| w1 | 7.22 mm | 2.27 cm |
| FOV | 14.78 cm | 14.78 cm |
Assuming nDBA = 8.
Ideally, tt would be set to zero. However, a toe thickness of zero makes manufacturing the wedges quite difficult. A reasonable tt is on the order of 1 mm. In the simulations, we vary the toe thickness from 0 to 1.5 mm. Most design factors work against a small relative tube loading. For example, it would be easier to place the DBA further from the source so as to limit the amount of redesigning of the collimator housing. This change would increase tmin as is seen by Eq. 7. Decreasing the length of the wedges would also facilitate DBA implementation as it would be more compact and the actuation requirement would be easier to implement; however, this too would increase tmin as is seen by Eq. 7. In a similar fashion, increasing the z-axis coverage will also increase tmin since V scales linearly with increases to z coverage.
Experimental measurement of relative tube loading
To assess the tube loading relative to flat field imaging, the same technique factors were used to image 18.7 cm of PMMA with and without the DBA. The scans were performed at 100 kVp and 3.6 mAs. The prototype DBA wedges had a tmin = 1.34 mm of iron and were placed onto a 1.26 cm thick acrylic support base. These prototype wedges have a th, tt, and l of 15 mm, 0.13 mm, and 17 cm, respectively, setup assuming a 10 cm separation from the x-ray source (SDD = 10 cm), making lmo = 1.23 cm. Due to the presence of the DBA's 1.27 cm thick acrylic support base, 1.27 cm of acrylic was also added to the flat field's beam path to make the comparison more fair as this support base does not reflect what a clinical system would likely employ for wedge support. In addition, 0.9 mm of Cu filtration was also added to the flat field's beam path using the Zeego's built in filtering system. The x-ray collimators were adjusted to their smallest setting in both the “height” and “width” directions to reduce x-ray scatter contaminating the measurements. The mean signal in a square region of interest (ROI) was measured for three different scans: (1) flat field scan with 0.9 Cu filtration added; (2) DBA scan with 0.0 Cu filtration; and (3) DBA scan with 0.9 Cu filtration.
RESULTS AND DISCUSSION
Wedge velocity
Figure 7 depicts the wedge velocity as a function of gantry rotation time. Off-the-shelf linear actuators may work fine for c-arm applications, but some engineering work may be required to handle the high velocities required for conventional CT applications. The DBA wedge design itself could also be modified to have both sides of each overlapping wedge pair moving instead of only one side. This change would cut the velocity requirements in half.
Figure 7.

Velocity of wedge assuming dmax = 10 cm as a function of gantry rotation time according to Eq. 1.
Relative tube loading and dynamic range
Narrowing down the element search
To narrow down the selection of wedge materials, we first calculated the wedge thickness and relative tube loading for all elements from Hydrogen to Uranium that yielded the same detector signal as 35 cm of soft tissue using Eq. 9. Figures 89 depict the resulting composite wedge thickness (a sum of th and tt) and the relative tube loading for the two different system geometries given in Table 2. These results served to mainly take noble gases out of consideration based on the thickness rejection criteria. The noble gases have very low densities compared with the other elements and therefore prohibitively large thicknesses of these materials are required. Highly attenuating elements like Uranium that only require ≈1 mm of material to compensate for 35 cm of soft tissue are rejected based on the relative tube loading criteria because of the prohibitively high amount of attenuation due to tmin for these elements.
Figure 8.

(a) For each element, the tmax thickness required to match the attenuation of 20 and 25 cm of soft tissue plus tmin of wedge material is shown. The gaps in the plot represent th values outside of the range [0.1, 10] cm. It can be observed that above Al, most gaps in the plot are due to the noble gases. (b) The amount of tube loading required for each element represented as the increase in mAs required to match the detector signals between DBA and non-DBA scans for the thicknesses shown in (a). The system and wedge geometries listed in Table 2 configuration A were used to make these plots.
Figure 9.

This figure is the same as Fig. 8 but the system and DBA geometry shown in Table 2 configuration B was used.
Detailed analysis of select elements
The excessive tube loading of many of the high atomic number elements, and the excessively high thicknesses required for many of the low atomic number elements (and the noble gases) narrowed the search for a suitable wedge material down to primarily elements 21–34 (Scandium to Selenium). Within this range, Fe and Cu were selected for a more detailed study. These two elements were chosen due to their ease of machinability and availability.
Figures 1011 depict the wedge composite thickness (tt + th) for Fe and Cu required to compensate for 20 and 35 cm of soft tissue as a function of tt. These figures also compare the tube loading for the two metals corresponding to the wedge thicknesses required for 20 and 35 cm of soft tissue compensation. Equation 9 was used to solve for the total wedge thickness for a given soft tissue compensation amount and tt.
Figure 10.

Wedge thickness (composite thickness) and tube loading as a function of toe thickness required to compensate for either 20 or 35 cm of soft tissue for Fe and Cu. These results used the system and DBA dimensions given in Table 2 for configuration A.
Figure 11.

Wedge thickness (composite thickness) and tube loading as a function of toe thickness required to compensate for either 20 or 35 cm of soft tissue for Fe and Cu. These results used the system and DBA dimensions given in Table 2 configuration B.
The results presented in Figs. 1011 suggest that the ideal DBA would be configured such that the toe thickness is as small as possible and the source to DBA distance was also as small as possible. Considering Eq. 7, it can be seen that both of these variables are linearly related to tmin. A small tmin, according to Eq. 8, means a small relative tube loading. It also means that any additional wedge material placed in the beam greater than tmin serves to compensate for soft tissue and not to further increase the relative tube loading. Unfortunately, as tmin increases, the beam hardening increases and more wedge material is required to compensate for soft tissue since the linear attenuation coefficients for most wedge materials decrease monotonically with energy (excluding materials with k-edges within the energy range of the imaging spectrum like Erbium).
Cu exhibits more tube loading than Fe as seen in Figs. 1011. This observation is due to the higher linear attenuation coefficient of Cu relative to Fe. While Fe will have a larger tmin than Cu due to the larger heel thickness required by Fe for the same soft tissue compensation, which suggests Fe will have a higher tube loading, Cu's higher linear attenuation coefficient more than makes up for this difference resulting in Cu having the higher relative tube loading. It is difficult to determine which element is the best choice for implementing the DBA. As shown in the companion paper,17 Fe was chosen to construct a prototype DBA. In a final clinical implementation, two factors out of a myriad of considerations would be size and tube loading. Based on the results presented here, if small thickness was the critical design factor, then Cu would outperform Fe. If tube power were the critical design factor, then Fe would be a better choice. As the engineering problem of how to implement the DBA is solved, results like those presented in this material study will be invaluable in guiding material selection.
Experimental relative tube loading
The ratio of the mean detector signals to the flat field scan were 1.0, 1.1, and 2.6 for the: (1) flat field scan with 0.9 Cu filtration added; (2) DBA scan with 0.0 Cu filtration; and (3) DBA scan with 0.9 Cu filtration, respectively. These results provide experimental evidence that the use of attenuation modulation for FFMCT should be possible with modern x-ray tubes as a mAs increase of ≈1 would be all that is required for a DBA integrated properly into a CT scanner or c-arm system. These results should not be taken to match exactly those of Figure 11 as the imaging spectra, detector energy response, and filtration type and thickness do not exactly match the experimental system used to measure the tube loading. The parameters used in the simulations were assumed to mimic an experimental system and provide a rough estimate of the relationship between material selection and tube loading.
CONCLUSIONS
The basic idea of DBA implemented FFMCT, a simulation framework to verify the concept, and a filter selection study have been presented. The use of a DBA represents another step toward the ultimate in patient specific CT dose delivery as patient dose can be delivered uniquely as a function of view and fan angle using this device.
The relative tube loading results presented here suggest that imaging larger patients may be challenging using the DBA due to tube loading constraints. For these larger patients, it may be that the DBA has to be removed from the beam in order to enable enough photon fluence to reach the patient. In clinical practice, for a fixed wedge shape, the relative tube loading will depend on how close the DBA device can be placed to the x-ray tube anode. As tubes with higher power ratings are becoming available, the imaging protocol for larger patients with a DBA may be the same as that for smaller patients. In addition, the scan time can sometimes be increased for some clinical scans to increase the mAs product as long as the tubes continuous power rating is not exceeded.
The wedge velocity results are promising for c-arm based systems in which the scan times are relatively long, but could pose an engineering challenge for the shorter scan times common to conventional CT systems. However, the results presented in Fig. 7 assumed a dmax of 10 cm and that only one side of the wedges were actuated. If both sides of the wedges were actuated, the velocity requirements are reduced by half. If SDD is reduced (i.e., the DBA is moved closer to the source), l can also be reduced and tmin can remain constant as is seen by considering Eq. 7. The net effect will then be that the minimum and maximum wedge thicknesses are the same but that the difference between lmo and l is reduced. Since dmax = l − lmo, the required stroke length decreases and therefore the velocity requirements for such a configuration are decreased. If the DBA is to be used clinically, these types of engineering/performance trade-offs must be understood.
The use of a DBA for dose modulation can be thought of as moving toward the final step in the evolution of dose modulation systems. All dose modulation systems seek to optimize patient dose based on attenuation and the DBA presented here allows for a previously unavailable degree of freedom in doing so. In the second part17 of this work, the effect of wedge number on image quality and experimental results obtained using the prototype are presented.
ACKNOWLEDGMENTS
This work is supported by National Institutes of Health (NIH) training Grant No. 5T32CA009206-32 and a grant from Siemens Medical Systems. The authors would also like to thank Eric Oberstar, Nick Bevins, Joe Zambelli, and Gary Frank for their advice concerning prototyping and machine shop skills; Kat Lake, Michael Scherer, Ashley Mulchrone, and Clara Chow for selecting the actuators, motor drivers, and motor controller; and Kevin Royalty for assisting in raw data access and training on the Zeego.
References
- McCollough C., Bruesewitz M., and Kofler J., “Ct dose reduction and dose management tools: Overview of available options,” Radiographics 26(2), 503–512 (2006). 10.1148/rg.262055138 [DOI] [PubMed] [Google Scholar]
- Kalender W., Wolf H., and Suess C., “Dose reduction in CT by anatomically adapted tube current modulation. II. Phantom measurements,” Med. Phys. 26, 2248–2253 (1999). 10.1118/1.598738 [DOI] [PubMed] [Google Scholar]
- Graham S., Moseley D., Siewerdsen J., and Jaffray D., “Compensators for dose and scatter management in cone-beam computed tomography,” Med. Phys. 34, 2691–2703 (2007). 10.1118/1.2740466 [DOI] [PubMed] [Google Scholar]
- Toth T., Ge Z., and Daly M., “The influence of patient centering on ct dose and image noise,” Med. Phys. 34, 3093–3101 (2007). 10.1118/1.2748113 [DOI] [PubMed] [Google Scholar]
- Sperl J., Beque D., Claus B., De Man B., Senzig B., and Brokate M., “Computer-assisted scan protocol and reconstruction (caspar) reduction of image noise and patient dose,” IEEE Trans. Med. Imaging 29(3), 724–732 (2010). 10.1109/TMI.2009.2034515 [DOI] [PubMed] [Google Scholar]
- Bartolac S., Graham S., Siewerdsen J., and Jaffray D., “Fluence field optimization for noise and dose objectives in CT,” Med. Phys. 38, S2–S17 (2011). 10.1118/1.3574885 [DOI] [PubMed] [Google Scholar]
- Bartolac S., Graham S., Siewerdsen J., and Jaffray D., “Compensator approaches for intensity modulated computed tomography,” in Proceedings of the International Conference on Image Formation in X-ray Computed Tomography, Salt Lake City (Utah center for advanced imaging research, Salt Lake City, 2010), Vol. 1(1), p. 101.
- Bartolac S. and Jaffray D., “Fluence field modulated computed tomography,” in Proceedings of the International Conference on Image Formation in X-ray Computed Tomography, Salt Lake City (Utah center for advanced imaging research, Salt Lake City, 2012), Vol. 2(2), pp. 119–122.
- Heuscher D. and Noo F., “CT dose reduction using dynamic collimation,” in Proceedings of the 2011 IEEE Nuclear Science Symposium and Medical Imaging Conference (NSS/MIC), Valencia (IEEE, New York, New York, 2011), pp. 3470–3473.
- Heuscher D. J. and Noo F., “CT dose reduction using dynamic collimation,” in Proceedings of the Second International Conference on Image Formation in X-Ray Computed Tomography, Salt Lake City (Utah center for advanced imaging research, Salt Lake City, 2012), pp. 115–118.
- Mail N., Moseley D., Siewerdsen J., and Jaffray D., “The influence of bowtie filtration on cone-beam CT image quality,” Med. Phys. 36, 22–32 (2009). 10.1118/1.3017470 [DOI] [PubMed] [Google Scholar]
- Kalender W., Computed Tomography: Fundamentals, System Technology, Image Quality, Applications (Publicis, Erlangen, 2000), Vol. 1, p. 220. [Google Scholar]
- Szczykutowicz T. and Mistretta C., “Practical considerations for intensity modulated CT,” Proc. SPIE 8313, 83134E-1-83134E-11 (2012). 10.1117/12.911355 [DOI] [Google Scholar]
- Wallace M., Kuo M., Glaiberman C., Binkert C., Orth R., and Soulez G., “Three-dimensional c-arm cone-beam CT: Applications in the interventional suite,” J. Vasc. Interv. Radiol. 19(6), 799–813 (2008). 10.1016/j.jvir.2008.02.018 [DOI] [PubMed] [Google Scholar]
- Kamran M., Nagaraja S., and Byrne J., “C-arm flat detector computed tomography: The technique and its applications in interventional neuro-radiology,” Neuroradiology 52(4), 319–327 (2010). 10.1007/s00234-009-0609-5 [DOI] [PubMed] [Google Scholar]
- Gies M., Kalender W., Wolf H., Suess C., and Madsen M., “Dose reduction in CT by anatomically adapted tube current modulation. I. Simulation studies,” Med. Phys. 26, 2235–2247 (1999). 10.1118/1.598779 [DOI] [PubMed] [Google Scholar]
- Szczykutowicz T. and Mistretta C., “Design of a dynamic beam attenuation system for computed tomography: Part II. Performance study and initial results,” Med. Phys. (submitted). [DOI] [PMC free article] [PubMed]
- Siewerdsen J., Waese A., Moseley D., Richard S., and Jaffray D., “Specktr: A computational tool for x-ray spectral analysis and imaging system optimization,” Med. Phys. 31, 3057–3067 (2004). 10.1118/1.1758350 [DOI] [PubMed] [Google Scholar]
- Boone J. M. and Seibert J. A., “An accurate method for computer-generating tungsten anode x-ray spectra from 30 to 140 KV,” Med. Phys. 24, 1661–1670 (1997). 10.1118/1.597953 [DOI] [PubMed] [Google Scholar]
- Hubbell J. and Seltzer S., “Tables of x-ray mass attenuation coefficients and mass energy-absorption coefficients 1 keV to 20 MeV for elements z = 1 to 92 and 48 additional substances of dosimetric interest,” NIST Technical Report (Ionizing Radiation Division, National Institute of Standards and Technology, Gaithersburg, MD, 1995).
- Burden R. and Faires J., Numerical Analysis (Brooks, Cole Publisher Company, Three Lakes Wisconsin, 1997). [Google Scholar]
- International Commission in Radiation Units and Measurements, “Tissue substitutes in radiation dosimetry and measurement,” ICRU Report No. 44 (ICRU Publications, Bethesda, MD, 1989).
- Badal A. and Badano A., “Accelerating monte carlo simulations of photon transport in a voxelized geometry using a massively parallel graphics processing unit,” Med. Phys. 36, 4878–4880 (2009). 10.1118/1.3231824 [DOI] [PubMed] [Google Scholar]
- Walker A. J., “An efficient method for generating discrete random variables with general distributions,” ACM Trans. Math. Softw. 3, 253–256 (1977). 10.1145/355744.355749 [DOI] [Google Scholar]
- Colijn A. and Beekman F., “Accelerated simulation of cone beam x-ray scatter projections,” IEEE Trans. Med. Imaging 23(5), 584–590 (2004). 10.1109/TMI.2004.825600 [DOI] [PubMed] [Google Scholar]
- Zbijewski W. and Beekman F., “Efficient Monte Carlo based scatter artifact reduction in cone-beam micro-CT,” IEEE Trans. Med. Imaging 25(7), 817–827 (2006). 10.1109/TMI.2006.872328 [DOI] [PubMed] [Google Scholar]
- Maltz J., Gangadharan B., Bose S., Hristov D., Faddegon B., Paidi A., and Bani-Hashemi A., “Algorithm for x-ray scatter, beam-hardening, and beam profile correction in diagnostic (kilovoltage) and treatment (megavoltage) cone beam CT,” IEEE Trans. Med. Imaging 27(12), 1791–1810 (2008). 10.1109/TMI.2008.928922 [DOI] [PubMed] [Google Scholar]
- Badal A. and Badano A., MC-GPU v1.2 Reference Manual available online at https://code.google.com/p/mcgpu/.
- Attix F., “Dosimetry fundamentals,” in Introduction to Radiological Physics and Radiation Dosimetry (Wiley-VCH, Weinheim, Germany, 2007), pp. 264–291. [Google Scholar]
- Shope T., Gagne R., and Johnson G., “A method for describing the doses delivered by transmission x-ray computed tomography,” Med. Phys. 8, 488–495 (1981). 10.1118/1.594995 [DOI] [PubMed] [Google Scholar]