Abstract
Viscoelastic properties of the myocardium are important for normal cardiac function and may be altered by disease. Thus, quantification of these properties may aid with evaluation of the health of the heart. Lamb Wave Dispersion Ultrasound Vibrometry (LDUV) is a shear wave-based method that uses wave velocity dispersion to measure the underlying viscoelastic material properties of soft tissue with plate-like geometries. We tested this method in eight pigs in an open-chest preparation. A mechanical actuator was used to create harmonic, propagating mechanical waves in the myocardial wall. The motion was tracked using a high frame rate acquisition sequence, typically 2500 Hz. The velocities of wave propagation were measured over the 50–400 Hz frequency range in 50 Hz increments. Data were acquired over several cardiac cycles. Dispersion curves were fit with a viscoelastic, anti-symmetric Lamb wave model to obtain estimates of the shear elasticity, μ1, and viscosity, μ2 as defined by the Kelvin-Voigt rheological model. The sensitivity of the Lamb wave model was also studied using simulated data. We demonstrated that wave velocity measurements and Lamb wave theory allow one to estimate the variation of viscoelastic moduli of the myocardial walls in vivo throughout the course of the cardiac cycle.
Introduction
Mechanical properties of the myocardium and ventricular chambers are important for normal filling of the heart with blood during diastole. Alterations within the microenvironment of the myocardial tissue caused by the disease process can change tissue properties and cause dysfunction [1–6]. Thus, direct and noninvasive quantification of tissue viscoelasticity might help with evaluation of the health of the tissue.
Over the last three decades many invasive and noninvasive methods have been developed to measure the fundamental mechanical properties of the heart [6–10]. Tagged magnetic resonance imaging (tMRI) was introduced to measure the three-dimensional motion and deformation (strain) of the heart [11]. Magnetic resonance elastography (MRE) is an elasticity imaging method that uses an external actuator to create propagating shear waves in soft tissues [12]. The shear wave motion is measured using motion encoding gradients and different phase offsets to assess the harmonic magnitude and phase of the shear waves. This method has been used for cardiac applications [13–17]. The group led by Sack examined the shear wave amplitude through the cardiac cycle to find variations between systole and diastole [13, 14]. Kolipaka and colleagues developed a model-based approach to evaluate the stiffness of spherical and plate models and in vivo cardiac tissue [15–17].
Ultrasound imaging has been used extensively to quantify normal and abnormal cardiac motion. Tissue Doppler imaging, strain rate echocardiography, and two-dimensional speckle tracking have demonstrated their usefulness in evaluating functional properties of the heart [18–21]. Strain echocardiography has also been used to estimate local differences in myocardial elasticity (stiffness), for instance, between normal and infarcted tissue [22]. A method called myocardial elastography is an extension of strain imaging applied to the heart [23–25]. This method has been validated against tMRI [25], and has been shown to be angle-independent in the assessment of strain. Another technique called electromechanical wave imaging has emerged to explore the contraction of the heart in a comprehensive manner [26–29]. Kanai proposed a method using the wave motion within the heart to measure the viscoelastic properties of the ventricular septum based on wall vibrations caused by the aortic valve closure [30, 31].
The aforementioned ultrasound-based methods use the endogenous motion of the heart for evaluation. Other ultrasound techniques take an approach similar to that of MRE and use an external force to perturb the tissue and then measure the motion or shear waves that are produced by the external force. Focused ultrasound has also been used to produce acoustic radiation force which can move tissue on the order of tens of microns [32]. This motion can be measured at the point of the force production as in the technique called Acoustic Radiation Force Impulse (ARFI) imaging [32], or the resulting shear wave motion and propagation velocity can be measured as in methods such as Shear Wave Elasticity Imaging (SWEI) [33], Supersonic Shear Imaging (SSI) [34], and Shearwave Dispersion Ultrasound Vibrometry (SDUV) [35, 36].
ARFI has been applied in normal in vivo canine hearts to measure the radiation force-induced motion amplitude through the cardiac cycle [37]. A metric called the displacement ratio rate was used to assess the relative stiffness of the cardiac tissue by comparing different acquired responses using motion induced by radiation force [38]. ARFI imaging has also been applied for assessment of ablated cardiac tissue with the premise that the ablated tissue has a higher stiffness than the normal tissue and less motion will be observed in the ablated region versus the surrounding normal tissue [39, 40].
Shear wave based methods have also been used in open-chest animal experiments and perfused isolated hearts [38, 41–43]. The SWEI and SSI methods used a time-of-flight method to measure the shear wave group velocity and found that it varied through the cardiac cycle.
Most of the methods described above treat the heart as an elastic material. However, the heart is inherently viscoelastic and a complete characterization of the myocardium requires the contribution of viscous properties. Chen, et al., proposed a method called SDUV to characterize the viscoelasticity of tissue, taking advantage of the variation of the shear wave velocity with frequency, which is called dispersion [35, 36]. Therefore, if measurements of shear wave velocity can be made at several frequencies, a model can be used to fit the dispersive wave velocities to obtain the shear elasticity and viscosity. SDUV has been used to evaluate the viscoelastic properties of ex vivo tissues like porcine and bovine skeletal muscle, porcine kidney, human prostate and in vivo porcine liver as reviewed recently [44].
One of the critical aspects of assessing the viscoelastic material properties of the heart is to have quantitative measures. Methods that rely on the displacement amplitude or strain including some MRE studies [13, 14], strain imaging [18–25], and ARFI imaging studies [37–40] provide a relative mapping of stiffness, relying on the premise that when tissue is soft then displacement will be large and, when tissue is stiff, the displacement will be small. This could be useful when there is a region that is different from the surrounding tissue such as an ablated or infarcted region, but if the whole myocardium has elevated stiffness, then these methods may not be as effective.
The wave-based methods described above including MRE, SWEI, SSI, and SDUV provide a quantitative evaluation of material properties because the wave equation can be solved locally and does not require knowledge of the input stress distribution. Most of these wave-based methods assume that the medium is of infinite extent, that compressional waves can be ignored, and that wave reflections are not present. MRE is unique in this category because three-dimensional data can be acquired and a curl filtering operation can be applied to eliminate compressional waves [45]. Also, directional filtering techniques have been used to eliminate effects of reflected waves in MR- and ultrasound-based shear wave applications [46, 47]. However, the thickness of the left ventricular (LV) wall is 7–15 mm which is on the same order as the wavelength of the waves being measured (10–50 mm). Because the wavelengths of the shear wave are larger or on the same order as the dimensions of the heart wall, the boundaries and wave reflections become important [48–50].
To take these boundary conditions into account, different models have been proposed. In the case of MRE, one group has used model-based approaches to fit the measured displacements and solve for the elastic modulus using a spherical shell model [15–17].
Kanai was the first to employ the Lamb wave equations of motion to estimate myocardial viscoelasticity. He measured the wave propagation in the ventricular septum after the closure of the aortic valve, and modeled the wave motion with a plane antisymmetric Lamb wave model assuming that the septum was a viscoelastic plate of uniform thickness [30]. In this antisymmetric mode the top and bottom surfaces of the plate move in the same direction at a given position in the x-direction (Fig. 1). In that study, the shear elasticity and viscosity of the septum were estimated over a bandwidth from 10–90 Hz.
Fig. 1.
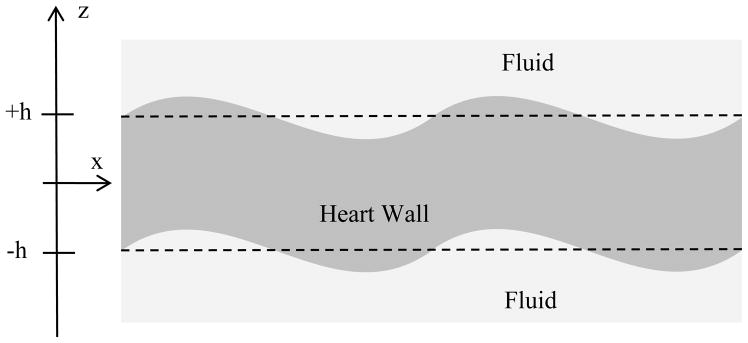
Antisymmetric Lamb wave motion of heart wall.
Lamb wave modeling was extended by Nenadic, et al., and combined with SDUV techniques [35, 36] and named Lamb wave Dispersion Ultrasound Vibrometry (LDUV) [48]. This method addresses both of the sources of wave velocity dispersion present in viscoelastic media of finite thickness. The first source of wave velocity dispersion is the intrinsic viscoelasticity of the material that is measured with SDUV. The second source of wave velocity dispersion occurs in materials of finite thickness, because of interactions of the compressional and shear waves with the epicardial and endocardial boundaries of the heart wall. A theoretical basis for the problem of a plate surrounded by fluid on both surfaces and excited by a rod through the plate was reported in [48], and validated experimentally in gelatin and urethane rubber plates and in ex vivo porcine LV myocardium.
Surface waves, or Rayleigh waves, have also been studied for the characterization of viscoelastic materials [49–54]. Our group showed that the Lamb and Rayleigh wave velocities converge, and the frequency at which this occurs depends on the thickness of the material and the material properties. This convergence was demonstrated experimentally in gelatin plates, excised porcine spleen and LV myocardium. One conclusion of this work was that using excitation through the plate or on the surface provides similar wave velocity measurements, which is important for in vivo open-chest experiments reported here in which only surface excitation is applicable.
In this paper, we briefly review the LDUV methodology for measuring shear properties of ventricular myocardium and focus on strengths and drawbacks of the method. Using simulated data, we study the sensitivity of the Lamb wave model. Lastly, we present results from open-chest experiments in pigs, reporting shear elasticity and viscosity of the LV myocardium and their variation from diastole to systole. Fitting to the Rayleigh wave model is also discussed.
Methods
Antisymmetric Lamb Wave Dispersion Ultrasound Vibrometry (LDUV)
We assume that the heart wall is a viscoelastic plate based on the Kelvin-Voigt model (also referred to as Voigt model) with thickness H = 2h [30, 48], and that the motion is an antisymmetric Lamb wave (Fig. 1). The model that is used in this paper was derived using cylindrical coordinates [48], whereas the model by Kanai was derived using plane wave assumptions [30]. The reason that we adopted the cylindrical coordinate system is because shear waves produced by ultrasound radiation force are sometimes modeled as a cylindrical wave source [35]. However, the wave velocity dispersion equation for both models was found to be identical. Assuming that the shear modulus, μ, is much smaller than the bulk modulus, λ, we arrive at the following dispersion equation:
| (1) |
where cL is the Lamb wave velocity, kL = ω/cL(μ, ω), , ρm is myocardial mass density which for this paper is assumed to be μm = 1080 kg/m3, and μ = μ1 + iωμ2 where μ1 and μ2 are the shear elasticity and viscosity, respectively.
Rayleigh Wave Dispersion Ultrasound Vibrometry (RDUV)
We also examined the Rayleigh wave method because of the surface excitation being used in this study and to interpret some of the results. Rayleigh waves are surface waves and their amplitude decreases at an exponential rate away from the surface [55]. Nenadic, et al., demonstrated that the Rayleigh wave velocity dispersion equation for a viscoelastic solid with fluid loading is given by [49]
| (2) |
where cR is the Rayleigh wave velocity, kR = ω/cR(μ, ω), .
In order to relate the Lamb wave velocity dispersion to the Rayleigh wave velocity dispersion, Eq. (1) can be divided by the product cosh(kLh)cosh(βLh) which gives [49]
| (3) |
For the case of the Rayleigh waves we can assume that the product in the hyperbolic tangent functions approaches infinity either because the thickness or the frequency approaches infinity, and Eq. (3) reduces to Eq. (2) because the hyperbolic tangent function will approach unity.
Sensitivity Analysis of LDUV Inversion
We also evaluated the sensitivity of fitting the Lamb wave velocity dispersion for different combinations of μ1 and μ2 using simulated data. The Lamb wave velocity dispersion curve is defined for values of cL, h, μ, and ω when the full dispersion equation (Eq. (1)) is set to zero as
| (4) |
The thickness of the heart wall can be measured with ultrasound techniques throughout the cardiac cycle, and the measured wave velocities are then fit with (4) to extract μ1 and μ2. To investigate the sensitivity of how the Lamb wave velocities vary with different conditions, we simulated the values of cL for different frequencies, values of h, and combinations of μ1 and μ2. We then evaluated the sensitivity of cL with respect to μ1 and μ2 by taking the partial derivatives of cL with respect to these two variables
| (5) |
| (6) |
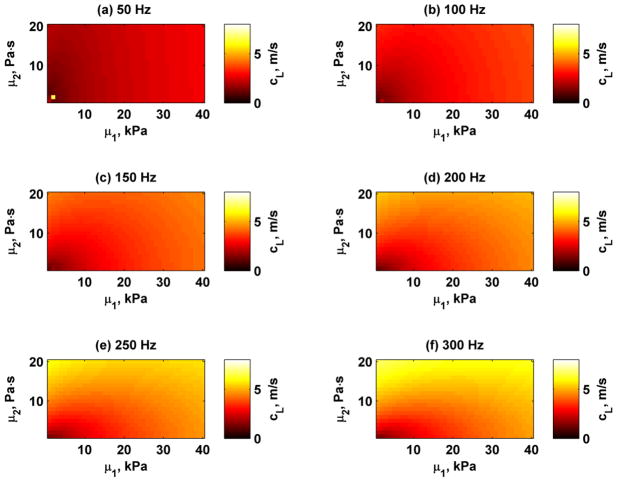
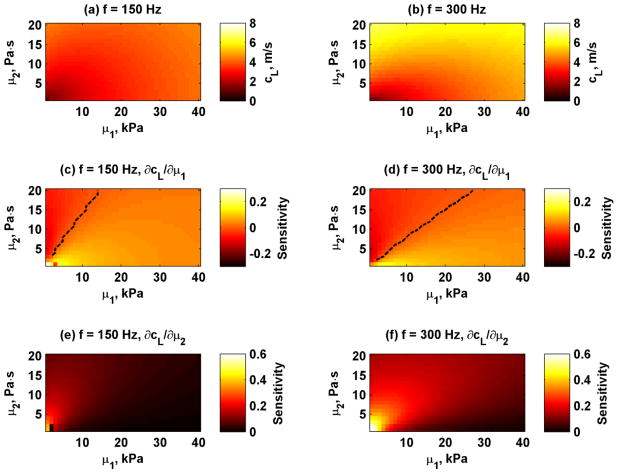
As an example we simulated the Lamb wave velocities for H = 12 mm for frequencies 50, 100, 150, 200, 250, and 300 Hz for values for μ1 = 1–40 kPa and μ2 = 0–20 Pa·s. These Lamb wave velocities are shown in Fig. 2. The Lamb wave velocities increase as frequency and the values of the material properties increase. The sensitivities from equations (5) and (6) were calculated for 150 and 300 Hz and are shown in Figure 3. The black dashed line in the Sμ1 images depicts the combinations of μ1 and μ2 when the sensitivity is near zero. The results showed that for a material with some given combinations of μ1 and μ2, fitting the Lamb wave may have low sensitivity for μ1 estimates. Negative values of Sμ1 that are present to the left of the dashed lines in Fig. 3(c) and (f) mean that as μ1 increases, the Lamb wave velocities decrease for a given value of μ2. When the sensitivity values Sμ1 are positive, the Lamb wave velocities increase as μ1 increases. The sensitivities also shift with increasing frequency. The values for Sμ2 are always positive for all combinations of μ1 and μ2, which implies that Lamb wave velocities monotonically increase as μ2 increases.
Fig. 2.
Simulated Lamb wave velocities for frequencies 50–300 Hz for wall thickness H = 12 mm and different combinations of μ1 and μ2. (a) 50 Hz, (b) 100 Hz, (c) 150 Hz, (d) 200 Hz, (e) 250 Hz, (f) 300 Hz.
Fig. 3.
Simulated Lamb wave velocities and sensitivities for frequencies 150 and 300 Hz for wall thickness H = 12 mm and different combinations of μ1 and μ2. (a) Lamb wave velocities at 150 Hz, (b) Lamb wave velocities at 300 Hz, (c) Sμ1 at 150 Hz, (d) Sμ1 at 300 Hz, (e) Sμ2 at 150 Hz, (f) Sμ2 at 300 Hz. The black dashed lines in panels (c) and (d) depict when Sμ1 = 0.
Experiments
An open-chest animal protocol was used as approved by the Mayo Clinic Institutional Animal Care and Use Committee. We performed successful experiments on eight pigs. We inserted a pressure catheter into the left ventricle (Millar Instruments, Houston, TX) and used a three-lead ECG. Acquisition of these signals was synchronized with the mechanical excitation.
We designed an experiment that used a mechanical shaker with an attached rod to generate waves in the heart wall. At the end of the rod we used one of two different types of tips. One of those was a 6 mm diameter ball bearing attached to a rod, and the other was a small plate with a stainless steel cylinder with diameter of 6 mm and length of 21 mm attached along the long end of the plate (like an inverted T). The shaker (V203, Ling Dynamic Systems Limited, Hertfordshire, UK) was driven with a signal generator (33120A, Agilent, Santa Clara, CA) and an amplifier (XLS 202, Crown Audio, Inc., Elkhart, IN). The frequency and amplitude of the excitation was varied with the signal generator.
The induced motion was measured using a high frame rate acquisition sequence using an Ultrasonix Sonix RP system and a linear array transducer (L9-4/38) (Ultrasonix Medical Corporation, Richmond, BC, Canada). The linear array transducer was wrapped in a latex cover filled with ultrasound gel, and another cover was filled with saline to provide a stand-off that could move with the beating heart. The transducer was placed in a rigid fixture anchored to the surgical table to insure that the transducer was stationary with respect to the beating heart wall. The motion was captured using an M-mode type scheme with multiple lines (typically 6–8 depending on the depth), separated by 0.9 mm. Frame rates were on the order of 2000–2500 Hz depending on the depth used for acquisition which was typically 25–30 mm.
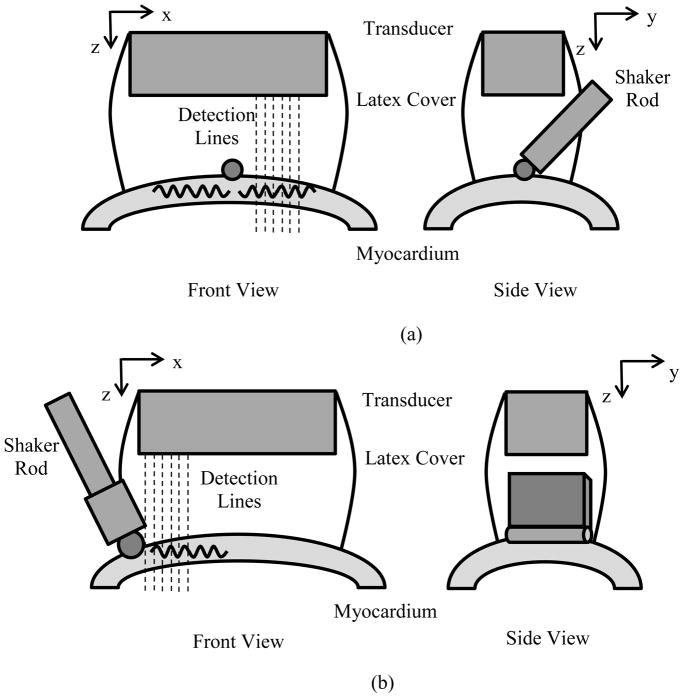
We used two different arrangements of the excitation with respect to the transducer (Fig. 4). In the first configuration, the ball bearing end was centered in the B-mode imaging plane and the sequence was defined to measure waves propagating along the length of the array. In the second configuration, the plate-cylinder end was placed at the end of the transducer so that waves could be measured in the azimuthal direction of the transducer. In the first 2 pigs we used the first actuator tip depicted in Fig. 4(a), and all other studies were performed with the plate-cylinder tip (Fig. 4(b)) because of ease of positioning. The acquired data were similar in nature for either of the tips used. The actuator tip was positioned on the anterior LV wall (mid-level), and the waves were directed in a longitudinal orientation. The tip was placed in contact with the heart wall surface to generate the waves. The tip was positioned to make sure that contact was always maintained with the heart wall throughout the cardiac cycle. This was confirmed before each data acquisition by visual observation and by inspection of data for presence of harmonic vibration.
Fig. 4.
Experimental setups. (a) A rod with a ball bearing was attached to the mechanical shaker. The ball bearing was placed onto the surface of the myocardial wall. A linear array transducer was suspended above the heart wall and coupled with a water-filled latex cover. (b) A rod with a plate and steel cylinder bearing was attached to the mechanical shaker (inverted T configuration). The cylinder was placed onto the surface of the myocardial wall. A linear array transducer was suspended above the heart wall and coupled with a water-filled latex cover.
Data were acquired at 8 different frequencies, one frequency at a time, from 50 to 400 Hz in 50 Hz increments. Radiofrequency (RF) data were acquired for 2–3 seconds of vibration to capture multiple cardiac cycles. The initiation of the vibration and data acquisition was gated on the ECG R-wave. For each frequency, the data acquisition was repeated five times to assess repeatability. The data were processed offline in spatial and temporal segments using cross-spectral analysis to obtain motion [56]. The RF data were processed using 2 mm windows with 50% overlap. The amplitude and phase of the vibration for discrete segments in space and time were estimated using the fast Fourier transform. The time segments were 100 ms in length with 60% overlap. For each spatiotemporal window, the phase was plotted versus distance along the azimuthal direction of the transducer, and a linear regression was performed to find the phase velocity using
| (7) |
where Δx is the distance and Δφ is the phase difference. As a quality factor, wave velocity values were kept when the R2 of the linear regression was greater than 0.70.
The endocardial and epicardial borders of the LV wall were manually identified for the total data acquisition period to isolate the heart wall for data analysis and to calculate wall thickness later used for the estimation of μ1 and μ2 using Eq. (4).
For each frequency, we used the five acquisitions of several cardiac cycles to reconstruct a mean velocity profile. The ECG and LV pressure curves were used to determine systole and diastole in each recording.
We characterized the viscoelastic material properties of the myocardium in diastole and systole. The end-diastolic values are most representative of the passive tissue properties with minimal or no influence from relaxation, while systolic values mostly reflect the contractile properties. We fit the Lamb wave model (Eq. 4) to the set of mean velocity values for each time point in the averaged cardiac cycle to obtain values of μ1 and μ2. Viscoelastic moduli at end-diastole (diastolic) and the mean value during the ejection phase (systolic) are compared. The isovolumic contraction period was not used for the systolic characterization. We performed a t-test between the values of μ1 and μ2 of the Voigt model during diastole and systole to assess if these values were statistically different (p < 0.05).
Results
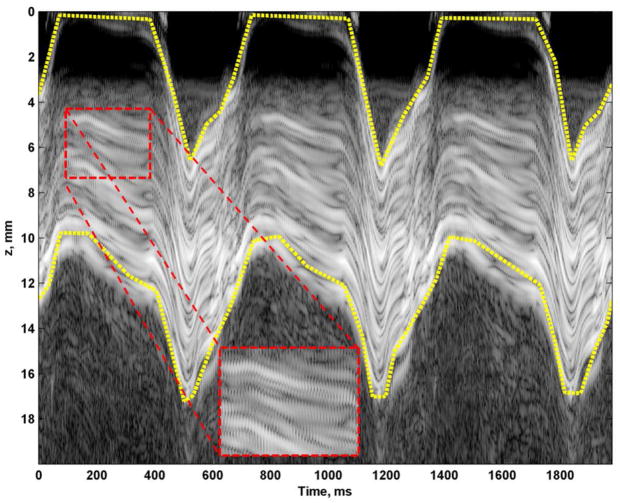
Figure 5 shows a sample M-mode image of a three second acquisition while inducing vibration at 150 Hz. The induced motion was easily observed from the M-mode data (Fig. 5 inset). To isolate the heart wall, manual segmentation was performed by drawing boundaries for the epicardial (top) and endocardial (bottom) surfaces, which are shown as yellow dashed lines in Fig. 5.
Fig. 5.
M-mode recording and manually drawn mask borders for subsequent analysis (yellow dashed lines). Small oscillations can be observed from the 150 Hz vibration in the magnified inset.
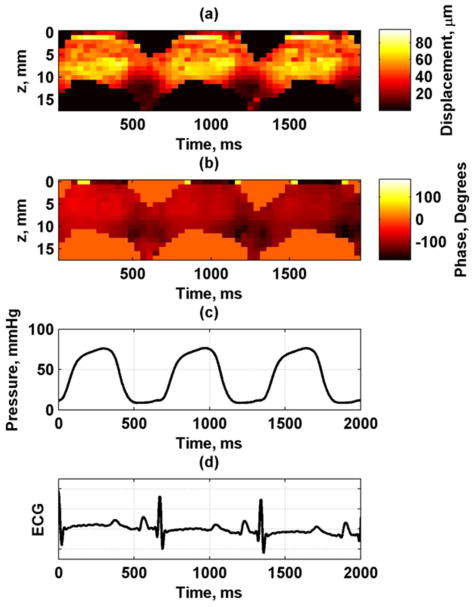
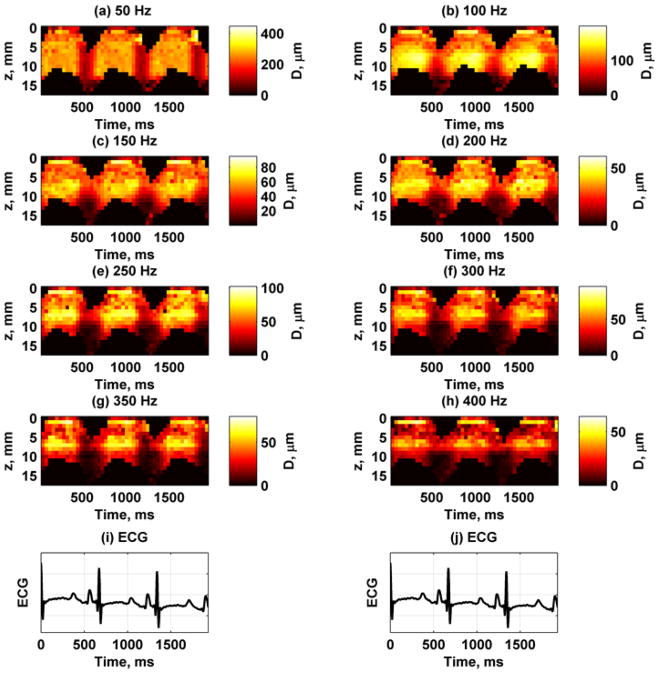
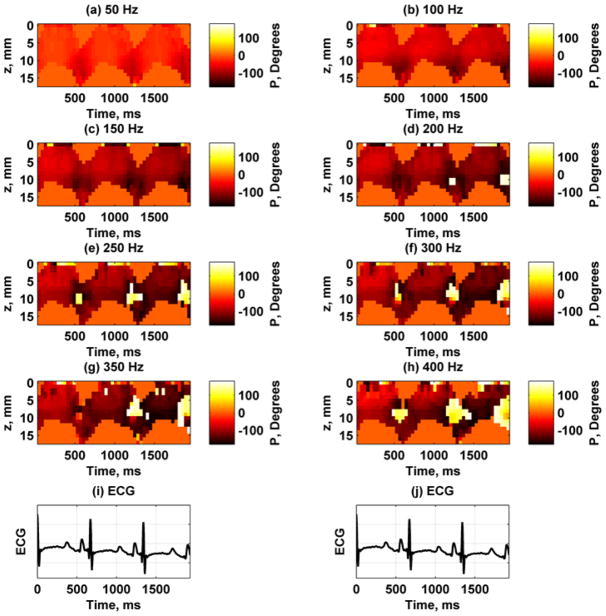
Figure 6 shows the displacement amplitude and phase at 150 Hz through three cardiac cycles at the A-line closest to the actuator. These measurements were taken using the experimental setup described in Fig. 4(a). To correlate with physiological measurements, we also show the ECG waveform and the LV pressure. The displacement amplitude varies through the cardiac cycle and is highest during systole and lowest during diastole. Figure 7 shows the displacement images for each frequency for the A-line closest to the actuator. The amplitude decreases with higher frequencies partly because the shaker can not generate as high amplitudes as it can at lower frequencies. Figure 8 shows the displacement phase for each frequency measured at the A-line closest to the actuator. The phase at each time point is fairly uniform through the thickness, which is indicative of the antisymmetric Lamb wave motion, i. e., the whole plate moves up and down as a whole. At the higher frequencies some phase wrapping can be observed in the transition from dark red or black to white. In the data analysis, the phase was unwrapped prior to applying regression to find the phase gradient for Eq. (7).
Fig. 6.
Wave propagation data at 150 Hz for first A-line from one animal, (a) amplitude, (b) phase, (c) LV pressure, (d) ECG.
Fig. 7.
Spatiotemporal maps of displacement amplitude for frequencies 50–400 Hz at first A-line from one animal. The color bar for each panel is different to reflect different displacement amplitudes. (a) 50 Hz, (b) 100 Hz, (c) 150 Hz, (d) 200 Hz, (e) 250 Hz, (f) 300 Hz, (g) 350 Hz, (h) 400 Hz, (i) – (j) ECG trace for synchronization purposes.
Fig. 8.
Spatiotemporal maps of displacement phase for frequencies 50–400 Hz at first A-line from one animal. Phase wraps occur when there is a sharp transition from a dark red or black to white or yellow. (a) 50 Hz, (b) 100 Hz, (c) 150 Hz, (d) 200 Hz, (e) 250 Hz, (f) 300 Hz, (g) 350 Hz, (h) 400 Hz, (i) – (j) ECG trace for synchronization purposes.
Figure 9 provides representative data during diastole and systole and the analysis performed. Figures 9(a) and (d) show the time-domain motion from eight A-lines for 150 Hz vibration for the diastolic and systolic samples, respectively. Sinusoidal motion was observed along with low frequency variations. A fast Fourier transform was applied to the time-domain signals to obtain the frequency-domain representations shown in Figs. 9(b) and (e). Peaks at 150 Hz were present in the magnitude plots. Large components at lower frequencies were present. The phase at 150 Hz for each A-line was extracted as shown in Figs. 9(c) and (f). A linear regression was performed from the phase data and distance to obtain wave velocity. The diastolic velocity was 2.01 m/s and the R2 for the linear regression was 0.967. The systolic velocity was 4.63 m/s and the R2 for the linear regression was 0.975.
Fig. 9.
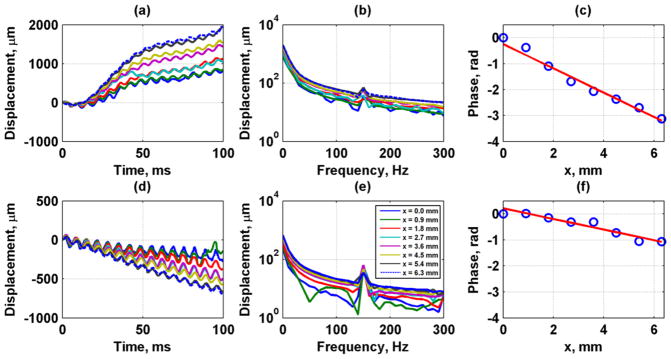
Vibration data at 150 Hz during diastole (top row) and systole (bottom row) from a 100 ms temporal window. (a, d) Time-domain displacement data, (b, e) Frequency-domain displacement data, (c, f) Phase data (circles) and regression (line) for speed estimation during diastole. The calculated wave velocity was 2.01 m/s during diastole and 4.63 m/s during systole. The R2 for the regression was 0.967 and 0.975, respectively. The legend in (e) applies also to panels (a), (b), and (d).
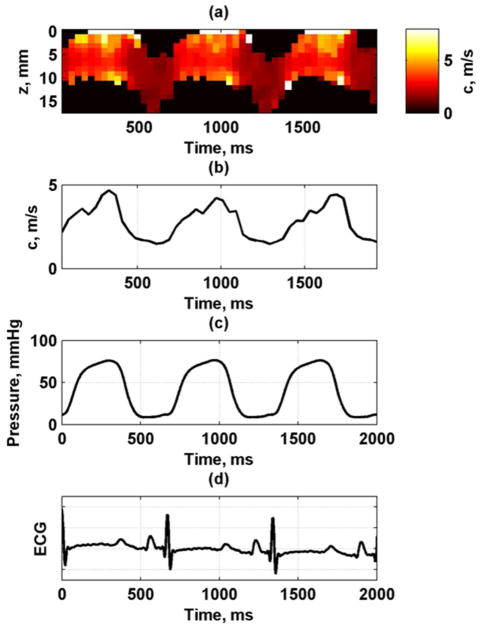
Figure 10 shows the phase velocity variation through depth (wall thickness) and through the cardiac cycle at 150 Hz. A median filter with a kernel size of 3 × 1 was used to filter the phase data to exclude outliers and smooth the data for calculation of the phase velocities. The filter was oriented in the vertical direction through the thickness of the LV wall. The median of the values through the wall thickness at each time point was taken. It can be seen that the phase velocity follows the LV pressure curve closely, with low velocity values during diastole when the LV pressure is low and higher velocity values during systole when the pressure is high. The pattern was very consistent from cycle to cycle (Fig. 10(b)).
Fig. 10.
Phase velocity variation through cardiac cycle at 150 Hz from one animal. (a) Phase velocity map, (b) Median phase velocity through wall thickness, (c) LV pressure, (d) ECG.
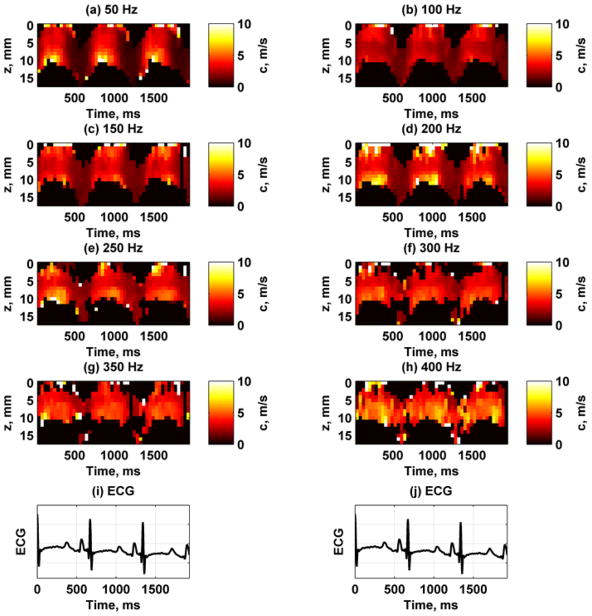
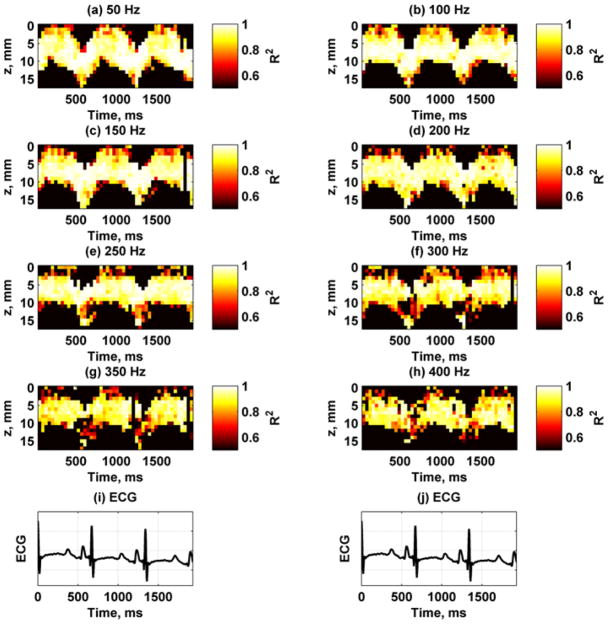
Figure 11 shows the spatiotemporal variation of the phase velocities for each frequency. All of the images have the same fixed scale so that the increase in phase velocity with frequency can be appreciated. In particular, the variation of the phase velocities at the lower frequencies like 100 Hz has different ranges than those at the higher frequencies such as 250 Hz. The epicardial and endocardial surfaces showed higher velocities during systole compared with the midwall. Figure 12 shows the R2 values for the different phase velocity calculations. The R2 values are highest for the lower frequencies and decreases at higher frequencies, probably due to lower motion amplitude.
Fig. 11.
Example of phase velocity variation for 8 frequencies between 50–400 Hz from one animal. (a) 50 Hz, (b) 100 Hz, (c) 150 Hz, (d) 200 Hz, (e) 250 Hz, (f) 300 Hz, (g) 350 Hz, (h) 400 Hz, (i) – (j) ECG trace for synchronization purposes.
Fig. 12.
Example of R2 values from linear regression for estimation of phase velocities at 8 frequencies between 50–400 Hz from one animal. All panels were scaled from 0.5–1. (a) 50 Hz, (b) 100 Hz, (c) 150 Hz, (d) 200 Hz, (e) 250 Hz, (f) 300 Hz, (g) 350 Hz, (h) 400 Hz, (i) – (j) ECG trace for synchronization purposes.
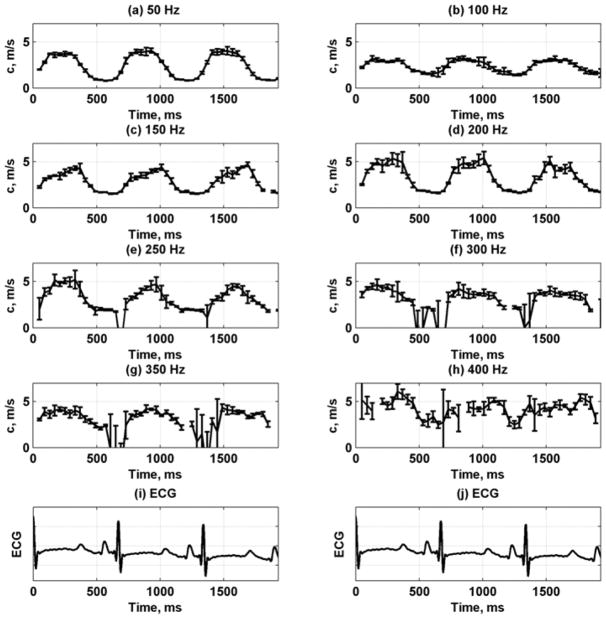
Figure 13 shows the mean and standard deviations of the phase velocity plots of the data from the five repeated acquisitions at each frequency. These data demonstrate the consistent variation in phase velocity from heartbeat to heartbeat and the good repeatability of measurements at one location (without changing the position of the transducer). The error bars increase with the frequency, probably because of lower displacement amplitudes and more susceptibility to phase estimation errors.
Fig. 13.
Phase velocity variation for 8 frequencies between 50–400 Hz by taking median through wall thickness from one animal. The error bars are the standard deviations from five consecutive acquisitions. (a) 50 Hz, (b) 100 Hz, (c) 150 Hz, (d) 200 Hz, (e) 250 Hz, (f) 300 Hz, (g) 350 Hz, (h) 400 Hz, (i) – (j) ECG trace for synchronization purposes.
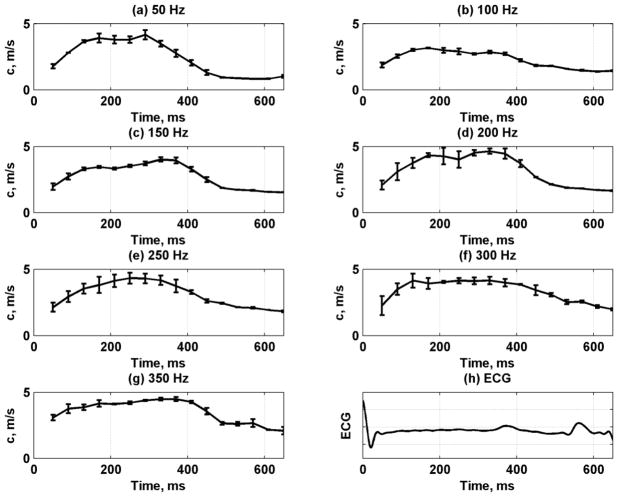
The data from the five repetitions and multiple cardiac cycles were used to obtain mean velocity profiles through one average heart cycle. Fig. 14 shows the mean velocity and standard deviation throughout the heart cycle for frequencies 50–350 Hz. We fit the mean dispersive velocity data shown in Fig. 14 to the Lamb wave model to obtain the estimates for μ1 and μ2 as shown in Fig. 15. The shear elasticity followed a similar pattern as the left ventricular pressure. The values of μ2 did not vary as strongly as the phase velocities and μ1.
Fig. 14.
Phase velocity variation for 7 frequencies between 50–350 Hz by taking mean and standard deviation (error bars) over five acquisitions and multiple heart cycles from one animal. (a) 50 Hz, (b) 100 Hz, (c) 150 Hz, (d) 200 Hz, (e) 250 Hz, (f) 300 Hz, (g) 350 Hz, (h) ECG signal.
Fig. 15.
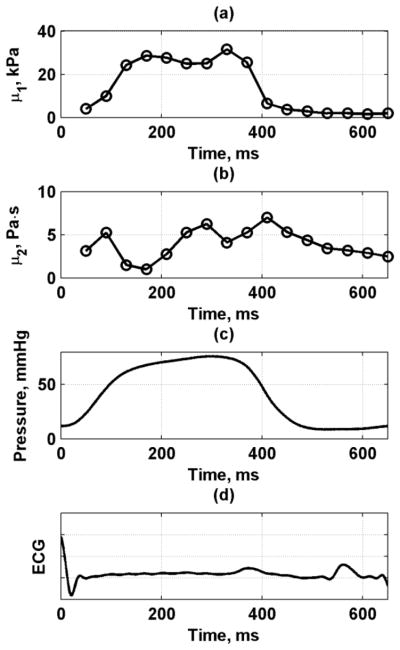
Viscoelastic material property fits to Lamb wave model through cardiac cycle from one animal. (a) μ1, (b) μ2, (c) LV pressure, (d) ECG.
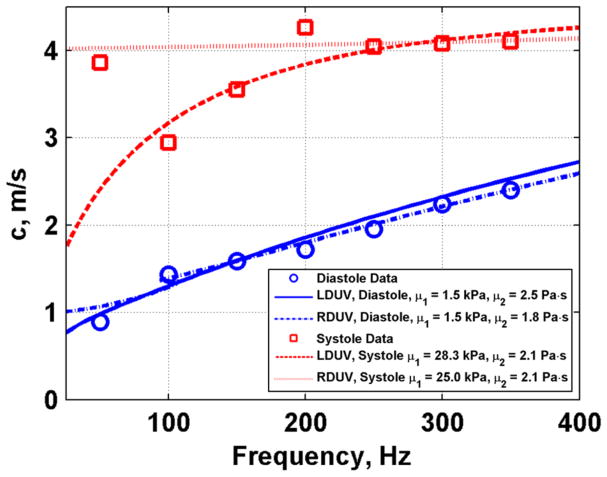
Figure 16 shows an example of measured phase velocities for diastole and systole and the Lamb wave fits to the data. The value of μ1 was 1.5 kPa in diastole and 28.3 kPa in systole, and the value of μ2 was 2.5 Pa·s in diastole and 2.1 Pa·s in systole.
Fig. 16.
Phase velocity dispersion with fits to Lamb (LDUV) and Rayleigh (RDUV) wave models for diastole and systole from one animal.
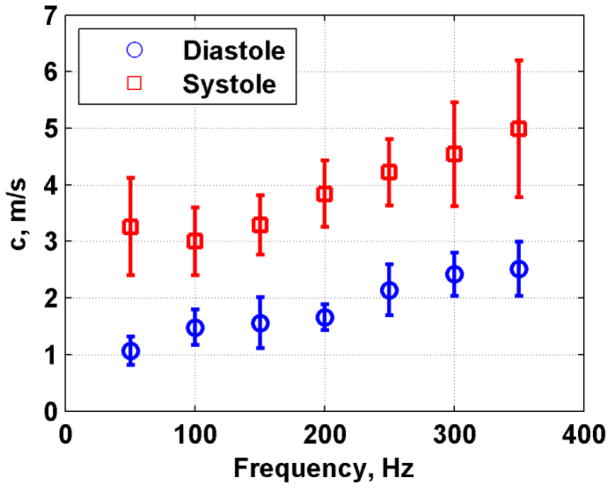
Figure 17 shows the mean and standard deviations of the phase velocities measured in eight pigs. The phase velocity values were higher in systole than in diastole and the error bars were also larger in systole than in diastole. We fit the dispersive velocity data for each pig and the results for μ1 and μ2 are summarized in Fig. 18 as a box plot. The mean and standard deviations of μ1 and μ2 were also computed. In diastole μ1 = 1.81 ± 0.80 kPa and μ2 = 2.76 ± 0.56 Pa·s, and in systole μ1 = 21.14 ± 7.72 kPa and μ2 = 4.16 ± 4.32 Pa·s. The difference for μ1 between systole and diastole was statistically significant (p < 0.001), but not for μ2 (p = 0.4205).
Fig. 17.
Summary of phase velocity dispersion for diastole and systole for all eight animals. The values represent the mean and standard deviations from eight animals.
Fig. 18.
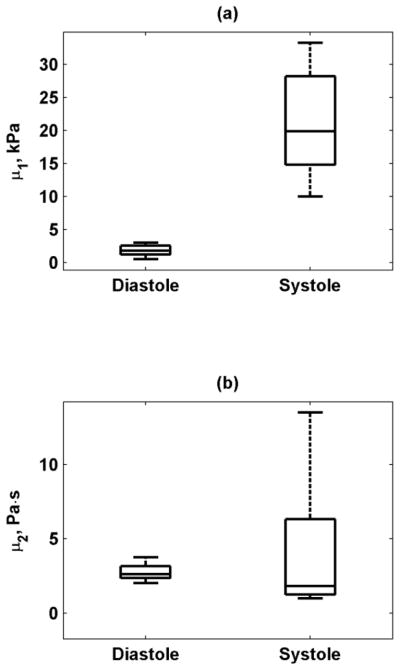
Box plots of (a) μ1, (b) μ2 from eight normal animals at end-diastole and during systole (mean value during ejection) estimated using Lamb wave model. The line inside the box denotes the median, and the edges of the box represent the 25th and 75th percentiles of the data. The whiskers denote the range of the data.
We noticed that there was an unexplained high velocity value at 50 Hz, particularly during systole (Fig. 16). Knowing that the Rayleigh wave velocities are always higher than the Lamb wave velocities at the lower frequencies for a material of the same shear properties [49, 50], we fit the Rayleigh wave velocity dispersion (Eq. 2). We found a value of μ1 of 1.5 kPa in diastole and 25.0 kPa in systole, and a value of μ2 was 1.8 Pa·s in diastole and 2.1 Pa·s in systole. These results suggest that the Rayleigh wave dispersion may capture the 50 Hz data point in the systole data better in the low frequency range and converges with the Lamb wave data at frequencies 200–400 Hz. The Rayleigh and Lamb fits for the diastolic data are similar over the entire bandwidth. For both fits, the values are relatively close. The Lamb wave model fits the data points at 100 and 150 Hz better than the Rayleigh wave model, thus the Lamb wave model may be superior for these measured data. Another explanation for the high velocity at 50 Hz could be the existence of some near-field effects [57].
Discussion
The displacement amplitude and phase of the propagating waves were shown to change throughout the cardiac cycle. However, these parameters by themselves could not be used for quantitative assessment of the viscoelastic properties of the myocardial tissue. The phase measurements confirmed that we are measuring an antisymmetrical Lamb wave, as the phase was constant throughout the depth (thickness) of the myocardium, thus the model used is suitable for the heart wall.
The phase velocity maps provide a novel way to analyze the behavior of the myocardium and its material properties both in space and time. It is important to note that the phase velocity measurements are independent of the induced vibration amplitude. The epicardial and endocardial surfaces showed higher velocities during systole compared with the midwall as seen in Fig. 11. The phase velocities were more uniform through depth during diastole. The wave velocities and material properties changed during the heart cycle, as expected. During diastole, the heart muscle is relaxed and the passive characteristics of the tissue are dominant. During systole, the contractile elements are activated and myofibers shorten (wall thickens), and their effect dominates as disclosed by an increase in shear elastic and viscous moduli.
The phase velocity dispersion data were fit to the antisymmetric Lamb wave model, and the fit was found to be good. In the example in Fig. 16, there was a 17-fold increase in the shear modulus and a slight decrease in viscosity from diastole to systole. The phase velocities in systole were consistently higher than in diastole. The variance of the phase velocities was found to be smaller in diastole than in systole. This may be due to the reduced wall motion during this period. Because the cardiac motion has most of its energy at relatively low frequencies (less than 100 Hz) as demonstrated in Fig. 9, we can use targeted signal processing techniques to examine vibration at the frequency of interest. This was determined from Fourier analysis of the measured motion at different stages of the cardiac cycle. The data in Figs. 9(b) and (e) show that the magnitude is high at 0 to 20 Hz, and then the amplitude decays at higher frequencies down to the noise floor. As a result, the distinct excitation frequencies had adequate signal-to-noise ratio for robust motion detection and analysis. Also, the variance increased with frequency, probably because the vibration amplitude decreases as the frequency increases.
Box plots of the values of μ1 and μ2 in diastole and systole (Fig. 18) showed the same trend as in the example in Fig. 16. The median shear viscosity was higher in diastole than in systole, but the range of μ2 in systole was found to be high.
One parameter that relates the viscoelastic moduli is the loss tangent, which is the ratio of the loss modulus to the storage modulus [58]. For the case of the Kelvin-Voigt model, the loss modulus is ωμ2 and the storage modulus is μ1 so
| (8) |
To characterize a material, we can identify the frequency when tan(δ) = 1 as indicated by f1 = μ1/(2πμ2). Using the mean values of μ1 and μ2 in diastole and systole we computed f1. The value of f1 in diastole was 104.4 Hz and f1 for systole was 808.8 Hz. This is an indication of the importance of the viscous component in diastole.
From the sensitivity analysis, we show that the Lamb wave fitting does have some regions where sensitivity may be diminished and errors could be attributed to the curve fitting process. This shifting of the sensitivities for different combinations of μ1 and μ2 with frequency may minimize issues associated with curve fitting and regions of reduced sensitivity. That is, for a given combination of μ1 and μ2 the sensitivity may be low for one or two frequencies, but higher for the other frequencies used for the fit. As a result, using multiple frequencies may allow for more robust curve fitting.
Our results are in agreement with previous findings using other methods. In human myocardium, Kanai has found wave propagation phase velocities ranging from 1–7 m/s for a frequency range of 10–90 Hz [30]. The values of μ1 = 24–30 kPa acquired at end-systole in human myocardium agree with μ1 during systole found in this study. However, in that study the values for μ2 = 70–400 Pa·s were substantially higher than those we report here. One explanation could be that the Lamb wave fits by Kanai are difficult to make for the low frequencies and low bandwidth (10–90 Hz), whereas we find good agreement between our data and curve fits over the bandwidth 50–400 Hz that we report here. Bouchard, et al., reported shear wave group velocities ranging from 0.83–2.65 m/s measured in mid-diastole in open-chest dogs [41]. Couade, et al., reported measurements of made using SSI through the cardiac cycle in open-chest sheep [42]. The group velocities measured in long- and short-axis views, and the values in diastole were 1.45 ± 0.32 m/s and 1.85 ± 0.22 m/s, respectively, and the values in systole were 4.8 ± 1.4 m/s and 6.2 ± 1.9 m/s, respectively, but the frequencies of these waves were not reported. Pernot, et al., used SSI to investigate perfused isolated rat hearts in a Langendorff preparation [43]. They reported values of wave group velocities ranging from 0.80–5.40 m/s under different physiological conditions. These values are similar to our findings in pigs. However, in some of these studies, the thickness of the myocardium was not reported together with wave velocities [41, 42] and the frequency range of these measurements was not specified.
In our study, the Voigt model was used to describe the viscoelasticity of the heart wall. Our quantitative assessment of the viscoelastic material properties through the entire cardiac cycle and using a dispersion method is the first to our knowledge to be reported. The Lamb wave velocity dispersion data were fit reasonably well with the Voigt-based viscoelastic Lamb wave model over the frequency range tested. Other rheological models have also been used to characterize the viscoelastic properties of the myocardium. The Hill-Maxwell model involves two springs and a variable element to account for effects of contraction [59, 60]. A modified Voigt model was used to quantify the passive and active elastance [61]. The choice of the Voigt model was based on maintaining continuity with previous studies and other groups [30, 48, 49], facilitating comparison of the results. Model-free approaches might be better suited to characterize the myocardial material properties.
The value of the measured wave velocity in the heart wall depends significantly on the frequency of the particular wave because of viscoelasticity and geometry effects. If only the group velocity is quoted with no knowledge of the frequency of the wave, the elasticity estimate could be biased and may not be comparable between different methods. Additionally, if only an elastic medium is assumed for an inherently viscoelastic tissue, the effects of viscosity will be neglected and the measured speed will give a biased shear modulus, because the estimated modulus must now account for both elastic and viscous behavior.
The addition of viscosity may be important for a full characterization of the myocardial tissue and may act as a unique indicator of disease processes. Schmeling, et al., found that the viscosity in the LV wall during the diastolic phase of the cardiac cycle increased during occlusion of the left anterior descending coronary artery [61], and returned to baseline only in animals that recovered from the stunning. However, the viscosity was shown to rise in both ischemic and nonischemic regions of the LV wall. This finding was contrary to the passive elastance which was observed to increase only in the ischemic region.
In this study we used a mechanical shaker and few assumptions were made. First, the full set of measurements over the multiple frequencies took about 5–15 minutes to acquire, and the wall motion and behavior was assumed to be constant throughout this period. Secondly, we assumed that the induced waves were planar as they propagated along the azimuthal direction of the transducer. There may be some near-field effects due to the size of the actuator tip. This may partly explain the high value for the 50 Hz component in Fig. 9 for the systolic dispersion curve. A similar effect was reported by Catheline, et al. [57] and was attributed to diffraction due to the size of the vibrating rod. Additionally, as shown here in Fig. 16 and demonstrated previously [49, 50], the excitation method that we are using could have created the Rayleigh waves at 50 Hz, and the Lamb wave fit would not capture that data point in the curve fit. The Lamb wave model was able to describe the data points for all frequencies except in systole at 50 Hz, but the Rayleigh model could fit this data point well, but was not able to fit all the other data points.
The transducer was fixed rigidly with respect to the LV wall. In some cases in systole, the heart wall would come close to the transducer surface and at times impinge on the transducer surface. This rigid boundary condition violates the assumption that there are two fluid loaded surfaces as described for the antisymmetric Lamb wave model. In our future work, we will explore the effects this rigid boundary condition in the Lamb wave model and evaluate the effects it may have on the results.
We also assumed that the myocardial wall is homogeneous. It is well known that the myocardium is made up of layers with different orientations [62–64]. It has also been demonstrated that the shear wave velocity varies within the myocardium at different levels through the thickness of the LV wall [42, 65]. In this study we observed that there were some variations between the epicardial, mid-wall, and endocardial regions of the myocardium as shown in Figs. 10 and 11. The use of the LDUV method for myocardium treats the wall as a homogeneous plate, so the measurements reported can be thought of as an average value for the entire wall thickness.
In this study we used the phase gradient method to calculate the localized phase velocities. Other methods such as algebraic direct inversion or finite element-based inversions could also be used [66]. The phase gradient was found to be fairly robust where linear regressions were used on the phase data versus distance and the R2 values from the regression were used as a quality control variable.
The shaker has a magnitude frequency response that varies with a 1/f characteristic and we adjusted the driving voltage to compensate for this response. However, a constant displacement could not be maintained at higher frequencies (Fig. 7). The motion amplitude varied over a wide range of 1–400 μm, which in most cases was enough for accurate phase estimation. However, during systole, characterized by higher wall motion and stiffness, phase estimation was noisier. It is important to emphasize that phase velocities measured do not depend on the amplitude of vibration but on the accuracy of measuring displacement. Another assumption is that the tissue being measured remained in the elevational plane of the linear array transducer. If the tissue being examined is moving in and out of the elevation plane of the transducer, the RF signals used for motion tracking could be decorrelated and potentially different tissue would be used in assessing the velocities of the propagating waves.
This method described in this study in animals would not be suitable for clinical use because of its invasive nature. A clinically relevant approach would be to use ultrasound radiation force to induce propagating waves in the myocardium [41, 42, 67]. Using radiation force one can avoid some of the assumptions made here and capture the data for constructing the dispersion curves in one acquisition, in a completely noninvasive approach.
Conclusions
We performed in vivo experiments on the left ventricular wall of swine hearts in an open-chest preparation in which we measured the dispersive phase velocity of Lamb waves using a mechanical shaker as the excitation source. The phase was consistent through the thickness of the myocardium, confirming antisymmetric Lamb wave modal behavior. Phase velocity measurements were made throughout the cardiac cycle over a wide range of frequencies (50–400 Hz). We observed changes in phase velocities and material properties over the course of the cardiac cycle. We fit a Lamb wave Voigt model to the dispersion curves and estimated shear elasticity and viscosity for the heart wall during systole and diastole. The shear elasticity and viscosity values agree with findings reported in the literature. We also studied the sensitivity of the Lamb wave model using simulated data. Because of its high spatial and temporal resolution, the technique could be used to study changes in tissue properties with physiological variations and with disease. Future work will include using ultrasound radiation force as the excitation source to characterize the phase velocity dispersion. Measurements of myocardial mechanical viscoelastic properties could provide a useful tool for clinicians evaluating patients who have conditions that alter the heart’s material properties.
Acknowledgments
This study was supported by grant R01EB002167 from the National Institute of Biomedical Imaging and Bioengineering. The content is solely the responsibility of the authors and does not necessarily represent the official views of the National Institute of Biomedical Imaging and Bioengineering or the National Institutes of Health. The authors thank Jill Anderson for her assistance with the animal experiments, Thomas M. Kinter for laboratory support, Jennifer Milliken for administrative support, and Kris Dickie and Reza Zahiri at Ultrasonix Medical Corporation for technical support. Mayo Clinic and one of the authors (JFG) have a financial interest associated with technology used in this research; the technology has been licensed in part to industry.
References
- 1.Gaasch WH, Zile MR. Left ventricular diastolic dysfunction and diastolic heart failure. Annu Rev Med. 2004;55:373–394. doi: 10.1146/annurev.med.55.091902.104417. [DOI] [PubMed] [Google Scholar]
- 2.Hoit B, Walsh R. Normal Physiology of the Cardiovascular System. In: Fuster V, et al., editors. Hurst’s The Heart. 13. New York: McGraw-Hill; 2011. [Google Scholar]
- 3.Burlew BS, Weber KT. Cardiac fibrosis as a cause of diastolic dysfunction. Herz. 2002 Mar;27:92–98. doi: 10.1007/s00059-002-2354-y. [DOI] [PubMed] [Google Scholar]
- 4.Weber KT, Brilla CG. Pathological hypertrophy and cardiac interstitium -fibrosis and renin-angiotensin-aldosterone system. Circulation. 1991 Jun;83:1849–1865. doi: 10.1161/01.cir.83.6.1849. [DOI] [PubMed] [Google Scholar]
- 5.Maron BJ, Bonow RO, Cannon RO, Leon MB, Epstein SE. Hypertrophic cardiomyopathy - interrelations of clinical manifestations, pathophysiology, and therapy (Part II) N Engl J Med. 1987 Apr;316:844–852. doi: 10.1056/NEJM198704023161405. [DOI] [PubMed] [Google Scholar]
- 6.Borbely A, van der Velden J, Papp Z, Bronzwaer JGF, Edes I, Stienen GJM, Paulus WJ. Cardiomyocyte stiffness in diastolic heart failure. Circulation. 2005 Feb;111:774–781. doi: 10.1161/01.CIR.0000155257.33485.6D. [DOI] [PubMed] [Google Scholar]
- 7.Kawaguchi M, Hay I, Fetics B, Kass DA. Combined ventricular systolic and arterial stiffening in patients with heart failure and preserved ejection fraction -Implications for systolic and diastolic reserve limitations. Circulation. 2003 Feb;107:714–720. doi: 10.1161/01.cir.0000048123.22359.a0. [DOI] [PubMed] [Google Scholar]
- 8.Shishido T, Sugimachi M, Kawaguchi O, Miyano H, Kawada T, Matsuura W, Ikeda Y, Sato T, Alexander J, Sunagawa K. A new method to measure regional myocardial time-varying elastance using minute vibration. Am J Physiol - Heart Circulatory Physiol. 1998 Apr 1;274:H1404–H1415. doi: 10.1152/ajpheart.1998.274.4.H1404. [DOI] [PubMed] [Google Scholar]
- 9.Templeton GH, Nardizzi LR. Elastic and viscous stiffness of the canine left ventricle. J Appl Physiol. 1974 Jan 1;36:123–127. doi: 10.1152/jappl.1974.36.1.123. [DOI] [PubMed] [Google Scholar]
- 10.Miyaji K, Sugiura S, Omata S, Kaneko Y, Ohtsuka T, Takamoto S. Myocardial tactile stiffness: a variable of regional myocardial function. J Am Coll Cardiol. 1998 Apr 1;31:1165–1173. doi: 10.1016/s0735-1097(98)00063-1. [DOI] [PubMed] [Google Scholar]
- 11.Zerhouni EA, Parish DM, Rogers WJ, Yang A, Shapiro EP. Human heart: tagging with MR imaging--a method for noninvasive assessment of myocardial motion. Magn Reson Imaging. 1988;169:59–63. doi: 10.1148/radiology.169.1.3420283. [DOI] [PubMed] [Google Scholar]
- 12.Muthupillai R, Lomas DJ, Rossman PJ, Greenleaf JF, Manduca A, Ehman RL. Magnetic resonance elastography by direct visualization of propagating acoustic strain waves. Science. 1995 Sep 29;269:1854–7. doi: 10.1126/science.7569924. [DOI] [PubMed] [Google Scholar]
- 13.Elgeti T, Rump J, Hamhaber U, Papazoglou S, Hamm B, Braun J, Sack I. Cardiac magnetic resonance elastography initial results. Invest Radiol. 2008 Nov;43:762–772. doi: 10.1097/RLI.0b013e3181822085. [DOI] [PubMed] [Google Scholar]
- 14.Elgeti T, Beling M, Hamm B, Braun J, Sack I. Elasticity-based determination of isovolumetric phases in the human heart. J Cardiovasc Magn Res. 2010;12:60. doi: 10.1186/1532-429X-12-60. [DOI] [PMC free article] [PubMed] [Google Scholar]
- 15.Kolipaka A, McGee KP, Araoz PA, Glaser KJ, Manduca A, Romano AJ, Ehman RL. MR elastography as a method for the assessment of myocardial stiffness: comparison with an established pressure-volume model in a left ventricular model of the heart. Magn Reson Med. 2009 Jul;62:135–140. doi: 10.1002/mrm.21991. [DOI] [PMC free article] [PubMed] [Google Scholar]
- 16.Kolipaka A, Araoz PA, McGee KP, Manduca A, Ehman RL. Magnetic resonance elastography as a method for the assessment of effective myocardial stiffness throughout the cardiac cycle. Magn Res Med. 2010;64:862–870. doi: 10.1002/mrm.22467. [DOI] [PMC free article] [PubMed] [Google Scholar]
- 17.Kolipaka A, McGee KP, Manduca A, Romano AJ, Glaser KJ, Araoz PA, Ehman RL. Magnetic resonance elastography: inversions in bounded media. Magn Reson Med. 2009;62:1533–1542. doi: 10.1002/mrm.22144. [DOI] [PMC free article] [PubMed] [Google Scholar]
- 18.Isaaz K. Tissue Doppler imaging for the assessment of left ventricular systolic and diastolic functions. Curr Opin Cardiol. 2002 Sep;17:431–442. doi: 10.1097/00001573-200209000-00001. [DOI] [PubMed] [Google Scholar]
- 19.Sutherland GR, Di Salvo G, Claus P, D’Hooge J, Bijnens B. Strain and strain rate imaging: a new clinical approach to quantifying regional myocardial function. J Am Soc Echocardiogr. 2004;17:788–802. doi: 10.1016/j.echo.2004.03.027. [DOI] [PubMed] [Google Scholar]
- 20.Heimdal A, Stoylen A, Torp H, Skjaerpe T. Real-time strain rate imaging of the left ventricle by ultrasound. J Am Soc Echocardiogr. 1998 Nov;11:1013–1019. doi: 10.1016/s0894-7317(98)70151-8. [DOI] [PubMed] [Google Scholar]
- 21.Pislaru C, Abraham TP, Belohlavek M. Strain and strain rate echocardiography. Curr Opin Cardiol. 2002 Sep;17:443–454. doi: 10.1097/00001573-200209000-00002. [DOI] [PubMed] [Google Scholar]
- 22.Pislaru C, Bruce CJ, Anagnostopoulos PC, Allen JL, Seward JB, Pellikka PA, Ritman EL, Greenleaf JF. Ultrasound strain imaging of altered myocardial stiffness: stunned versus infarcted reperfused myocardium. Circulation. 2004;109:2905–10. doi: 10.1161/01.CIR.0000129311.73402.EF. [DOI] [PubMed] [Google Scholar]
- 23.Konofagou EE, D’Hooge J, Ophir J. Myocardial elastography - A feasibility study in vivo. 2002;28:475–482. doi: 10.1016/s0301-5629(02)00488-x. [DOI] [PubMed] [Google Scholar]
- 24.Luo JW, Fujikura K, Homma S, Konofagou EE. Myocardial elastography at both high temporal and spatial resolution for the detection of infarcts. Ultrasound Med Biol. 2007 Aug;33:1206–1223. doi: 10.1016/j.ultrasmedbio.2007.01.019. [DOI] [PubMed] [Google Scholar]
- 25.Lee WN, Qian Z, Tosti CL, Brown TR, Metaxas DN, Konofagou EE. Preliminary validation of angle-dependent myocardial elastography using MR tagging in a clinical setting. ULtrasound Med Biol. 2008 Dec;34:1980–1997. doi: 10.1016/j.ultrasmedbio.2008.05.007. [DOI] [PMC free article] [PubMed] [Google Scholar]
- 26.Pernot M, Fujikura K, Fung-Kee-Fung SD, Konofagou EE. ECG-gated, mechanical and electromechanical wave imaging of cardiovascular tissues in vivo. Ultrasound Med Biol. 2007 Jul;33:1075–1085. doi: 10.1016/j.ultrasmedbio.2007.02.003. [DOI] [PubMed] [Google Scholar]
- 27.Provost J, Lee WN, Fujikura K, Konofagou EE. Electromechanical wave imaging of normal and ischemic hearts in vivo. IEEE Trans Med Imag. 2010 Mar;29:625–635. doi: 10.1109/TMI.2009.2030186. [DOI] [PMC free article] [PubMed] [Google Scholar]
- 28.Konofagou E, Lee W-N, Luo J, Provost J, Vappou J. Physiologic cardiovascular strain and intrinsic wave imaging. Annu Rev Biomed Eng. 2011;13:477–505. doi: 10.1146/annurev-bioeng-071910-124721. [DOI] [PubMed] [Google Scholar]
- 29.Provost J, Lee W-N, Fujikura K, Konofagou EE. Imaging the electromechanical activity of the heart in vivo. Proc Natl Acad Sci U S A. 2011 May 24;108:8565–8570. doi: 10.1073/pnas.1011688108. [DOI] [PMC free article] [PubMed] [Google Scholar]
- 30.Kanai H. Propagation of spontaneously actuated pulsive vibration in human heart wall and in vivo viscoelasticity estimation. IEEE Trans Ultrason Ferroelectr Freq Control. 2005 Nov;52:1931–42. doi: 10.1109/tuffc.2005.1561662. [DOI] [PubMed] [Google Scholar]
- 31.Kanai H. Propagation of vibration caused by electrical excitation in the normal human heart. Ultrasound Med Biol. 2009 Jun;35:936–948. doi: 10.1016/j.ultrasmedbio.2008.12.013. [DOI] [PubMed] [Google Scholar]
- 32.Nightingale KR, Palmeri ML, Nightingale RW, Trahey GE. On the feasibility of remote palpation using acoustic radiation force. J Acoust Soc Am. 2001 Jul;110:625–34. doi: 10.1121/1.1378344. [DOI] [PubMed] [Google Scholar]
- 33.Sarvazyan AP, Rudenko OV, Swanson SD, Fowlkes JB, Emelianov SY. Shear wave elasticity imaging: a new ultrasonic technology of medical diagnostics. Ultrasound Med Biol. 1998 Nov;24:1419–35. doi: 10.1016/s0301-5629(98)00110-0. [DOI] [PubMed] [Google Scholar]
- 34.Bercoff J, Tanter M, Fink M. Supersonic shear imaging: a new technique for soft tissue elasticity mapping. IEEE Trans Ultrason Ferroelectr Freq Control. 2004 Apr;51:396–409. doi: 10.1109/tuffc.2004.1295425. [DOI] [PubMed] [Google Scholar]
- 35.Chen S, Fatemi M, Greenleaf JF. Quantifying elasticity and viscosity from measurement of shear wave speed dispersion. J Acoust Soc Am. 2004 Jun;115:2781–5. doi: 10.1121/1.1739480. [DOI] [PubMed] [Google Scholar]
- 36.Chen S, Urban MW, Pislaru C, Kinnick R, Zheng Y, Yao A, Greenleaf JF. Shearwave dispersion ultrasound vibrometry (SDUV) for measuring tissue elasticity and viscosity. IEEE Trans Ultrason Ferroelectr Freq Control. 2009 Jan;56:55–62. doi: 10.1109/TUFFC.2009.1005. [DOI] [PMC free article] [PubMed] [Google Scholar]
- 37.Hsu SJ, Bouchard RR, Dumont DM, Wolf PD, Trahey GE. In vivo assessment of myocardial stiffness with acoustic radiation force impulse imaging. Ultrasound Med Biol. 2007 Nov;33:1706–1719. doi: 10.1016/j.ultrasmedbio.2007.05.009. [DOI] [PMC free article] [PubMed] [Google Scholar]
- 38.Bouchard RR, Hsu SJ, Palmeri ML, Rouze NC, Nightingale KR, Trahey GE. Acoustic radiation force-driven assessment of myocardial elasticity using the displacement ratio rate (DRR) method. Ultrasound Med Biol. 2011;37:1087–1100. doi: 10.1016/j.ultrasmedbio.2011.04.005. [DOI] [PMC free article] [PubMed] [Google Scholar]
- 39.Eyerly SA, Hsu SJ, Agashe SH, Trahey GE, Li Y, Wolf PD. An in vitro assessment of acoustic radiation force impulse imaging for visualizing cardiac radiofrequency ablation lesions. J Cardiovasc Electrophysiol. 2010 May;21:557–563. doi: 10.1111/j.1540-8167.2009.01664.x. [DOI] [PMC free article] [PubMed] [Google Scholar]
- 40.Hsu SJ, Fahey BJ, Dumont DM, Wolf PD, Trahey GE. Challenges and implementation of radiation-force imaging with an intracardiac ultrasound transducer. IEEE Trans Ultrason Ferroelectr Freq Control. 2007;54:996–1009. doi: 10.1109/tuffc.2007.345. [DOI] [PMC free article] [PubMed] [Google Scholar]
- 41.Bouchard RR, Hsu SJ, Wolf PD, Trahey GE. In vivo cardiac, acoustic-radiation-force-driven, shear wave velocimetry. Ultrason Imaging. 2009 Jul;31:201–213. doi: 10.1177/016173460903100305. [DOI] [PMC free article] [PubMed] [Google Scholar]
- 42.Couade M, Pernot M, Messas E, Bel A, Ba M, Hagège A, Fink M, Tanter M. In vivo quantitative mapping of myocardial stiffening and transmural anisotropy during the cardiac cycle. IEEE Trans Med Imaging. 2011;30:295–305. doi: 10.1109/TMI.2010.2076829. [DOI] [PubMed] [Google Scholar]
- 43.Pernot M, Couade M, Mateo P, Crozatier B, Fischmeister R, Tanter M. Real-time assessment of myocardial contractility using shear wave imaging. J Am Coll Cardiol. 2011 Jun 28;58:65–72. doi: 10.1016/j.jacc.2011.02.042. [DOI] [PubMed] [Google Scholar]
- 44.Urban MW, Chen S, Fatemi M. A review of Shearwave Dispersion Ultrasound Vibrometry (SDUV) and its applications. Curr Med Imaging Rev. 2012;8:27–36. doi: 10.2174/157340512799220625. [DOI] [PMC free article] [PubMed] [Google Scholar]
- 45.Sinkus R, Tanter M, Xydeas T, Catheline S, Bercoff J, Fink M. Viscoelastic shear properties of in vivo breast lesions measured by MR elastography. Magn Reson Imaging. 2005 Feb;23:159–65. doi: 10.1016/j.mri.2004.11.060. [DOI] [PubMed] [Google Scholar]
- 46.Manduca A, Lake DS, Kruse SA, Ehman RL. Spatio-temporal directional filtering for improved inversion of MR elastography images. Med Image Anal. 2003 Dec;7:465–73. doi: 10.1016/s1361-8415(03)00038-0. [DOI] [PubMed] [Google Scholar]
- 47.Deffieux T, Gennisson JL, Bercoff J, Tanter M. On the effects of reflected waves in transient shear wave elastography. IEEE Trans Ultrason Ferroelectr Freq Control. 2011;58:2032–2035. doi: 10.1109/TUFFC.2011.2052. [DOI] [PubMed] [Google Scholar]
- 48.Nenadic IZ, Urban MW, Mitchell SA, Greenleaf JF. Lamb wave dispersion ultrasound vibrometry (LDUV) method for quantifying mechanical properties of viscoelastic solids. Phys Med Biol. 2011;56:2245. doi: 10.1088/0031-9155/56/7/021. [DOI] [PMC free article] [PubMed] [Google Scholar]
- 49.Nenadic IZ, Urban MW, Aristizabal S, Mitchell SA, Humphrey T, Greenleaf JF. On Lamb and Rayleigh wave convergence in viscoelastic tissues. Phys Med Biol. 2011;56:6723–6738. doi: 10.1088/0031-9155/56/20/014. [DOI] [PMC free article] [PubMed] [Google Scholar]
- 50.Nenadic IZ, Urban MW, Bernal M, Greenleaf JF. Phase velocities and attentuations of shear, Lamb, and Rayleigh waves in plate-like tissues submerged in a fluid. J Acoust Soc Am. 2011;130:3549–3552. doi: 10.1121/1.3654029. [DOI] [PMC free article] [PubMed] [Google Scholar]
- 51.Royston TJ, Mansy HA, Sandler RH. Excitation and propagation of surface waves on a viscoelastic half-space with application to medical diagnosis. J Acoust Soc Am. 1999;106:3678–3686. doi: 10.1121/1.428219. [DOI] [PubMed] [Google Scholar]
- 52.Meral FC, Royston TJ, Magin RL. Surface response of a fractional order viscoelastic halfspace to surface and subsurface sources. J Acoust Soc Am. 2009 Dec;126:3278–3285. doi: 10.1121/1.3242351. [DOI] [PMC free article] [PubMed] [Google Scholar]
- 53.Zhang XM, Greenleaf JF. Estimation of tissue’s elasticity with surface wave speed. J Acoust Soc Am. 2007 Nov;122:2522–2525. doi: 10.1121/1.2785045. [DOI] [PubMed] [Google Scholar]
- 54.Zhang X, Qiang B, Hubmayr RD, Urban MW, Kinnick R, Greenleaf JF. Noninvasive ultrasound image guided surface wave method for measuring the wave speed and estimating the elasticity of lungs: A feasibility study. Ultrasonics. 2011;51:289–295. doi: 10.1016/j.ultras.2010.09.005. [DOI] [PubMed] [Google Scholar]
- 55.Graff KF. Wave Motion in Elastic Solids. London, UK: Oxford University Press; 1975. [Google Scholar]
- 56.Hasegawa H, Kanai H. Improving accuracy in estimation of artery-wall displacement by referring to center frequency of RF echo. IEEE Trans Ultrason Ferroelectr Freq Control. 2006 Jan;53:52–63. doi: 10.1109/tuffc.2006.1588391. [DOI] [PubMed] [Google Scholar]
- 57.Catheline S, Wu F, Fink M. A solution to diffraction biases in sonoelasticity: the acoustic impulse technique. J Acoust Soc Am. 1999 May;105:2941–50. doi: 10.1121/1.426907. [DOI] [PubMed] [Google Scholar]
- 58.Amador C, Urban MW, Chen S, Greenleaf JF. Loss tangent and complex modulus estimated by acoustic radiation force creep and shear wave dispersion. Phys Med Biol. 2012;57:1263–1282. doi: 10.1088/0031-9155/57/5/1263. [DOI] [PMC free article] [PubMed] [Google Scholar]
- 59.Sermesant M, Delingette H, Ayache N. An electromechanical model of the heart for image analysis and simulation. IEEE Trans Med Imaging. 2006;25:612–625. doi: 10.1109/TMI.2006.872746. [DOI] [PubMed] [Google Scholar]
- 60.Chapelle D, Clement F, Gernot F, Le Tallec P, Sorine M, Urquiza JM. “A physiologically-based model for the active cardiac muscle contraction,” presented at the Proceedings of the First International Workshop on Functional Imaging and Modeling of the Heart; 2001. [Google Scholar]
- 61.Schmeling TJ, Hettrick DA, Kersten JR, Pagel PS, Warltier DC. Changes in passive but not active mechanical properties predict recovery of function of stunned myocardium. Annals Biomed Eng. 1999;27:131–140. doi: 10.1114/1.167. [DOI] [PubMed] [Google Scholar]
- 62.Sosnovik DE, Baldwin SL, Lewis SH, Holland MR, Miller JG. Transmural variation of myocardial attenuation measured with a clinical imager. Ultrasound Med Biol. 2001;27:1643–1650. doi: 10.1016/s0301-5629(01)00485-9. [DOI] [PubMed] [Google Scholar]
- 63.Streeter DD, Spotnitz HM, Patel DP, Ross J, Sonnenblick EH. Fiber orientation in the canine left ventricle during diastole and systole. Circ Res. 1969 Mar 1;24:339–347. doi: 10.1161/01.res.24.3.339. [DOI] [PubMed] [Google Scholar]
- 64.Greenbaum RA, Ho SY, Gibson DG, Becker AE, Anderson RH. Left ventricular fibre architecture in man. Br Heart J. 1981 Mar 1;45:248–263. doi: 10.1136/hrt.45.3.248. [DOI] [PMC free article] [PubMed] [Google Scholar]
- 65.Lee WN, Pernot M, Couade M, Messas E, Bruneval P, Bel A, Hagege AA, Fink M, Tanter M. Mapping myocardial fiber orientation using echocardiography-based shear wave imaging. IEEE Trans Med Imaging. 2012;31:554–562. doi: 10.1109/TMI.2011.2172690. [DOI] [PubMed] [Google Scholar]
- 66.Oliphant TE, Manduca A, Ehman RL, Greenleaf JF. Complex-valued stiffness reconstruction for magnetic resonance elastography by algebraic inversion of the differential equation. Magn Reson Med. 2001 Feb;45:299–310. doi: 10.1002/1522-2594(200102)45:2<299::aid-mrm1039>3.0.co;2-o. [DOI] [PubMed] [Google Scholar]
- 67.Nenadic IZ, Urban MW, Pislaru C, Bernal M, Greenleaf JF. In vivo open and closed chest measurements of myocardial viscoelasticity through a heart cycle using Lamb wave Dispersion Ultrasound Vibrometry (LDUV). 2011 International IEEE Ultrasonics Symposium; Orlando, FL. 2011. pp. 17–20. [Google Scholar]


