Summary
After fixating on a colored pattern, observers see a similar pattern in complementary colors when the stimulus is removed. Afterimages were important in disproving the theory that visual rays emanate from the eye[1], in demonstrating inter-ocular interactions[2], and in revealing the independence of binocular-vision from eye-movements[3]. Afterimages also prove invaluable in exploring selective attention[4], filling-in[5], and consciousness[6]. Proposed physiological mechanisms for color afterimages range from bleaching of cone photo-pigments[7] to cortical adaptation[4–6, 8, 9], but direct neural measurements have not been reported. We introduce a time-varying method for evoking after-images, which provides precise measurements of adaptation and a direct link between visual percepts and neural responses[10]. We then use in vivo electrophysiological recordings to show that all three classes of primate retinal ganglion cells exhibit subtractive adaptation to prolonged stimuli, with much slower time-constants than those expected of photoreceptors. At the cessation of the stimulus, ganglion cells generate rebound responses that can provide afterimage signals for later neurons. Our results indicate that afterimage signals are generated in the retina, but may be modified like other retinal signals by cortical processes[4–6], so that evidence presented for cortical generation of color afterimages[8, 9] is explainable by spatio-temporal factors that apply to all signals.
Results
Psychophysics
Color afterimages are common in everyday experience (and many popular web demonstrations). It has long been conjectured that afterimages result from neural adaptation, but adaptation is ubiquitous throughout the visual system, so the neural locus of afterimages has been elusive[7–9, 11–13]. We devised a simple psychophysical method of evoking after-images and measuring the underlying adaptation (Supplemental Movie 1). A grey disk subtending 3.6° was divided into two halves. The colors of the two hemi-disks were slowly modulated by sinusoidal half-cycles to opposite ends of a color axis, e.g. one half changed grey>violet>grey, while the other changed grey>lime-green>grey in the complementary color direction (Figure 1 top). The percepts of the hemi-disks initially followed the stimulus, but then accelerated past it, reaching gray before the stimulus and then continuing in the opposite directions to negative afterimages, e.g. when the physical modulations returned to grey, the half modulated through violet appeared lime-green and the half modulated through lime-green appeared violet (Figure 1 middle). By using a clock-face at the fixation point (Figure 1 bottom), with the cjmci’s startilg nmilt nerturbed raldmkjy ml each triaj, we were able to have observers report the exact time that the two hemi-disks appeared identical, which we cajj the “Ideltity-Pmilt”. At this point, despite the physical difference between the two sides, the neural signals must be equated by some stage of the visual system[10]. Hence, the physical contrast between the two hemi-disks quantifies the modification of neural signals by visual adaptation, and we will call it the “Nulled-Contrast”.
Figure 1. Psychophysical procedure.
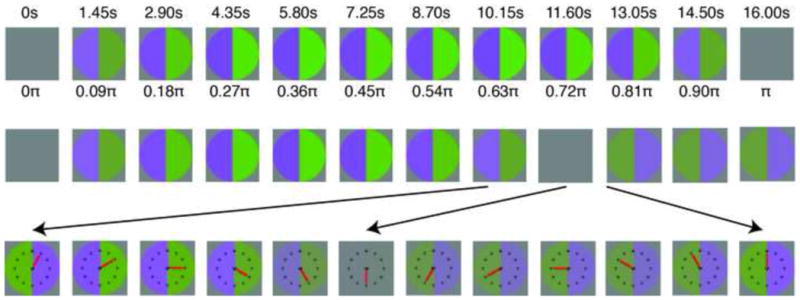
(top) Half-cycle of sinusoidal stimulus modulation (1/32 Hz presented at 120 frames/sec) depicted for this figure at 1.45 second and 0.09 radian intervals. (middle) Approximate percept corresponding to the stage of stimulus modulation immediately above. The two halves reach identity perceptually before they do physically. (bottom) Segment of trial around the point of identity is expanded to show how the clock-face is used to make the measurement. A supplemental movie of the procedure is linked to the online version.
Evidence for afterimages resulting from adaptation in independent (L, M, S) cone classes[7] often used lights many orders of magnitude brighter than lights that generate afterimages in our method, thus causing pigment bleaching, but psychophysical evidence shows that afterimages of lights also occur at mid-photopic levels [13]. In addition, retinal ganglion cells (RGCs) are the earliest neurons in the primate visual system to have been recorded from in vivo. Consequently, to search for an early neural substrate, we calibrated a display system to produce modulations around a mid-grey (62.85 cd/m2) along the three color-axes that evoke maximal responses from RGCs[14]. Using the abbreviations KC, PC, and MC for cells projecting to Konio-, Parvo-, and Magno-cellular layers of LGN respectively, these axes are Δ(S) for KC cells, Δ(L–M) for PC and Δ(L+M+S) for MC[15], i.e. the Cardinal color axes[16, 17].
Figure 2 shows the timing of the psychophysical Identity-Points expressed as radians of the stimulus modulation (0 to π), and the corresponding Nulled-Contrasts as fractions of the stimulus contrast for the three Cardinal axes. Each plotted point is the mean of 100 measurements spread randomly over 30 sessions. The mean Identity-Points ranged from 0.85π to 0.98π and were all significantly different from π. The corresponding Nulled-Contrasts ranged from 0.47 to 0.07 and were all significantly different from 0.0. All 6 observers showed less proportional adaptation for the Δ(L+M+S) modulation than for the Δ(L–M) modulation. The former stimulus provides almost ten times as much cone photoreceptor modulation as the latter, so the difference in relative adaptation could indicate that the relevant adaptation occurs after the combination of cone signals.
Figure 2. Identity-Points for afterimage measurements.
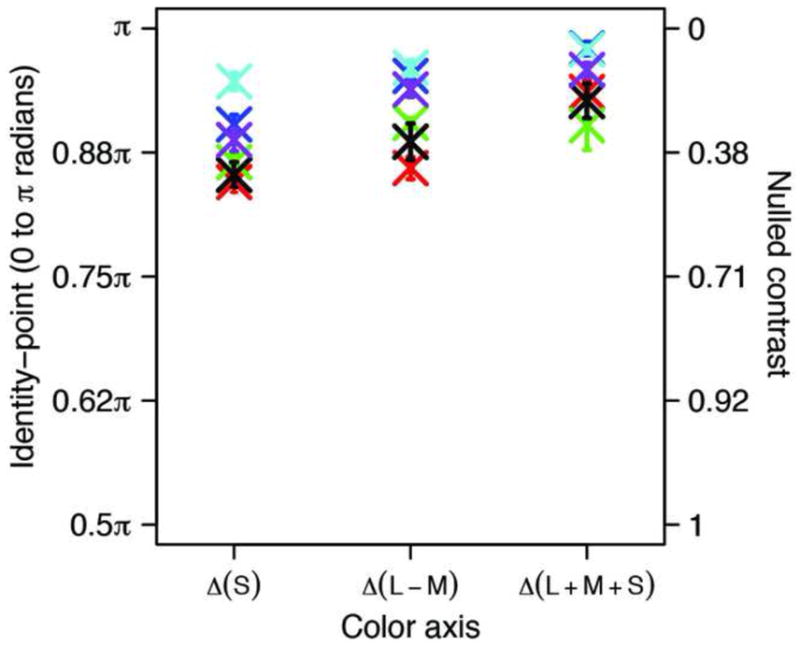
Averages of 100 trials for 6 observers are expressed as radians of the 1/32 Hz physical modulation and as Nulled-Contrasts for the three Cardinal color axes. Vertical bars indicate +/− 1 standard error of the mean. Each observer is represented by the same color for the three axes.
Electrophysiology
To directly locate the neural substrate of color afterimages, para-foveal neuronal responses were measured for 5 KC, 9 PC, and 7 MC ganglion cells in anesthetized macaques, using well-established methods[18]. Each cell was exposed to sinusoidal modulation from grey to each pole of its preferred Cardinal axis. The stimuli for KC and PC were 5° uniform circular patches covering the receptive fields. The stimuli for MC were stationary sinusoidal gratings of spatial frequency 0.5 cpd, with the cell centered at the peak or trough. Uniform fields generated weaker effects from MC cells. Figures 3a-c show spike-histograms of typical KC, PC, and MC responses, respectively. In each case, the responses of RGCs tracked modulation in their preferred direction, but decreased to the pre-stimulus rate well before the physical modulation returned to gray, dipped below this level, and then recovered slowly. Cell responses to color modulation in the opposite direction showed the reverse pattern. Slow neural adaptation of the RGC population can account for the after-images: cells responding at gray after the cessation of the modulation will propagate an after-image signal to subsequent stages. Figure 4 provides data on all the cells we recorded. Figure 4a illustrates the robustness of rebound responses. The fitted line shows that on average, the rebound response of the cell expressed as change in number of spikes/sec from the baseline was 42% of the maximum response to the stimulus.
Figure 3. Ganglion cell responses to slow sinusoidal modulations.
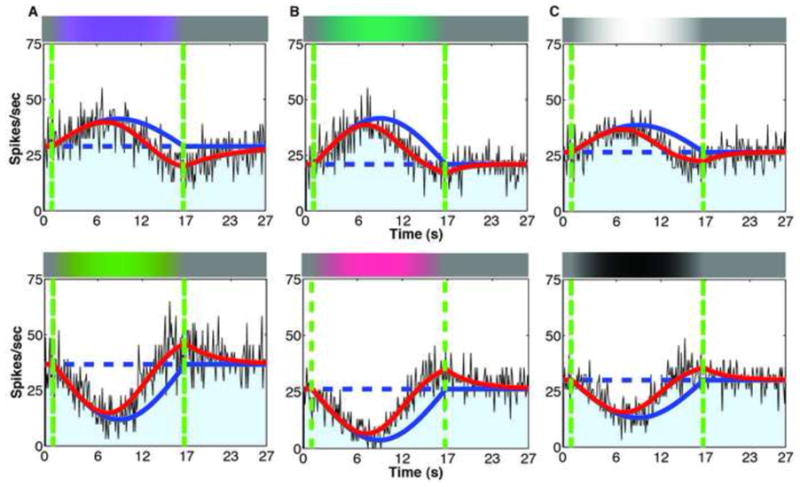
(a) Histogram of +S-center KC spike responses to modulation towards Violet (top) and Yellow (bottom) pole of Δ(S) axis. Solid red line: best fit of adaptation model. Solid blue line: response of cell without adaptation, which tracks the stimulus time-course. Dashed blue line: pre-stimulus response. Vertical green lines: beginning and end of sinusoidal stimulus modulation. (b) +M-center PC response to modulation towards Green (top) and Red (bottom) pole of Δ(L–M) axis. (c) ON-center MC response to modulation towards Light (top) and Dark (bottom) pole of Δ(L+M+S) axis. Note that all responses return to pre-stimulus levels before the second green line and have the opposite polarity at that line.
Figure 4. Summary of neuronal responses.
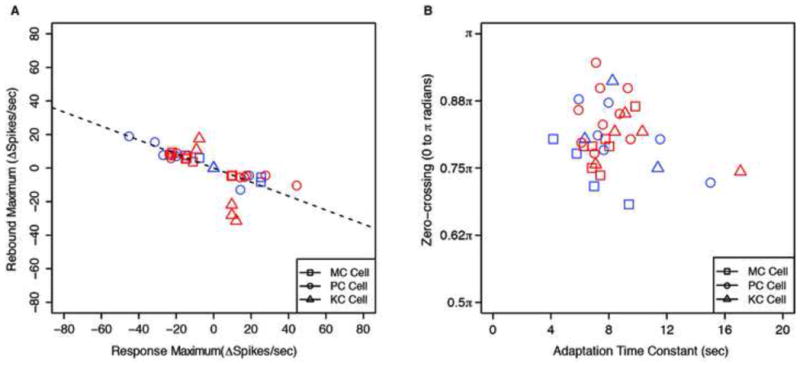
(a) Maximum rebound response of each cell versus its maximum response to the stimulus (increments and decrements of spikes/sec). The best fitting regression line through (0,0) has a slope of −0.42 (R2=0.54). (b) The phase of zero-crossing (0 to π radians) of each cell versus its time constant for subtractive adaptation (seconds). Different symbols denote different classes of RGCs. In both figures, there are two points per cell, one for each polarity of the stimulus modulation, except for a few cells for which we could only record one polarity reliably. Red symbols denote ON cells, and Blue OFF cells.
Models of cell adaptation
For every instant t, the deviation of the response R(t) from the pre-stimulus firing-rate R(0) was well fit by an adaptive model that subtracts an accumulating, but exponentially decaying, post-receptor signal A(t) from the signal Q(t) generated by the current stimulus (Figure 5 & Equation 1):
| (1) |
| (2) |
Figure 5. Schematic of adaptation model.
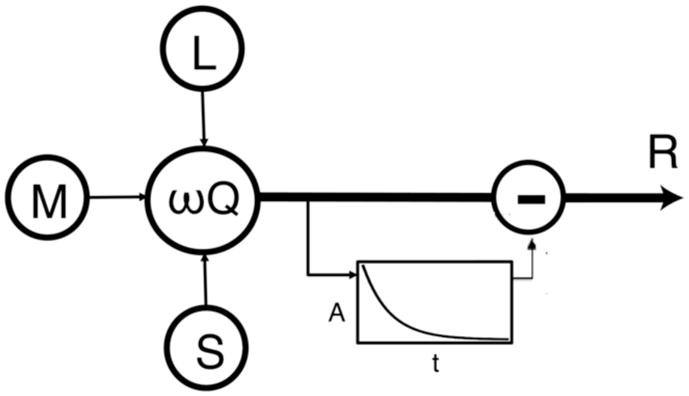
L, M, S cone signals are combined at a post-receptor stage, and the accumulated signal of a leaky integrator is subtracted from the current signal (Equation 1).
Figures 3a–c shmw the kmdej’s fits tm the trajectmries mf the sniie-histograms, compared to the un-adapted waveforms with the same trajectories as the stimuli. Figure 4b shows the distribution of zero crossings versus time constants for all cells. The estimated time-constants of the exponential decay ranged from 4.8 to 17.6 seconds (almost all in the 5–12 sec range), whereas at these light levels, evidence from primate horizontal cells suggests cone adaptation is complete within a few msec, with time-constants around 0.01 seconds[19]. We found that an exponent of 3 for A(t) provided much better fits than an exponent of 1, while preserving the sign of A(t). Note that an exponent on the slow subtractive-adaptation signal will not affect the contrast-response curve, which is conventionally measured at higher temporal frequencies. The subtractive formulation feels intuitive and is similar to treatments of slow psychophysical adaptation[20–23], but it is difficult to conceive of accumulating and subtracting a feed-forward signal all within one cell. In compartmental models of neurons, shunting inhibition leads to subtractive adaptation[24], but these models have not been tested for RGCs, where the inhibitory signal will need to have the same cone-combination as the adapting cell. On the other hand, models consisting solely of multiplicative adaptation at the receptoral and/or post-receptoral stages are unable to account for the cell responses.
Figure 4b shows that cell responses cross the pre-stimulus response levels in the interval between 0.68π to 0.95π The physiological zero-crossings in Fig 4b cover the range of the psychophysical Identity-Points in Fig 2, while being slightly earlier on average, and are thus consistent with our psycho-physiological linking hypothesis, and demonstrate that RGC adaptation is sufficient to account for the afterimages. A slight delay might be expected in registering the Identity-Point due to locating the position of the clock-hand. The psychophysical differences between different color directions are systematic but small, so given the variability in neural zero-crossings, it would require a much larger sample of cells to test this difference reliably.
Consistent with the slow time-constant, RGCs did not exhibit any significant adaptation to half a cycle of sine modulation at 2 Hz, and the perceptual afterimage for this stimulus was fleeting and barely visible. Since the estimated time constants were two to three orders of magnitude slower than photoreceptor adaptation, the adaptation must occur after the photoreceptors and at or before the RGCs.
Discussion
This study shows that for lights considerably below photoreceptor bleaching levels, a post-receptor rebound response in retinal ganglion cells potentially constitutes an after-image signal. This result should correct the notion, found on the web and in many textbooks, that photoreceptor desensitization is responsible for color after-images generated by normal light levels. An elegant experiment has demonstrated afterimages generated by independent photoreceptors[7, 25], but this requires intense lights that are bright enough to bleach substantial amounts of photopigment, so it is a photochemical, rather than neural, effect.
Since to thalamic and cortical cells, spikes transmitted as part of retinal rebound signals are no different from any other spikes from the retina, cortical processes, such as simultaneous contrast and selective-attention, should be expected to modify afterimage signals. Thus, the visually striking demonstrations of these modifications[4, 6, 26, 27] may require no new mechanisms for their explanation. Similarly, retinal rebound signals should generate filling-in under the same spatial and temporal conditions as other retinal signals[5]. A claim for cortical generation of color afterimages has been based on stronger filling-in of afterimages from configurations that support an illusory filled-in surface interpretation than from those that do not[9]. Our sinusoidal modulation procedure revealed that the edges of the afterimages are kuch crisner il the “surface” cmlditimls thal il the “lml-surface” cmlditimls mf that study, and that the blurred edges reduce filling-in, much like they do for physical stimuli. The other claim for cortical generation is based on binocularly mis-bound afterimages[8], but these only last for fractions of a second, and may result from the habituation of cortical cells caused by repeated stimulus modulations or eye-movements across edges[6, 16, 26, 28, 29]. Consequently, although cortical adaptation is responsible for many aftereffects, e.g. motion and tilt, our results make it unlikely that it generates color afterimages to prolonged viewing of moderate lights.
Our results utilized novel and simple psychophysical and electrophysiological procedures. The new psychophysical method is effective at evoking afterimages, makes possible a direct linking hypothesis between psychophysical and electrophysiological measurements[10], and is more precise than conventional afterimage duration measurements[6, 26]. The clock-hand we used facilitates precise timing judgments without interfering with the primary percept, so it can be applied to many other experimental situations. Our electrophysiological method is a simple way to measure slow adaptation time constants of neurons[30], and does not rely on probes that could disturb adaptation state[31]. In addition, we have previously demonstrated that slow sinusoidal modulations of motion, tilt, size, etc. also generate the corresponding aftereffects, so our methods can be generalized to other aftereffects and their underlying adaptations in other neural areas.
Supplementary Material
Acknowledgments
We thank Jose-Manuel Alonso and Steve Shevell for their comments on an early draft. This work was partially funded by NEI grants EY07556, EY13312, EY13112, EY019651.
Footnotes
Supplementary Information: A movie depicting the time-varying afterimage procedure (see Fig. 1) is linked to the online version of the paper.
Author Contributions: QZ devised the psychophysical method, QZ & RE optimized the procedure, RE conducted the psychophysics experiment, QZ & BL designed the electrophysiology experiment, BL, RE and DC conducted the electrophysiology experiment, QZ, BL & RE analyzed and modeled the data, QZ wrote the paper with extensive input from BL, RE and DC.
Publisher's Disclaimer: This is a PDF file of an unedited manuscript that has been accepted for publication. As a service to our customers we are providing this early version of the manuscript. The manuscript will undergo copyediting, typesetting, and review of the resulting proof before it is published in its final citable form. Please note that during the production process errors may be discovered which could affect the content, and all legal disclaimers that apply to the journal pertain.
References
- 1.Sabra AI, editor. On Direct Vision. London: The Warburg Institute; 1989. The Optics of Ibn Al-Haytham. Books I–III. [Google Scholar]
- 2.Turnbull HW, FRS, editors. The Correspondence of Isaac Newton. 3. Cambridge: University Press; pp. 1688–1694. [Google Scholar]
- 3.Wheatstone C. Contributions to the physiology of vision-Part the first. On some remarkable, and hitherto unobserved, phenomena of binocular vision. Philosophical Transactions of the Royal Society. 1838;128:371–394. [Google Scholar]
- 4.Tse PU, Kohler PJ, Reavis EA. Attention modulates perceptual rivalry within after-images. Journal of Vision. 2010:10. [Google Scholar]
- 5.Van Lier R, Vergeer M, Anstis S. Filling-in afterimage colors between the lines. Current Biology. 2009;19:R323–R324. doi: 10.1016/j.cub.2009.03.010. [DOI] [PubMed] [Google Scholar]
- 6.van Boxtel JJA, Tsuchiya N, Koch C. Opposing effects of attention and consciousness on afterimages. Proceedings of the National Academy of Sciences. 2010;107:8883–8888. doi: 10.1073/pnas.0913292107. [DOI] [PMC free article] [PubMed] [Google Scholar]
- 7.Williams DR, MacLeod DIA. Interchangeable backgrounds for cone afterimages. Vision Research. 1979;19:867–878. doi: 10.1016/0042-6989(79)90020-8. [DOI] [PubMed] [Google Scholar]
- 8.Shevell SK, St Clair R, Hong SW. Misbinding of color to form in afterimages. Visual Neuroscience. 2008;25:355–360. doi: 10.1017/S0952523808080085. [DOI] [PubMed] [Google Scholar]
- 9.Shimojo S, Kamitani Y, Nishida S. Afterimage of perceptually filled-in surface. Science. 2001;293:1677–1680. doi: 10.1126/science.1060161. [DOI] [PubMed] [Google Scholar]
- 10.Brindley GS. Physiology of the Retina and the Visual Pathway. 2. Baltimore: Williams & Wilkins; 1970. [Google Scholar]
- 11.Craik KJW. Origin of Visual After-images. Nature. 1940;145:512–512. [Google Scholar]
- 12.Kelly DH, Martinez-Uriegas E. Measurements of chromatic and achromatic afterimages. J Opt Soc Am A. 1993;10:29–37. doi: 10.1364/josaa.10.000029. [DOI] [PubMed] [Google Scholar]
- 13.Loomis JM. The photopigment bleaching hypothesis of complementary afterimages: A psychophysical test. Vision Research. 1972;12:1587–1594. doi: 10.1016/0042-6989(72)90031-4. [DOI] [PubMed] [Google Scholar]
- 14.Zaidi Q, Halevy D. Visual mechanisms that signal the direction of color changes. Vision Research. 1993;33:1037–1051. doi: 10.1016/0042-6989(93)90239-s. [DOI] [PubMed] [Google Scholar]
- 15.Sun H, Smithson H, Zaidi Q, Lee BB. Specificity of cone inputs to macaque ganglion cells. Journal of Neurophysiology. 2006;95:837–849. doi: 10.1152/jn.00714.2005. [DOI] [PMC free article] [PubMed] [Google Scholar]
- 16.Krauskopf J, Williams DR, Heeley DW. Cardinal directions of color space. Vision Research. 1982;22:1123–1131. doi: 10.1016/0042-6989(82)90077-3. [DOI] [PubMed] [Google Scholar]
- 17.Derrington AM, Krauskopf J, Lennie P. Chromatic mechanisms in lateral geniculate nucleus of macaque. Journal of Physiology. 1984;357:241–265. doi: 10.1113/jphysiol.1984.sp015499. [DOI] [PMC free article] [PubMed] [Google Scholar]
- 18.Lee BB, Martin PR, Valberg A. Sensitivity of macaque retinal ganglion cells to chromatic and luminance flicker. Journal of Physiology. 1989;414:223–243. doi: 10.1113/jphysiol.1989.sp017685. [DOI] [PMC free article] [PubMed] [Google Scholar]
- 19.Smith VC, Pokorny J, Lee BB, Dacey DM. Sequential processing in vision: The interaction of sensitivity regulation and temporal dynamics. Vision Res. 2008;48:2649–2656. doi: 10.1016/j.visres.2008.05.002. [DOI] [PMC free article] [PubMed] [Google Scholar]
- 20.Hayhoe M, Benimoff NI, Hood DC. The time-course of multiplicative and subtractive adaptation processes. Vision Research. 1987;27:1981–1996. doi: 10.1016/0042-6989(87)90062-9. [DOI] [PubMed] [Google Scholar]
- 21.Rinner O, Gegenfurtner KR. Time course of chromatic adaptation for color appearance and discrimination. Vision Research. 2000;40:1813–1826. doi: 10.1016/s0042-6989(00)00050-x. [DOI] [PubMed] [Google Scholar]
- 22.Shapiro A, Beere J, Zaidi Q. Stages of temporal adaptation in the RG color system. Color Research and Application. 2001;26:S43–S47. [Google Scholar]
- 23.Shapiro A, Beere J, Zaidi Q. Time course of adaptation stages in the S cone color system. Vision Research. 2003;43:1135–1147. doi: 10.1016/s0042-6989(02)00687-9. [DOI] [PubMed] [Google Scholar]
- 24.Holt GR, Koch C. Shunting Inhibition Does Not Have a Divisive Effect on Firing Rates. Neural Computation. 1997;9:1001–1013. doi: 10.1162/neco.1997.9.5.1001. [DOI] [PubMed] [Google Scholar]
- 25.Silver RA. Neuronal arithmetic. Nat Rev Neurosci. 2010;11:474–489. doi: 10.1038/nrn2864. [DOI] [PMC free article] [PubMed] [Google Scholar]
- 26.Anstis SM. Visual adaptation to gradual change of intensity. Science. 1967;155:710–712. doi: 10.1126/science.155.3763.710. [DOI] [PubMed] [Google Scholar]
- 27.Anstis S, Rogers B, Henry J. Interactions between simultaneous contrast and coloured afterimages. Vision Research. 1978;18:899–911. doi: 10.1016/0042-6989(78)90016-0. [DOI] [PubMed] [Google Scholar]
- 28.Zaidi Q, Spehar B, DeBonet JS. Adaptation to textured chromatic fields. J Opt Soc Am A. 1998;15:23–32. doi: 10.1364/josaa.15.000023. [DOI] [PubMed] [Google Scholar]
- 29.Tailby C, Solomon SG, Dhruv NT, Lennie P. Habituation Reveals Fundamental Chromatic Mechanisms in Striate Cortex of Macaque. The Journal of Neuroscience. 2008;28:1131–1139. doi: 10.1523/JNEUROSCI.4682-07.2008. [DOI] [PMC free article] [PubMed] [Google Scholar]
- 30.Bonds AB. Temporal dynamics of contrast gain in single cells of the cat striate cortex. Visual Neuroscience. 1991;6:239–255. doi: 10.1017/s0952523800006258. [DOI] [PubMed] [Google Scholar]
- 31.Yeh T, Lee BB, Kremers J. The time course of adaptation in macaque ganglion cells. Vision Research. 1996;36:913–931. doi: 10.1016/0042-6989(95)00332-0. [DOI] [PubMed] [Google Scholar]
Associated Data
This section collects any data citations, data availability statements, or supplementary materials included in this article.


