

Abstract
Carbon nanotubes are a promising platform across a broad spectrum of applications ranging from separations technology, drug delivery, to bio(electronic) sensors. Proper dispersion of carbon nanotube materials is important to retaining the electronic properties of nanotubes. Experimentally it has been shown that salts can regulate the dispersing properties of CNTs in aqueous system with surfactants (J. Am. Chem. Soc., 2009, 131:1144–1153); details of the physico-chemical mechanisms underlying such effects continue to be explored. We address the effects of inorganic monovalent salts (NaCl and NaI) on dispersion stability of carbon nanotubes. We perform all-atom molecular dynamics simulations using non-polarizable interaction models to compute the potential of mean force between two (10,10) single-walled carbon nanotubes (SWNTs) in the presence of NaCl/NaI and compare to the potential of mean force between SWNTs in pure water. Addition of salts enhances stability of the contact state between two SWNT’s on the order of 4 kcal/mole. The ion-specific spatial distribution of different halide anions gives rise to starkly different contributions to the free energy stability of nanotubes in the contact state. Iodide anion directly stabilizes the contact state to a much greater extent than chloride anion. The enhanced stability arises from the locally repulsive forces imposed on nanotubes by the surface-segregated iodide anion. Within the timescale of our simulations, both NaI and NaCl solutions stabilize the contact state by equivalent amounts. The marginally higher stability for contact state in salt solutions recapitulates results for small hydrophobic solutes in NaCl solutions (Athawale et al, J. Phys. Chem. B., 112, 5661. 2008) as well as single walled carbon nanotubes in NaCl and CaCl2 aqueous solutions.
Keywords: single-walled nanotubes, hydrophobic effect, specific-ion effects, molecular dynamics simulation
I. INTRODUCTION
The assembly and aggregation of hydrophobes is inherent in a wide variety of fundamental and industrial processes1–7. Controlling assembly (either preventing it or exploiting it to create extended structures) often requires the addition of solubilizing intermediates. In the case of single-walled nanotubes (SWNTs), recent experimental and theoretical/modeling efforts have focused on introducing surfactants or surfactant-like species to prevent the assembly/aggregation of SWNT’s in solution1,2,8,9. A recent study has begun to explore the effects of mono-valent, inorganic ions on SWNTs in solution1. In particular, Frolov et al1 study the nature of interactions between different ions and SWNT’s using molecular simulations in order to explore specific ion effects in the context of these industrially relevant systems. In a biological context, specific ion effects such as those observed by Hofmeister10–16 relating to the “salting-in” and “salting-out” of proteins in aqueous electrolyte solutions of varying ionic species and concentrations have been pursued from theoretical, modeling, and experimental approaches for decades; studies continue to probe the fundamental phenomenology of this effect11–13,16–38.
In the context of single-walled carbon nanotubes (SWNT) in aqueous solutions, very few simulation studies have probed the effects of inorganic ions and their interactions with the SWNT’s as they relate to the free energetics of assembly in solution. As addressed above, SWNT’s display a propensity to aggregate in aqueous solution in the absence of dispersants. Current technological approaches to prevent aggregation and self-assembly generally involve addition of surfactant-like dispersants. These additional molecules effectively present a barrier for close contact between SWNT’s, thus affording some control of aggregation behavior. Recent studies have explored the consequences of addition of inorganic ions as co-dispersants. Salts are also shown to have significant effects on regulating dispersing properties of carbon nanotubes in aqueous solutions stabilized by surfactants39,40. In their study, without adding any cosurfactant, the use of metal chloride salts leads to a reduction in internanotube interactions.
With the plethora of future applications of carbon nanotube materials rapidly being realized and exploited, we consider fundamental studies of structural, dynamic, and energetic properties of model single-walled carbon nanotubes in pure water and in aqueous solutions of simple inorganic salt, sodium chloride (NaCl) and sodium iodide (NaI). The present study probes the effects of such simple inorganic salt solutions on the energetics of assembly in such systems, and provides a reference point from which to consider systems where salts are used in combination with larger dispersants (i.e., surfactants, polymers, etc.) in order to affect desired physical behaviors leading to desired physical properties and structures. To our knowledge, there are few other studies probing the nature of interactions of ions with SWNTs in the context of the effects of ions on the energetics of assembly. Our intent in this paper is to investigate the effects arising from different inorganic salts on tube bundling formation with the mechanistic point of view.
This study is organized as followed. In Section II we discuss the force fields and computational details. Our results are presented in Section III and are organized into three topics. We start with examining the density of water molecules and ions at the water-tube interface in Section IIIA. In Section III B we consider potential of mean force for nanotube association and the contribution from each component. We further investigate the thermodynamic mechanism by decomposing the potential of mean force into enthalpic and entropic contributions in Section IIIB3. We conclude our study in Section IV with a summary of our findings and general discussion.
II. METHODS
Molecular dynamics simulations were performed using the CHARMM molecular simulation package.41 We chose to perform canonical ensemble (NVT) simulations using the geometry shown in Figure 1; the central simulation cell consists of two liquid-vapor interfaces. This geometry allows the solvent density to relax in response to the presence of the SWNT’s. With respect to calculation of potentials of mean force, to be discussed further below, the methodology adopted in this work has been shown to reproduce the results for large hydrophobe association free energetics using constant pressure molecular dynamics simulations42. Temperature was maintained at T = 300K using a Nosé-Hoover thermostat.43 The simulation cell was rectangular with dimensions of Lx = 40 Å, Ly = 40 Å and Lz = 150 Å, in which z is the direction normal to the LV interface. Two (10,10) single wall carbon nanotubes are parallel and oriented along the x-direction. The SWNTs are constructed with the Nanotube Modeler package44. Each (10,10) SWNT it is comprised of 400 carbon atoms with the bond length of 1.421 Å.45 The diameter (D) and the length (l) of each tube are 13.56 Å and 24.0 Å, respectively. Throughout the simulation the positions of all tube atoms were fixed. The Lennard-Jones (LJ) parameters of the tube atoms were ε = 0.0663 kcal/mol, Rmin = 4.0195 Å; however, the interactions among atoms on the same tube were excluded. The water-carbon interactions were fixed to be εij = 0.1015 kcal/mol, Rmin = 3.7793 Å. These parameters are adopted from previous studies46, which have been validated to model hydrophobic effects in understanding the nature of surface friction in nanoscale fluid transport. Although the addition of a water hydrogen-tube LJ interaction may influence the structure of water near the tubes, the inclusion of this term seems arbitrary as the water model used in this study and many other previous study 17,42,47–50 do not include LJ interactions. For two SWNT’s in pure water, a bulk slab consisting of 4800 water molecules, which are represented by the extended simple point charge (SPC/E) model51, results in two liquid-vapor interfaces. To generate 3 M salt solutions, 504 water molecules were replaced randomly with 252 pairs of anions and cations (yielding a final system of 4296 SPC/E water molecules, 252 anions, 252 cations). The molar concentrations used throughout this work are only approximate concentrations since they depend on the actual physical volume of the solution, which fluctuates slightly since there are liquid-vapor interfaces. The actual molality (moles of ion over the mass of water) of both 3 M solutions is 3.255 mol kg−1; we retain the approximate molar concentrations for convenience. We discuss the choice of this specific value of the concentration in the Supporting Information (SI). Representative snapshots of a 3 M NaCl system are shown in Figure 1. In order to obtain the potential of mean force (PMF) as a function of the separation between two SWNTs, we define a reaction coordinate, d, as the distance between the center of the tubes (i.e., the distance between the center axes of the tubes). In this study we sample more than 40 separations/windows between 16.4 Å and 26.0 Å center of mass distance.
FIG. 1.

Representative snapshots of the 3 M NaCl system used in this study; separation (d) is 26.0 Å, which is defined by the distance between the center axes of the tubes. The diameter (D) and the length (l) of each tube are 13.56 Å and 24.0 Å, respectively. Atom types can be distinguished by the following color code: O (red), H (white), Cl− (green), Na+(gray), tube atoms (blue). (a) Side profile showing the relative solvation of the tubes in the normal and lateral directions. Projection of unsolvated tubes on (b) y − z and (c) and x − z plane. Dashed rectangular boxes in (b) and (c) define the confined region used in following analysis. The definition of the dimensionalities (L,W,H) is given in the text. Snapshots are visualized using Visual Molecular Dynamics (VMD) program69.
For the SPC/E water the LJ parameters are εOO = 0.1554 kcal/mol, Rmin = 3.5537 Å and are assigned only to the oxygen atom of water. Point charges of oxygen and hydrogen atoms are qO = −0.8476e and qH = +0.4238e, respectively. Ions were treated as non-polarizable particles with interaction parameters based on those by Fyta et al52 which have been shown to reproduce experimental solvation free energies and the osmotic coefficients. All the LJ parameters are summarized in Table I.
TABLE I.
Parameters used in the simulation.
| Rmin (Å) | ε (kcal/mol) | q (e) | |
|---|---|---|---|
| O | 3.5537 | 0.1554 | −0.8476 |
| Cl− | 4.9340 | 0.1 | −1 |
| I− | 5.9872 | 0.0377 | −1 |
| Na+ | 2.9004 | 0.1 | 1 |
| Tubea | 4.0195 | 0.0663 | 0 |
The LJ parameters for oxygen-tube interaction are fixed to be εij = 0.1015 kcal/mol, Rmin = 3.7793 Å.
The non-bond interactions were treated via the standard Lennard-Jones “12-6” potential
| (1) |
The parameters of ion-tube and ion-water interactions were determined by the combination rules:
| (2) |
Lennard-Jones interactions were gradually switched off at interparticle distance of 12Å, with a gradual switching between 11Å and 12Å using the switching function:
| (3) |
In considering the force field to use for this study, our philosophy is to attempt to apply models developed and validated to some degree based on considerations of the hydration free energy of ions in pure water. We believe that consideration of ionic solutions requires attention to this chemical aspect of the physics of these systems. We acknowledge that the precise absolute values of hydration free energies are fraught with assumptions necessarily arising from the inseparability, in reality, of electroneutral anion-cation pairs. Furthermore, the nature of the water-hydrophobe interface is also critical when considering simulations of the nature presented here, and within this context, we have chosen force fields that, again, have been validated with the nature of this interface in mind.
Conditionally convergent long-range electrostatic interactions were treated using Particle Mesh Ewald (PME)53 approach with a 40 × 40 × 150 point grid and κ = 0.330. SHAKE54 was used to maintain the rigid geometry of each water molecule. Dynamics were propagated using a Velocity-Verlet integrator with a 1.0 fs timestep under 3D periodic boundary conditions. The sampling time for each window was at least 11 ns with 3 replicates. Properties were calculated from all but the first 1 ns, which was treated as equilibration, resulting in more than 30 ns per window for data analyses.
III. RESULTS AND DISCUSSION
A. Density Profile
In order to show the spatial distribution of solvent as influenced by the SWNTs, we compute radial number density profiles of water molecules and ions about the tube. We restricted sampling for these profiles to a half cylinder on the side of the tube extending into the bulk solution. This prevents sampling between the SWNTs, where the distributions will contain interference effects from the other tube. After each half cylinder is considered (for each tube) the symmetry of the two-tube system allows us to combine the sampling volumes into a full cylinder. Also, we limited the length of the sampling cylinder to −l′ ≤ x ≤ l′ (l′ = 11.0 Å), which is shorter than the tube length. Although being slightly reduced from the true length of the tube, it can avoid artifacts arising from the edge of the tubes. So the radial density profiles (ρ(r)) can be written as:
| (4) |
i is the atomic/molecular species, Ni is the corresponding number of species i within the region r − dr/2 to r +dr/2. Figure 2 shows the radial density profiles of water oxygen atoms and ions as a function of r which is relative to the center of the tube axes (at r = 0.0Å). In Figure 2a, all the values are scaled by dividing by ρbulk = 0.0334Å−3, which is the density of water molecules in pure SPC/E bulk. The radial density profiles for pure water (solid line), water in 3M NaCl (dashed line), and water in 3M NaI (dot-dashed line) are qualitatively similar. Water density is enhanced in the vicinity of the tube, both inside and outside the tube, and follows the trend of ρwater,pure > ρwater,NaCl > ρwater,NaI, as presented in the insets of Figure 2a. For the region outside the tube (r > 9.0 Å), we observe that the pure SPC/E system has higher number density throughout the profile, which is not surprising, since there are more water molecules in the pure SPC/E system. However, unlike the significant difference between ρwater,pure and ρwater,NaI from the first layer (~ 10.1 Å), the difference between ρwater,pure and ρwater,NaCl becomes larger at the second layer (~ 13.0 Å). These differences are largely influenced by ion density in the vicinity of the tube surface as well as in bulk solution. We address this next. Figure 2b shows the actual radial density profiles of ions. Iodide in 3M NaI solution (dashed line) shows significant enhancement adjacent to the tube-water interface and tends to show anisotropic solvation structure near the hydrophobe50,55, subsequently displacing water near the tubes and resulting in the reduced water density in the NaI solution. The reduced water density correlates with the enhanced iodide anion density. These qualitative behaviors conform to previously reported behavior of this particular iodide anion model to slightly favor the hydrophobic liquid-vapor interface. Chloride ion is not as enhanced near the tube at small r, thus explaining the similarity between water number density profiles in pure water and NaCl solution. However, owing to the increased density of Cl− around 13.5 Å separation, ρwater,NaCl eventually decreases, converging with ρwater,NaI. It is not surprising that these ions show such significant differences near the surfaces. Many studies of alkali-halides at the liquid-vapor interface demonstrate the tendency for large ions such as iodide to be expelled from bulk water to the interface/surface while smaller ions remain fully hydrated.18,19,56,57 While the iodide is expelled from the bulk, the increased water density at the tube-water interface accommodates more expelled iodide through direct interactions (dispersion and electrostatic) between the iodide and water. We also notice that although we use Na+ as cations in both salt solutions, the magnitude of the radial density profiles are significantly different; Na+ in the NaI solution is enhanced in the vicinity of the tube relative to in NaCl. This behavior will be addressed later in this manuscript.
FIG. 2.

Radial number density profiles of (a) water molecules and (b) ions at d = 19.4 Å. For panel a, all the values are scaled with ρbulk = 0.0334 Å−3 (the density of water molecules in bulk for pure SPC/E). Insets focus on the number density in the vicinity of the tube wall. For panel b, all the values are the actual densities of ions in bulk for 3 M solutions. Inset in panel b highlights the bulk densities of anions.
For the intra-tube region, taken to be the region inside the tube (r < 4.0 Å), we observe that near the very center of the tube, ρwater,pure shows the lowest density among the three systems. The average number of intra-tube water molecules (〈Nintra–tube,water〉), anions (〈Nintra–tube,anion〉) and cations (〈Nintra–tube,cation〉) are summarized in Table II. These values are calculated as direct averages of the number of species in the tube normalized by the number of observations. Alternatively, though not done here, one can integrate the radial density profiles to obtain the equivalent value. Uncertainties included in the parentheses are determined from the standard deviations of 〈Nintra–tube〉. The average number of intra-tube water molecules is greatest for the pure SPC/E system and least for the NaI solution; we attribute the latter observation to an increased number of intra-tube ions/ion pairs which displace water molecules from this intra-tube volume. However, since the number of intra-tube ions is low (about or less than one ion pair within the tube per snapshot), the number of intra-tube water molecules does not vary much among the systems.
TABLE II.
Average number of water molecules, anions and cations within the tube. Values in parentheses denote the uncertainty in the last reported digit as determined from the standard deviation.
| System | 〈Nintra–tube,water〉 | 〈Nintra–tube,anion〉 | 〈Nintra–tube,cation〉 |
|---|---|---|---|
| Pure SPC/E | 51.10(15) | – | – |
| 3 M NaCl | 50.32(22) | 0.24(12) | 0.66(16) |
| 3 M NaI | 49.02(52) | 0.47(15) | 1.07(16) |
In order to investigate the behavior of water molecules and ions within the inter-tube region, we define a rectangular sampling volume, as illustrated in Figure 1b and c. We emphasize that the inter-tube region only includes the region between tubes, excluding the region inside the tubes. The length (L) of the box is along the x-axis and identical with the cylinder used to sample for the radial density profiles, which makes L = 22.0 Å; the width (W) is along the z-axis and determined by subtracting from the tube separation (d) with the tube diameter (D = 13.56 Å). Finally, the height (H) equals D–2 Rmin,OC and projects along the y-axis. The choice of this sampling region is not unique; we provide further analysis and an alternative scheme in the supporting information. Results are self-consistent using both sampling volumes. The average numbers of water oxygen atoms (〈Ninter–tube,water〉), anions (〈Ninter–tube,anion〉) and cations (〈Ninter–tube,cation〉) in the rectangular box as functions of d are shown in Figure 3. From Figure 3a and the inset, the number of inter-tube region water molecules in NaI solution is ostensibly less compared to that in the NaCl and pure water systems. This correlates with the water densities in the outer regions. We also notice that at d ~ 19.4 Å and 22.0 Å, 〈Ninter–tube,water〉 shows dramatic increases, indicating energy barriers around these intertube separation, which will be discussed in detail in the next section.
FIG. 3.

Average number of (a) water molecules, (b) anions, and (c) cations of the confined region in pure water and 3 M NaX (X = Cl, I) solutions. Insets in panel a show focused view of the density peaks.
In Figure 3b we observe that iodide, despite being the larger ion (based on van der Waals dimension as well as considering the single ion in its bulk-solution extended solvation shell), enters this region at lower separation distances (21.0 Å) than chloride (21.6 Å) (density map shown in supporting information). This is attributed to the stronger solvation of chloride (more favorable absolute hydration free energy compared to iodide) which would prevent it from entering this region without significant room to accommodate its hydrating waters. Despite the fact that same cation is used in both salt solutions, the sodium density is noticeably higher outside the tube (Figure 2c) and within the tube (Table II) in the NaI solutions. Interestingly, the features of the sodium ions qualitatively mimic those of the corresponding anions. This increased affinity of Na+ suggests some extent of ion pairing that works to raise the stability of the ions in each region. Ottosson et al. observed a similar enhancement of sodium density in NaI solutions (relative to those of NaCl solutions) in their study of ions at the air-water interface58 and attributed this difference to the need for cation density to balance the adsorbed anion density.
B. Potential of Mean Force
1. Potential of Mean Force for Nanotube Association
The effect of inorganic ions on the free energetics of nanotube association is now considered. The potential of mean force (PMF) for nanotube association following a reaction coordinate that brings the parallel-oriented tubes from an infinite-separation, dissociated state to the associated, contact state is calculated directly from the average forces acting on a tube:
| (5) |
where ξ is the reaction coordinate taken as the separation distance between the center of mass of the two SWNTs. We consider the average of forces 〈F(ξ)〉 acting on each SWNT over the sampled configurations at each separation distance; the average force used in the integration is the average of the values for the two SWNTs after negating the forces acting on the SWNT located in the negative z-region of the simulation cell. All profiles of the PMF are shifted such that W(ξdissociated) = 0 kcal/mol. We show the PMFs for pure SPC/E and 3 M salt solutions in Figure 4. Numerical results are summarized in Table III and denote the difference in PMF from dissociated state to the global minimum:
| (6) |
where ξcontact ~ 16.9 Å (position of tube contact minimum) and ξdissociated = 26.0 Å (dissociated distance). PMF results are shown in Figure 4a. The error bars are obtained from standard deviations between three independent replicates. For clarity, in the inset of Figure 4a, which shows the minimum region of the profiles near the contact distance, we applied a vertical offset of +2 kcal/mol for the case of 3 M NaI.
FIG. 4.

(a) Total potential of mean force for tube association in pure SPC/E, 3 M NaCl, and 3 M NaI solutions. The inset shows the minimum region of the profiles. For clarity, in the inset a vertical offset of 2 kcal/mol is imposed for the case of 3 M NaI. The additional panels correspond to the decomposition of (b) water (c) anion and (d) cation contributions. The error bars are obtained from standard deviations among three independent replicates.
TABLE III.
Decomposition of potential of mean force into contributions from water, tubes, anions, and cations. All values for ΔW are calculated using Equation 6 and are expressed in kcal/mol. Values in parentheses denote the uncertainty in the last reported digit as determined from the standard deviation.
| System | ΔWtube | ΔWwater | ΔWanion | ΔWcation | ΔWtotal |
|---|---|---|---|---|---|
| Pure SPC/E | −62.17 | 17.14(6) | – | – | −45.03(6) |
| 3 M NaCl | −62.17 | 7.59(32) | 3.83(5) | 1.52(3) | −49.24(38) |
| 3 M NaI | −62.17 | 11.55(49) | 0.07(3) | 1.33(1) | −49.22(51) |
Addition of salts results in a more favorable PMF for tube association relative to pure SPC/E. The increase in stability is on the order of 4 kcal/mol. This difference, though statistically significant, is roughly 9% of the free energy well-depth in pure water. Whether this makes a substantital difference in the context of SWNT association in salt versus pure aqueous solutions is debatable as the difference is rather small. That this difference is small is consistent with the fact that both chloride and iodide anions reside near the center of the Hofmeister anion series; the differences from association in pure water are expected to be small. The salt solutions indicate a slightly higher stability of the contact state may be due to several reasons. The most direct is that the density of molecular species that contribute destabilizing forces to association is reduced in the case of the salt solutions. As shown in Figure 2a, water density in the salt solutions (both in the direct vicinity of the tubes as well as in the bulk solution at larger distances from the tubes) is non-trivially reduced. As will be discussed further below, the contribution from water in this region is destabilizing towards hydrophobe assembly; thus, reducing this effect, as well as increasing the stabilizing contributions from ions (to be discussed further below as well) lead to the overall increased stability of the contact state in the salt solutions. Furthermore, we consider fairly concentrated solutions in our study, ostensibly 3 M, thus providing a strong driving force for stabilization of the contact state; 1 M solutions (data not shown) exhibit essentially little or no enhanced stability of the contact state. Thus, by using the higher concentration in this study, we are able to dissect the influence of the different ions because the overall effect is sufficiently large. We return to issues of the conferred stability from density and spatial distribution effects in more detail below. We note a recent study demonstrating fast aggregation kinetics of single-walled nanotubes in millimolar concentration ranges of NaCl and CaCl2 59. Though the present concentration of salt is much higher than the concentrations probed in earlier studies, the present conditions are above what is termed the critical coagulation concentration (CCC in Reference59) at which point the aggregation kinetics of SWNT’s plateau to constant rates (diffusion limited in this fast range); we note that earlier studies of aggregation kinetics of SWNT’s model the process in the formalism of Derjaguin, Landau, Verwey, and Overbeek (DLVO) theory60,61. Our results recapitulate qualitative aspects of that model treatment in the high concentration limit.
Artifacts arising from simulation protocol may give rise to the observed enhanced contact-state stability. The potentials used in this study as well as the fact that long-range Lennard-Jones corrections are not included explicitly may be at play. With respect to the latter of the two effects just mentioned, one can envision that attractive forces from species separated from the tubes well beyond the cutoff distance will contribute to destabilizing the contact state by attracting (i.e. “pulling on”) the tubes. In order to semi-quantitatively investigate the effect of long-range forces, we re-analyzed the simulation trajectories in terms of the total forces on the tubes using longer cutoffs (again, only for the purpose of computing the force on the tubes); of course, the ensemble of states do not exactly correspond to the states one would encounter using explicit long-range contributions during the actual molecular dynamics simulations. This is similar to the semi-quantitative corrections applied by several groups to account for long-range corrections to the Lennard-Jones interaction during hydration free energy calculations62. The results are shown in detail in the supporting information, and we do not cover the details here. In summary, we find that the long-range forces for all systems (SWNT’s in pure water, NaI solution, and NaCl solution) contribute destabilizing forces (as one would expect) in all cases, and in roughly equivalent amounts. Thus, the PMF’s for all cases would be shifted to higher values for all systems. Importantly, the relative stability of the contact state in the three systems would not be changed (based on this analysis). We thus conclude that long-range effects are not the major contributor for the enhanced stability of the contact state in the salt solutions.
Finally, we note that the inversion of stability of the contact relative to pure water may result from inadequacy of the water-ion-tube potentials. If the combination of ion-water potentials predicts lower solution density compared to experimental data, the simulations will underestimate destabilizing forces arising from molecular species in the bulk. We do find that for the 1 M salt solutions (excluding SWNT’s) simulated using NPT (constant pressure and temperature) molecular dynamics calculations, the bulk aqueous salt solution densities are predicted to be lower than the experimental values at 298K and 1 atmosphere pressure conditions. The predicted densities for NaCl and NaI solutions are 1.019 g/mL and 1.094 g/mL, respectively. The experimental data are 1.04 and 1.11, respectively63.
2. Decomposition of PMF
We now explore contributions of individual species to the overall potential of mean force, and attempt to connect the nature of this contribution to spatial distributions of the individual atomic species. This is particularly relevant in order to connect the different properties of the halides, as embodied in their distributions relative to the hydrophobic species of interest in the context of specific-ion effects, to the particular contribution the ionic species makes to the stability of the contact state. We note that the difference in PMF’s between 3M NaI and 3M NaCl is small and within the associated uncertainty. To explore the origins of the differences in the potential of mean force, we determine individual contributions to the PMF as:
| (7) |
where each contribution is calculated from the forces on the tubes arising from each component and X−= Cl−,I−. Results are shown in Figure 4b–d respectively, the error bars are computed via the same method as the total PMF; numerical values are shown in Table III. Since the tube coordinates are fixed throughout the course of the simulation for each separation distance and the tube-tube interactions are the same in all systems, the tube contribution to the PMF is identical in all systems. Therefore, any differences in the PMF for our systems are solvent (water and ions) driven. We thus focus the remaining discussion and analyses on the effects of water and ions. Water represents the largest effective contribution (in magnitude) to the PMF, as shown in Table III and Figure 4b, the latter showing the water contributions to the PMFs in each system. In the case of pure SPC/E, the water contribution to the PMF has a global maximum (~ 19.4 Å) corresponding to the position of the desolvation maximum in the PMF curve, and a local maximum at ~ 21.8 Å, which have been expected from the discussion in Section IIIA. In consideration of describing the relationship between the structure of water and these barriers, the spatial density distribution of water oxygen atoms near the SWNTs is shown in Figure 5. Each density map is integrated over the reduced tube length (between ±11.0 Å) based on the previous discussion, and can be written as Equation 8:
| (8) |
where represents the number density of a given species i at position (x, y, z). The layers shown in each panel depict the fluctuations of radial density profile (in Figure 2) in a more intuitive way. In Figure 5a and b, the most evident difference happens at the very center of the region between the SWNTs. The white region, which corresponds to the first peak shown in the radial density profile of water, is “broken” at d = 19.3 Å and “connected” at d = 19.5 Å; similarly, the purple/pink region, which corresponds to the first minimum, “breaks” at d = 21.6 Å and “connects” at 22.0 Å. This behavior demonstrate that the energy barriers of PMF are modulated by the interference and reconstruction of water structures, which is also proposed by Li et al64. Alternatively, these distances correspond to dewetting events. The barriers in the water contribution (which transfer to the overall PMF curve) reflect the work needed to evacuate layers of water molecules in a manner that allows the remaining inter-tube volume to accommodate the particular numbers of water molecules. This behavior appears to be universal among explicitly non-polarizable water models which do not allow environment-dependent variation of molecular dipole moments or atomic partial charge distributions.
FIG. 5.
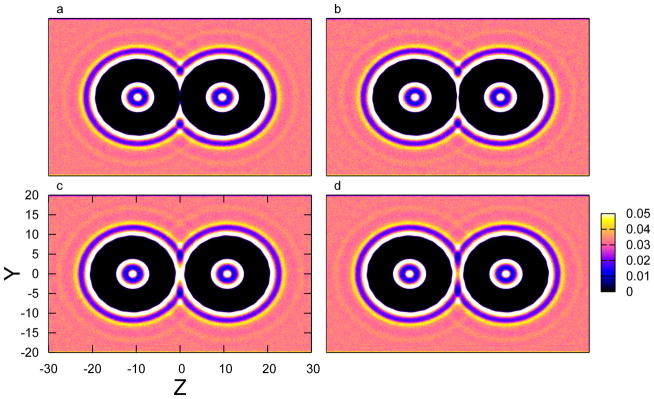
Density distribution of water molecules at location (y, z) around the carbon nanotubes, with the intertube separations (a) d = 19.3 Å (before first barrier), (b) d = 19.5 Å (after first barrier), (c) d = 21.6 Å (before second barrier), (d) d = 22.0 Å (after second barrier).
The contribution to the PMF from water in the pure SPC/E system is repulsive in general. This agrees with published work by Li et al64,65 on carbon nanoparticles in water, Choudhury and Pettitt’s work on graphene in water66, and Uddin et al on carbon nanotubes in water/surfactant systems67. The features (barriers and minima) of the water contribution in all systems are summarized in Table IV. Comparing the water contributions in the pure SPC/E and 3 M solutions, we observe that the destabilizing water contribution in 3 M NaCl and NaI solutions are reduced by 6 and 4 kcal/mol, respectively, at the second barrier (ΔWwater) occurring at tube separation of ~ 19 Å. The difference between the PMF at the local minimum at ~ 20.5 Å and the value of the dissociated distance ( ) is positive in pure SPC/E but negative in the salt solutions. Furthermore, the barriers in the water contribution at d ~ 22 Å and ~ 19 Å are systematically lower in the salt solutions compared to the pure water case. Admitting that the barriers arise from dewetting transitions, the barriers for the salt solutions are reduced as less water is involved. The profiles of water number at various inter-tube distances demonstrates the reduction in water in this volume.
TABLE IV.
Summary of key features from PMFs in Figure 4b. ΔWwater refers to the difference of water contribution (to the PMF) between global maximum and value at the dissociated distance, corresponds to the difference between the first local minimum and value at the dissociated distance, shows the difference between the global minimum and value at the dissociated distance, respectively. All units are in kcal/mol. Values in parentheses denote the uncertainty in the last reported digit as determined from the standard deviation.
| System | ΔWwater |
|
|
||
|---|---|---|---|---|---|
| Pure SPC/E | 19.01(2) | 1.35(8) | −1.41(6) | ||
| 3 M NaCl | 13.00(28) | −1.83(14) | −1.49(15) | ||
| 3 M NaI | 14.97(40) | −0.34(27) | −1.12(12) |
We suggest the effects of the spatial distribution of ions on water density in the vicinity of the tubes to explain the less destabilizing water contribution to the overall PMF in the salt solutions. When an ion or water molecule is immediately adjacent to the outer surface of the tube, there is a repulsive force between the ion/molecule and the tube. The repulsive nature is explained as a result of the separation distance being on the repulsive wall of the Lennard-Jones potential; the ion/molecule is “pushing” the tube away. For ionic or molecular species on the bulk solution side of a tube, this effect leads to a stabilizing force for tube-tube assembly; when species are on the inter-tube side of a tube, the effect is opposite and leads to destabilization of the contact state. This will be shown explicitly for the case of anions further below. Separations of the ion/molecule further from the tube (but still within the simulation cutoff), attract the tube, thus destabilizing the contact state. Since the cutoff for Lennard-Jones interactions is finite in the simulation, effectively all forces on the tube from species beyond the first solvation shell are destabilizing to the contact state. Thus, by lowering the density of species further away from the tube, one effectively is reducing the destabilizing contributions to the potential of mean force (i.e., less work is needed to bring the tubes together to the contact state). Thus in Figure 4b, relative to the pure water system, the water contribution in the salt solutions is lower. In particular, once the inter-tube region is evacuated of water at tube separations smaller than 19 Å, the water directly in the first solvation shell of the tube (on the bulk solution side of the tube) works to force the tubes together (working to stabilize the contact state). This explains the rapid falloff in the water contribution to the PMF in Figure 4b. Furthermore, since the bulk density of water in the salt solutions is lower than in pure water, the forces from these far water molecules working to pull the tubes apart is lessened, again contributing to the observed behavior of the water contribution relative to pure water. Finally, the water contribution is more stabilizing (approaching the contact state at tube separations less than 19 Å) in the NaCl solution than in the NaI solution. This is because in the NaCl system, water is not displaced from the first solvation shell of the tube to as much an extent as in the NaI system. Thus, the force from water acting to push the tubes together is greater in the NaCl system compared to the NaI system. The differences in water density relevant to this discussion, we reiterate, are highlighted in Figure 2a.
As shown in Figure 4c,d and Table III, both anions and cations show positive contribution to the PMF in general. Sodium cations contribute a stronger repulsive force (ΔWNa+ ~ 1.5 kcal/mol) in NaCl and NaI similarly. While chloride contributes ~ 4 kcal/mol to the PMF, iodide adds less than 0.1 kcal/mol. In fact, iodide appears to stabilize (ΔWanion < 0) at d less than the contact distance. To investigate this non-intuitive behavior, we compute the z-component of the total force from the individual anions on all the tube atoms (〈Fz,anion〉) as a function of the positions of anions. We first determine the force on the tube from an anion at a Cartesian position (x, y, z), , and then integrate over the length of nanotube to obtain an average force that depends only on the y and z positions of the individual anion. The integrated force map is:
| (9) |
where Fz,i′(x, y, z) corresponds to the sum of the forces applied on all tube atoms from given species i at position (x, y, z). Shown in Figure 6 are the results in NaI and NaCl solutions at d = 16.4 Å and 19.4 Å. From the perspective of anions residing in the hemisphere facing the bulk solution, a negative value in the figure denotes that the net force in z-direction for the corresponding anion at position (y, z) is repulsive and “pushes” the tubes to associate, while a positive value indicates an attractive net force that “pulls” the tubes apart. The opposite holds for anions within the inter-tube region. The figures are symmetrized by averaging forces from both tubes. We therefore can increase the statistics since the tubes are equivalent about the center of the simulation cell.
FIG. 6.
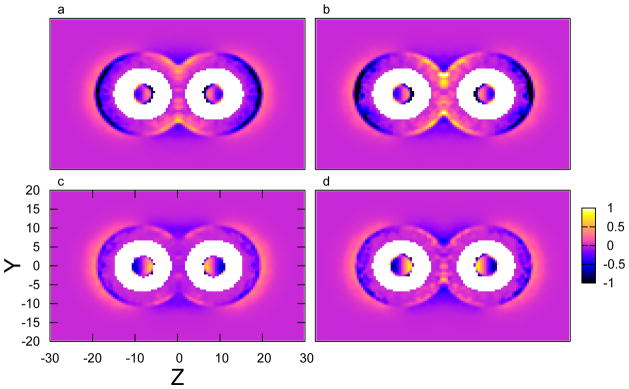
The z-component of total forces from anions applied on the carbon nanotubes at position (y, z), in (a) 3 M NaI solution with d = 16.4 Å, (b) 3 M NaI solution with d = 19.4 Å, (c) 3 M NaCl solution with d = 16.4 Å, (d) 3 M NaCl solution with d = 19.4 Å, respectively.
In order to explain the connection between the force and spatial distribution of anions, we further multiply the density map of anion (shown in supporting information) with the force map, as presented in Figure 7. For further clarity, we show in panel a (3 M NaI solution with d = 16.4 Å, the z-components of the tube axes are ± 8.2 Å) one way to divide the profiles into three regions: Region 1 represents z ≤ −8.2 Å; Region 2 corresponds to the region −8.2 Å < z < 8.2 Å; Region 3 denotes the region z ≥ −8.2 Å. We observe that in all cases, there is a “half ring” of stabilizing anions directly adjacent to the tubes in Regions 1 and 3; the stabilization by iodide is greater than chloride as indicated by the stronger dark bands in Regions 1 and 3. The inner rings of stabilizing ions are enclosed by an outer destabilizing layer in Region 1 and Region 3; these are ions further away from the tube nearing the bulk region. Due to chloride anion’s spatial preference of being in the bulk region, its outer destabilizing layer is greater than iodide. These distinct “types” of anions are present at both short and long tube separations (comparing panel a versus b for iodide, and panel c versus d for chloride). We now use this figure to explain the anion contribution in Figure 4c.
FIG. 7.
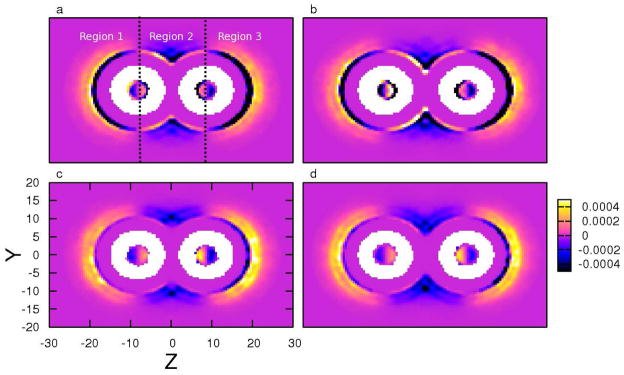
Product of the z-component of total forces (〈Fz〉) from anions applied on the carbon nanotubes and the anion density (ρanion) at position (y, z), in (a) 3 M NaI solution with d = 16.4 Å, (b) 3 M NaI solution with d = 19.4 Å, (c) 3 M NaCl solution with d = 16.4 Å, (d) 3 M NaCl solution with d = 19.4 Å, respectively. The black dotted lines in panel a are used to separate the regions defined in the text.
At large separations, both anions exhibit neutral behavior towards nanotube association; the contributions to the PMF are on the order of ~ 0.1 kcal/mol. From Figure 7d, in the bulk regions (Regions 1 and 3), the stabilizing forces from the anions in direct contact with the tube are small, therefore leaving strong destabilizing forces from anions in the bulk. In the inter-tube region, although there are relatively few chloride anions, we still observe some stabilizing net forces in Region 2. With decreasing tube separation, chloride ions are expelled from the inter-tube region, thus driving this contribution to even smaller on average at small separations (and then at the contact state); since the majority of chloride density is in the bulk solution (there is no significant enhanced density of chloride anions at the tube surface), the net force becomes destabilizing and the chloride PMF manifests as a monotonically increasing curve up to the contact state.
Primarily because of the significantly different spatial distribution of iodide anions, the iodide PMF manifests in quite a different curve. At large tube separations, the iodide anions directly adjacent to the tube in Regions 1,3 and Region 2 contribute equivalent, but opposite forces. The overall effect at this separation from ions directly in contact with the tube is marginally destabilizing. Offsetting this stability is the contribution from iodide anions in the bulk, thus leading to a slight destabilizing net force at large separations. Finally, nearing the contact state (short tube separations), the iodide density in the inter-tube region decreases as the anions are expelled from the region. This weakens the destabilizing force on the tubes in Region 2, which manifests as a slightly negative contribution to the PMF at contact state distances. Starting at the maximum in the iodide PMF contribution curve at 20 Å and moving towards the contact state, the expulsion of iodide anions from the inter-tube region coupled with the accumulation of these anions at the tube’s outer surface (bulk-facing surface) leads to the gradual transition of the iodide PMF from positive to marginally negative values at the contact state. Since iodide hydration is not favored, the contribution from iodide in bulk solution (further way from the tubes) does not significantly increase so as to offset the stabilizing contributions from ions in direct contact with the tube. The barrier in the iodide PMF arises from the work required to expel iodide from the inter-tube region. This is the same phenomena associated with the barriers in the water contribution to the PMF (more discussion in supporting information). Thus, to reiterate, we suggest that the contributions from the anions to the overall PMF for SWNT association are significantly different and arise from the spatial distributions of the different species. This is again another manifestation of specific-ion effects in condensed phase heterogeneous environments.
Due to the presence of L-V interfaces and specific-ion interfacial stabilities of the iodide and chloride anions, the absolute ion densities in the bulk region, where the SWNTs are located, are slightly different, as exhibited in the inset of Figure 2b. In a closed NPT or NVT ensemble simulation (with no liquid-vapor interface), the bulk anion concentrations would be closer in value in the absence of a liquid-vapor interface to lead to interfacial enhancement of the iodide compared to the chloride anion. Thus, we address the implications of this difference on the general conclusions relating to the contributions of the anions to the total PMF. Specifically, we demonstrate by using artificial scaling of anion densities in the bulk and vicinal regions that the net z-direction force does not change sign, even with the application of extreme, non-realistic scaling regimes. By showing that the sign of the force is not altered for two different tube separations, we demonstrate that the slight differences in bulk anion densities do not alter the conclusions about the nature of the contributions of the two different anions to the potential of mean force. We remind the reader that the z-direction force used in the following discussion is simply a function of the position with respect to the tube, and can be thought of as a force per atom density within a small sampling volume around the tube. By multiplying this force density by the (scaled) atom density, we obtain the z-direction force under the varying conditions just described (i.e., scaled or non-scaled, the latter being the original density). From Figure 2 and Figure 7 we can separate the anions into bulk anions (in Region 1 or 3, and 17.0 Å away from the tube axis) and non-bulk anions (in Region 2 or within 17.0 Å to the tube axis). From Figure 2, we see that 17.0 Å is the radial distance at which the bulk liquid regime begins based on the plateauing of the anion densities. Therefore the total forces (only the z-components are considered) can be written as:
| (10) |
By varying scaling parameters α and β, we can see how the resulting variation of anion densities may affect tube association free energetics through the forces. Increasing α increases the density in the vicinal region (in the immediate vicinity of the tube), and increasing β increases the density in the bulk region. Figure 8a and b show the ΣFz as a function of α and β for I− and Cl− at d = 16.4 Å. It is evident that within the range of (1 ≥ α ≥ 2, 1 ≥ β ≥ 2), the total forces from all the I− remain stabilizing (facilitating tube association), while the total forces from all the Cl− remain destabilizing (facilitating tube dissociation). We project the surface onto the case of β = 1, which means no scaling for bulk anions, as shown in Figure 8c. By increasing α we basically increase the number of anions in vicinity to the tubes. The different slopes between I− and Cl− further emphasize how the specific-ion effects tube association. In panel d we project the surface into the case of α = 1, where scaling is only applied on the bulk anion density. Both I− and Cl− show the trend of increasing of repulsiveness, however, within the extreme range of densities chosen for this analysis, I− consistently presents a favorable contribution to tube association. This suggests to us that the mechanistic picture of the role of differences in spatial distribution of anions will remain qualitatively the same for all densities. This analysis has not addressed the question of how changes in anion density will affect the depth of the PMF in the ionic solutions relative to the value in pure water. A more specific answer to this question is complicated by the fact that increasing the bulk density of iodide, for instance, will also tend to increase somewhat the near-tube density. Since the two density regions offer opposing contributions to the stability, it is difficult to precisely characterize the net effect.
FIG. 8.

Scaling effect of bulk anions and non-bulk anions. α and β are scaling parameters for non-bulk and bulk anions, which are defined in the text. ΣFz(α, β) is the sum of the forces from anions to the tube association. Panel (a) and (b) are the results of ΣFz(α, β) for I− and Cl− at d = 16.4 Å. Panel (c) shows ΣFz when β = 1 (no scaling for bulk anions) at d = 16.4 and 19.4 Å, while panel (d) shows the cases for α = 1 (no scaling for non-bulk anions), respectively.
Finally, we address the form of the water contribution to the PMF in panel b of Figure 4. We observe that in all cases (pure water, NaI solution, and NaCl solution) the water PMF exhibits a dramatic reduction nearing the contact state. This signifies that as the inter-tube region (Region 2) is dewetted, the destabilizing forces from water molecules adjacent to the tube in Region 2 vanishes. Water that is expelled is either accumulated adjacent to the tubes in Regions 1 and 3 (and is thus stabilizing the contact state), or returns to the bulk regions further from the tube. The reduction is greater in the NaCl system because more water accumulates at the surface of the tube in Region 1 and 3; since the chloride is preferentially solvated relative to iodide, expelled water molecules contribute more to stabilizing the contact state in the chloride solution than in the iodide solution. Furthermore, by virtue of a lower water density in the chloride system compared to that in the iodide system, water molecules contribute less destabilizing forces in the former case, and again in this manner contribute more to stabilizing the contact state.
3. Enthalpy and Entropy Components of SWNT Association
We consider decomposition of the total PMF into enthalpic and entropic components to assess the relative contri- butions of these thermodynamic quantities to the overall association free energetics. In particular, we are interested in the solvent induced contributions to the PMF, where we take the solvent to include all species except the tubes. Thus, the solvent induced enthalpy includes interactions between tubes and all other non-tube species, as well as interactions between all non-tube species (including self-interactions between non-tube species). Effectively, the tube-tube inter- action energy is excluded. For each separation, the enthalpy is computed as the difference of the average interaction potential energy of the dissociated state and the state at the particular SWNT separation of interest; this reflects the fact that the enthalpy is referenced to the dissociated state as is the potential of mean force. The Gibbs energy change (considering the equivalence of the Gibbs and Helmholtz potentials by neglecting small ambient-condition P-V contributions to the former), ΔG has been computed via Equation 6. By subtracting the direct tube-tube Lennard-Jones interaction, we obtain the solvent-induced free energy for the state defined by a particular separation of the tubes; this is called ΔWsolv. In our system the volume change between the contact state and dissociated state is negligible, therefore the change in enthalpy (ΔH) is obtained as a difference in potential energy of the system at a particular tube-tube separation and that at the largest separation (dissociated state). To be consistent with ΔWsolv, we compute the total interaction energy between tubes and all other components of the system (which we consider the solvent—water, anions, and cations as relevant); this also includes interaction energy between elements of the solvent (water-ion, ion-ion, water-water).
The total enthalpic change can be written as:
| (11) |
where i, j indicate each component in the given system. Since the tube-tube interaction is independent of the systems, we only look at the solvent induced enthalpic changes (ΔHsolv), which can be obtained by subtracting the direct tube-tube potential part from the overall enthalpic change. The entropic change is therefore determined from −TΔSsolv = ΔGsolv−ΔHsolv 48. The results of these thermodynamic properties of pure water, 3 M NaCl and 3 M NaI systems are shown in Figure 9a-c; further comparison of the same thermodynamic property among the three systems plotted on the same graph are presented in panels d-f of Figure 9. Though not pursued here, we acknowledge that the entropic contribution may be determined from an analysis of the temperature dependence of the PMF66. Figure 9 a shows the variation of free energy, enthalpy, and −TΔS with tube separation for the tubes in pure water. Panels b and c show the same for 3M NaCl and NaI, respectively. In all cases, the solvent-induced contribution to the free energy is positive and destabilizes the contact state. Thus, the entire free energy stabilization of the contact state in our model system arises from the tube-tube enthalpy (interaction energy) arising from the Lennard-Jones potential. Moreover, the major solvent-induced free energy is driven by a repulsive enthalpy of interaction in all systems. Finally, the added stability of the contact state in the aqueous salt solutions, it appears, arises from the lower enthalpy of the solvent at the contact state. This behavior is most likely potential dependent as other studies may demonstrate higher enthalpic contributions for the salt solutions. These trends are further demonstrated in panels d-f of Figure 9. Panel e further highlights the dominant role of enthalpy as the driver of the added stability of the contact state in salt solutions. The added stability of hydrophobes in salt solutions, specifically NaCl solutions, has been described in detail by Athawale et al68.
FIG. 9.

Solvent contribution, ΔWsolv to the PMF and its enthalpic contribution (ΔHsolv), and entropic contribution (−TΔSsolv) for (a) pure water (b) 3 M NaCl and (c) 3 M NaI systems. Panel d-f show the comparison of the different solvents for the same thermodynamic properties.
The solvent-induced contribution to enthalpy can be further split into the change in tube-solvent interaction (ΔUtube–solv) and the remaining contribution from the change in solvent-solvent interactions and other mechani- cal work (ΔHrem). When all the quantities are referenced to the values at the dissociated distance d = 26.0 Å, we have
| (12) |
The results of ΔUtube–solv and ΔHrem as functions of d are shown in Figure 10. From Figure 10a, ΔUtube–solv of all the systems are nearly zero at large intertube separation. At d = 19.4 Å and 21.8 Å, which correspond to the critical distances that water molecules form the monolayer and bilayer structures, the changes in ΔUtube–solv are considerable. As the intertube separation reduces, ΔUtube–solv becomes more unfavorable and contributes significantly to the unfavorable ΔHsolv. This behavior is similar with Choudhury et al’s study66 using two planar solutes, while in their case, due to the expulsion of water between the solutes, the interactions of the confined water with the solutes decrease, therefore leads to the increase of ΔUtube–solv at small intersolute separation. However, owing to different geometry and larger surface area in our system, ΔUtube–solv keeps increasing below d = 19.4 Å, while in their case ΔUtube–solv eventually becomes a constant at small intersolute separation. We also notice that in the case of 3 M NaCl solution, changes in the direct tube-solvent interactions contribute to destabilizing the contact state more than in the case of 3 M NaI and pure water systems. Since the ΔHsolv in pure water is more destabilizing than the cases in salt solutions, it indicates that the remaining contributions from solvent-solvent interactions and from the pressure-volume work (PΔV ) in pure water have to be even more destabilizing. In this study, we consider the PΔV term negligible and therefore the solvent-solvent interactions dominate the ΔHrem. The results shown in Figure 10b suggest less favorable solvent-solvent interactions in pure water, which may be due to the reorganization of more expelled water molecules from the intertube region into the bulk. The solvent enthalpy is more favorable in the NaCl system; since chloride anion is preferentially solvated relative to iodide, the added enthalpic stabilization of the system (within the context of the current force field) with chloride ions present is reasonable. Iodide ions preferentially segregate to the tube-water interface (and the liquid-vapor interface). Thus, the changes in enthalpy for the pure water and NaI systems can reasonably be considered to be equivalent. This is borne out by the results of Figure 10b.
FIG. 10.

Solvent-induced contribution to enthalpy of tube association, ΔHsolv (from Figure 9d) is split into (a) the change in tube-solvent interaction (ΔUtube–solv) and (b) the remaining contribution from the change in solvent-solvent interactions and other mechanic work (ΔHrem). All the quantities are referenced to the values at the dissociated distance d = 26.0 Å.
To explore the nature of the contributions to enthalpy and entropy arising from interactions involving components of the salts (chloride, iodide, and sodium), we further investigate the individual contribution to these thermodynamic properties by decomposing the enthalpic changes using the following relation which ascribes an enthalpy change for a species i that is determined from its interactions with all other components of the system. ΔHIodide, for instance, represents the difference in the interaction energy involving iodide ion between the contact and largest separation states and can be written as:
| (13) |
The results of ΔHion and −TΔSion as functions of d in salt solutions are shown in Figure 11. For clarity, vertical offsets of −2 and −1 kcal/mol are imposed for the entropic contribution in anion and cation, respectively. Considering the anions first, Figure 11a demonstrates that the stabilization of the contact state by iodide ion is facilitated by a larger entropy gain associated with iodide. Both chloride and iodide show destabilizing enthalpic contributions, of about the same magnitude as well. At the contact state, the enthalpic and entropic contributions of the iodide-induced profiles almost exactly cancel. The entropically stabilizing effects of iodide arise from the fact that segregation of iodide at the interfaces increases the overall entropy of the system through the increased configurational volume available to water. We stress that this is a qualitative argument for the stability conferred to the contact state by the iodide anion. In the case of iodide, release of water and the limited iodide between the tubes, in conjunction with the enhancement of iodide density at the tube surface, thus favors the contact state. The sodium essentially exhibits an enthalpic destabilization, with a slight decrease in entropy due to the structuring of water around the relatively small sodium ion once it is released into the bulk regions at the tube contact state.
FIG. 11.

Ionic enthalpic contribution (ΔHi, i = (Cl−, I−, Na+)), and entropic contribution (−TΔSi) in 3 M NaCl and NaI systems. Vertical offsets of −2 and −1 kcal/mol are applied for the entropic contribution in panel a and b, respectively.
IV. CONCLUSIONS
In this study, we investigate how salt solutions of chloride and iodide ions influence the magnitude of the association between two carbon nanotubes. Specifically, we address how the differences in the contributions of the two anions arise from the perspective of the significantly different spatial distribution of ions around the nanotubes. This is a further manifestation of what has come to be considered as specific-ion effects during the last two decades. To accomplish this, we have used molecular dynamics simulations to calculate the potential of mean force between two nanotubes in aqueous salt solutions as a function of the distance between the tube axes. The present results indicate that both the chloride and iodide salt solutions marginally stabilize the hydrophobic contact state, although the contributions of iodide and chloride in this process are drastically different. We stress that the dominant stabilizing factor, leading to the deep potential of mean force minimum, is the tube-tube interaction energy; in the salt solutions, the combined effects of anion, cation, and water lead to further overall marginal enhancement in the stability of the contact state. We address this interplay between the various components in the salt solutions. At large tube separations, both the iodide and chloride solutions show very little difference in that both anions contribute relatively little to the potential of mean force. As the intertube distance decreases, the segregation of the larger, less strongly-hydrated iodide anion to the nanotube surface coupled with the emptying of the inter tube region by iodide anion (as well as water) leads to the iodide presenting a net stabilizing force on the tubes. The proximity of the iodide anions to the tube surface (asymmetrically) effectively pushes the two tubes together. Chloride, on the other hand, is not surface active and thus contributes destabilizing, longer-ranged dispersion forces that effectively pull the tubes apart. That we observe almost an equivalent stabilization of the tube contact state in the two salt solutions despite the differences in the contributions from the anions is reconciled by considering the associated differences in water contributions to the potential of mean force. In the case of iodide solutions, water is driven further away from the tube surface because of iodide anions segregating to the surface; the force contributed by water further away is to pull the tubes toward the water and away from one another, thus destabilizing the contact state. In the chloride solutions, much less water is expelled from the immediate vicinity of the tubes; water thus exerts a greater net destabilizing force in the iodide solutions compared to that in the chloride solutions. These factors in aggregate lead to the stabilization of the contact state in both NaCl and NaI relative to that in pure water. The stability of hydrophobe associated states has been observed previously in the context of small-molecule (alkane) association in sodium chloride solutions by Athawale et al68.
Supplementary Material
FIG. 12.

Table of Contents Graphic
Acknowledgments
The authors acknowledge support from the National Institutes of Health (COBRE:5P20RR017716-07) at the University of Delaware, Department of Chemistry and Biochemistry.
Footnotes
Supporting Information Available: Supporting Information discussing several aspects of simulation protocol and choice of systems is provided. The SI discusses our criteria and method for selection of the concentration at which to perform the simulations discussed in this work. We show that the 3M concentration chosen appears to be a sufficiently converged concentration so as to avoid artifacts arising from the presence of the liquid-vapor interface. We also discuss the radial density maps of iodide and chloride anions in Section II. In Section III we discuss the effect of using a larger sampling volume on our analysis of the occupancy of the inter-tube regions. This analysis shows that the qualitative features of the occupancy do not change with the size of sampling volume. In Sections IV and V, we conclude the SI by addressing contributions from Lennard-Jones long-range contributions to the energetics (long-range interactions are neglected in cutoff-based simulations) and aspects of hydrogen-bonding dynamics and structure, respectively. This material is available free of charge via the Internet at http://pubs.acs.org.
Contributor Information
Shuching Ou, Department of Chemistry and Biochemistry, University of Delaware, Newark, Delaware 19716, USA.
Sandeep Patel, Department of Chemistry and Biochemistry, University of Delaware, Newark, Delaware 19716, USA.
Brad A. Bauer, Department of Physical and Biological Sciences, The College of Saint Rose, Albany, New York 12203, USA
References
- 1.Frolov AI, Rozhin AG, Fedorov MV. Chem Phys Chem. 2010;11:2612–2616. doi: 10.1002/cphc.201000231. [DOI] [PubMed] [Google Scholar]
- 2.Lin S, Blankschtein D. J Phys Chem B. 2010;2010:15616–15625. doi: 10.1021/jp1076406. [DOI] [PubMed] [Google Scholar]
- 3.Zelada-Guillen GA, Riu J, Duzgun A, Rius FX. Angew Chem Int Ed. 2009;48:7334–7337. doi: 10.1002/anie.200902090. [DOI] [PubMed] [Google Scholar]
- 4.Zelada-Guillen GA, Riu J, Duzgun A, Rius FX. Angew Chem. 2009;121:7470–7473. doi: 10.1002/anie.200902090. [DOI] [PubMed] [Google Scholar]
- 5.Chen RJ, Bangsaruntip S, Drouvalakis KA, Kam NWS, Shim M, Li Y, Kim W, Utz PJ, Dai H. Proc Nat Aca Sci. 2003;100:4984–4989. doi: 10.1073/pnas.0837064100. [DOI] [PMC free article] [PubMed] [Google Scholar]
- 6.Vaisman L, Wagner HD, Marom G. Adv Coll Int Sci. 2006;128:37–46. doi: 10.1016/j.cis.2006.11.007. [DOI] [PubMed] [Google Scholar]
- 7.Moore VC, Strano MS, Haroz EH, Hauge RH, Smalley RE, Schimdt J, Talmon Y. Nano Lett. 2003;3:1379–1382. [Google Scholar]
- 8.Xu Z, Yang X, Yang Z. Nano Lett. 2010;10:985–991. doi: 10.1021/nl9041005. [DOI] [PubMed] [Google Scholar]
- 9.Angelikopoulos P, Beck H. J Phys Chem Lett. 2011;2:139–144. [Google Scholar]
- 10.Hofmeister F. Arch Exp Pathol Pharmakol. 1888;24:247–260. [Google Scholar]
- 11.Kurutz JW, Xu S. Langmuir. 2001;17:7323–7326. [Google Scholar]
- 12.Neagu A, Neagu M, Dńr A. Biophy J. 2001;81:1285–1294. doi: 10.1016/S0006-3495(01)75786-4. [DOI] [PMC free article] [PubMed] [Google Scholar]
- 13.Tadeo X, López-Méndez B, Castaño D, Millet O. Biophy J. 2009;97:2595–2603. doi: 10.1016/j.bpj.2009.08.029. [DOI] [PMC free article] [PubMed] [Google Scholar]
- 14.Kunz W, Henle J, Ninham BW. Curr Opin Colloid Inter Sci. 2004;9:19–37. [Google Scholar]
- 15.Zhang Y, Cremer PS. Annu Rev Phys Chem. 2010;61:63–83. doi: 10.1146/annurev.physchem.59.032607.093635. [DOI] [PubMed] [Google Scholar]
- 16.dos Santos AP, Diehl A, Levin Y. Langmuir. 2010;13:10778–10783. doi: 10.1021/la100604k. [DOI] [PubMed] [Google Scholar]
- 17.Zangi R, Hagen M, Berne BJ. J Am Chem Soc. 2007;129:4678–4686. doi: 10.1021/ja068305m. [DOI] [PubMed] [Google Scholar]
- 18.Levin Y, dos Santos AP, Diehl A. Phys Rev Lett. 2009;103:257802. doi: 10.1103/PhysRevLett.103.257802. [DOI] [PubMed] [Google Scholar]
- 19.Jungwirth P, Tobias DJ. J Phys Chem B. 2001;105:10468–10472. [Google Scholar]
- 20.Zhu S, Elcock AH. J Chem Theory Comput. 2010;6:1293–1306. [Google Scholar]
- 21.Thomas AS, Elcock AH. J Am Chem Soc. 2007;129:14887–14898. doi: 10.1021/ja073097z. [DOI] [PubMed] [Google Scholar]
- 22.Collins KD, Washabaugh MW. Q Rev Biophys. 1985;18:323–422. doi: 10.1017/s0033583500005369. [DOI] [PubMed] [Google Scholar]
- 23.Horinek D, Serr A, Bonthuis DJ, Bostrom M, Kunz W, Netz RR. Langmuir. 2008;24:1271–1283. doi: 10.1021/la702485r. [DOI] [PubMed] [Google Scholar]
- 24.Ghosh T, Kalra A, Garde S. J Phys Chem B. 2005;109:642–651. doi: 10.1021/jp0475638. [DOI] [PubMed] [Google Scholar]
- 25.Godawat R, Jamadagni SN, Garde S. J Phys Chem B. 2010;114:2246–2254. doi: 10.1021/jp906976q. [DOI] [PubMed] [Google Scholar]
- 26.Collins KD. Methods. 2004;34:300–311. doi: 10.1016/j.ymeth.2004.03.021. [DOI] [PubMed] [Google Scholar]
- 27.Zhang Y, Cremer PS. Curr Opin Chem Bio. 2006;10:658–663. doi: 10.1016/j.cbpa.2006.09.020. [DOI] [PubMed] [Google Scholar]
- 28.Zhang YJ, Furyk S, Bergbreiter DE, Cremer PS. J Am Chem Soc. 2005;127:14505–14510. doi: 10.1021/ja0546424. [DOI] [PubMed] [Google Scholar]
- 29.Chen X, Flores SC, Lim S, Zhang Y, Kherb J, Cremer PS. Langmuir. 2010;26:16447–16454. doi: 10.1021/la1015862. [DOI] [PubMed] [Google Scholar]
- 30.Zangi R, Berne BJ. J Phys Chem B. 2006;110:22736–22741. doi: 10.1021/jp064475+. [DOI] [PubMed] [Google Scholar]
- 31.Wick CD, Xantheas SS. J Phys Chem B. 2009;113:4141–4146. doi: 10.1021/jp806782r. [DOI] [PubMed] [Google Scholar]
- 32.Pegram LM, Record MT., Jr J Phys Chem B. 2007;111:5411–5417. doi: 10.1021/jp070245z. [DOI] [PubMed] [Google Scholar]
- 33.Pegram LM, Record MT., Jr J Phys Chem B. 2008;112:9428–9436. doi: 10.1021/jp800816a. [DOI] [PMC free article] [PubMed] [Google Scholar]
- 34.Heyda J, Vincent JC, Tobias DJ, Dzubiella J, Jungwirth P. J Phys Chem B. 2010;114:1213–1220. doi: 10.1021/jp910953w. [DOI] [PubMed] [Google Scholar]
- 35.Jungwirth P, Tobias DJ. Chem Rev. 2006;106:1259–1281. doi: 10.1021/cr0403741. [DOI] [PubMed] [Google Scholar]
- 36.Jungwirth P, Tobias DJ. J Phys Chem B. 2002;106:6361–6373. [Google Scholar]
- 37.Horinek D, Netz RR. Phys Rev Lett. 2007;99:226104. doi: 10.1103/PhysRevLett.99.226104. [DOI] [PubMed] [Google Scholar]
- 38.Horinek D, Herz A, Vrbka L, Sedlmeier F, Mamatkulov SI, Netz RR. Chem Phys Lett. 2009;479:173–183. [Google Scholar]
- 39.Niyogi S, Boukhalfa S, Chikkannanavar SB, McDonald TJ, Heben MJ, Doorn SK. J Am Chem Soc. 2007;129:1898–1899. doi: 10.1021/ja068321j. [DOI] [PubMed] [Google Scholar]
- 40.Niyogi S, Densmore CG, Doorn SK. J Am Chem Soc. 2009;131:1144–1153. doi: 10.1021/ja807785e. [DOI] [PubMed] [Google Scholar]
- 41.Brooks BR, et al. J Comp Chem. 2009;30:1545–1614. doi: 10.1002/jcc.21287. [DOI] [PMC free article] [PubMed] [Google Scholar]
- 42.Bauer BA, Patel S. J Phys Chem B. 2010;114:8107–8117. doi: 10.1021/jp101995d. [DOI] [PMC free article] [PubMed] [Google Scholar]
- 43.Nosé S. Mol Phys. 1984;52:255–268. [Google Scholar]
- 44.JCrystalSoft. 2011 http://jcrystal.com/products/wincnt/index.htm.
- 45.Dresselhaus MS, Dresselhaus G, Eklund PC. Science of Fullerenes and Carbon Nanotubes. Academic Press; San Diego, CA: 1995. [Google Scholar]
- 46.Sendner C, Horinek D, Bocquet L, Netz RR. Langmuir. 2009;25:10768–10781. doi: 10.1021/la901314b. [DOI] [PubMed] [Google Scholar]
- 47.Eun C, Berkowitz ML. J Phys Chem B. 2009;113:13222–13228. doi: 10.1021/jp901747s. [DOI] [PubMed] [Google Scholar]
- 48.Zangi R, Berne BJ. J Phys Chem B. 2008;112:8634–8644. doi: 10.1021/jp802135c. [DOI] [PubMed] [Google Scholar]
- 49.Zangi R. J Phys Chem B. 2011;115:2303–2311. doi: 10.1021/jp1090284. [DOI] [PubMed] [Google Scholar]
- 50.Bauer BA, Ou S, Patel S. Phys Chem Chem Phys. 2012;14:1892–1906. doi: 10.1039/c1cp20839j. [DOI] [PMC free article] [PubMed] [Google Scholar]
- 51.Berendsen HJC, Grigera JR, Straatsma TP. J Phys Chem. 1987;91:6269–6271. [Google Scholar]
- 52.Fyta M, Kalcher I, Dzubiella J, Netz RR. J Chem Phys. 2010;132:024911. doi: 10.1063/1.3292575. [DOI] [PubMed] [Google Scholar]
- 53.Darden T, York D, Pedersen L. J Chem Phys. 1993;98:10089–10092. [Google Scholar]
- 54.Ryckaert JP, Ciccotti G, Berendsen HJC. J Comp Phys. 1977;23:327–341. [Google Scholar]
- 55.dos Santos AP, Levin Y. Phys Rev Lett. 2011;106:167801. doi: 10.1103/PhysRevLett.106.167801. [DOI] [PubMed] [Google Scholar]
- 56.Warren GL, Patel S. J Phys Chem C. 2008;112:7455–7467. doi: 10.1021/jp8038835. [DOI] [PMC free article] [PubMed] [Google Scholar]
- 57.Bauer BA, Ou S, Patel S. Chem Phys Lett. 2011 doi: 10.1016/j.cplett.2011.12.061. [DOI] [PMC free article] [PubMed] [Google Scholar]
- 58.Ottosson N, Heyda J, Wernersson E, Pokapanich W, Svensson S, Winter B, Öhrwall G, Jungwirth P, Björneholm O. Phys Chem Chem Phys. 2010;12:10693–10700. doi: 10.1039/c0cp00365d. [DOI] [PubMed] [Google Scholar]
- 59.Saleh H, Pfefferle LD, Elimelech M. Environ Sci Technol. 2010;44:2412–2418. doi: 10.1021/es903059t. [DOI] [PubMed] [Google Scholar]
- 60.Derjaguin B, Landau L. Acta Physico Chemica URSS. 1941;14:633. [Google Scholar]
- 61.Verwey EJW, Overbeek JTG. Theory of the stability of lyophobic colloids. Elsevier; Amsterdam: 1948. [Google Scholar]
- 62.Baker CM, Lopes PEM, Zhu X, Roux B, MacKerell AD., Jr J Chem Theory Comput. 2010;6:1181–1198. doi: 10.1021/ct9005773. [DOI] [PMC free article] [PubMed] [Google Scholar]
- 63.SaltInstitute. 2011 http://www.saltinstitute.org/
- 64.Li L, Bedrov D, Smith GD. J Phys Chem B. 2006;110:10509–10513. doi: 10.1021/jp060718m. [DOI] [PubMed] [Google Scholar]
- 65.Li L, Bedrov D, Smith GD. J Chem Phys. 2005;123:204504. doi: 10.1063/1.2121647. [DOI] [PubMed] [Google Scholar]
- 66.Choudhury N, Pettitt BM. J Phys Chem B. 2006;110:8459–8463. doi: 10.1021/jp056909r. [DOI] [PMC free article] [PubMed] [Google Scholar]
- 67.Uddin NM, Capaldi FM, Farouk B. Polymer. 2011;52:288–296. [Google Scholar]
- 68.Athawale MV, Sarupria S, Garde S. J Phys Chem B. 2008;112:5661–5670. doi: 10.1021/jp073485n. [DOI] [PubMed] [Google Scholar]
- 69.Humphrey W, Dalke A, Schulten K. J Mol Graphics. 1996;14:33–38. doi: 10.1016/0263-7855(96)00018-5. [DOI] [PubMed] [Google Scholar]
Associated Data
This section collects any data citations, data availability statements, or supplementary materials included in this article.