

Significance
Plant leaves are heavily colonized by microorganisms, but the extent to which the surface sites differ from interior sites in selecting for microbial colonization traits is poorly understood. Global gene-expression studies of the foliar pathogen Pseudomonas syringae reveal that leaf surface sites specifically favor active exploration using flagellar motility, chemosensing, and chemotaxis. In contrast, interior sites favor production of enzymes and secondary compounds that modulate bacterial interactions with the plant and its defense system. Water limitation is a dominating force in both surface and interior sites. These findings provide a rich understanding of the leaf habitats encountered by bacteria.
Keywords: endophyte, epiphyte, phyllosphere
Abstract
Some strains of the foliar pathogen Pseudomonas syringae are adapted for growth and survival on leaf surfaces and in the leaf interior. Global transcriptome profiling was used to evaluate if these two habitats offer distinct environments for bacteria and thus present distinct driving forces for adaptation. The transcript profiles of Pseudomonas syringae pv. syringae B728a support a model in which leaf surface, or epiphytic, sites specifically favor flagellar motility, swarming motility based on 3-(3-hydroxyalkanoyloxy)alkanoic acid surfactant production, chemosensing, and chemotaxis, indicating active relocation primarily on the leaf surface. Epiphytic sites also promote high transcript levels for phenylalanine degradation, which may help counteract phenylpropanoid-based defenses before leaf entry. In contrast, intercellular, or apoplastic, sites favor the high-level expression of genes for GABA metabolism (degradation of these genes would attenuate GABA repression of virulence) and the synthesis of phytotoxins, two additional secondary metabolites, and syringolin A. These findings support roles for these compounds in virulence, including a role for syringolin A in suppressing defense responses beyond stomatal closure. A comparison of the transcriptomes from in planta cells and from cells exposed to osmotic stress, oxidative stress, and iron and nitrogen limitation indicated that water availability, in particular, was limited in both leaf habitats but was more severely limited in the apoplast than on the leaf surface under the conditions tested. These findings contribute to a coherent model of the adaptations of this widespread bacterial phytopathogen to distinct habitats within its host.
Plant leaves are colonized by an abundance of microorganisms. Among these is Pseudomonas syringae, which is a model bacterial foliar pathogen with a wide host range and vast geographic distribution. P. syringae strains vary in their ability to establish and maintain epiphytic, or leaf surface, populations before infection. One of the most thoroughly studied P. syringae strains, P. syringae pv. syringae B728a, has a particularly pronounced epiphytic phase when growing on leaves of the host plant bean (Phaseolus vulgaris L.) but can also establish populations in the intercellular spaces, or apoplast, that may or may not be associated with visible symptoms of bacterial brown spot. For some foliar bacterial pathogens like B728a, populations can reach 107 cells per gram of fresh tissue in epiphytic sites and 1010 cells per gram in apoplastic sites. We predict that the driving forces for P. syringae adaptations for growth and survival in epiphytic sites are distinct from those in the apoplast and that these forces are shaped mainly by the external environment for the former and by plant defense responses for the latter. In particular, leaf-surface bacteria likely encounter fluctuations in water availability, temperature, and solar radiation as well as frequent nutrient limitation resulting from a heterogeneous distribution of nutrients (1). In contrast, bacteria in the apoplast likely experience slight acidity and oxidative stress resulting from the plant’s defenses.
To better understand the interactions of bacterial phytopathogens with leaves, most work has focused on specific factors contributing to virulence or fitness (2–4) and specific environmental conditions influencing survival (5, 6), although in vivo expression technologies have been used to identify many P. syringae genes that are induced in or on leaves (7, 8). Rarely have these studies attempted to integrate knowledge of the environmental conditions in leaf habitats with the P. syringae adaptations used to survive or exploit those habitats. In this study we used global transcriptome profiling to understand the various environmental conditions that P. syringae cells encounter during their association with plants. We analyzed genes and traits in B728a that were responsive to growth on the leaf surface, in the leaf apoplast, and under four environmental conditions predicted to be characteristic of these habitats. Our findings suggest that B728a cells experience vastly different environments when growing on the surface versus the interior of leaves and identify distinct traits that likely are used for persistence and growth in these environments. Collectively, these results demonstrate both epiphytic and apoplastic stages in the B728a lifecycle.
Results and Discussion
P. syringae Encounters Distinct Environmental Stresses in Planta.
We collected RNA from B728a cells that were exposed to seven treatments, each with two biological replicates in each of three laboratories. The treatments included exposing cells to a basal medium, sodium chloride to confer an osmotic stress, hydrogen peroxide to confer an oxidative stress, iron limitation, nitrogen limitation, and epiphytic and apoplastic growth (Methods and Figs. S1–S6). The RNA was labeled and hybridized to an ORF-based microarray by Roche-NimbleGen. A comparison of the treatments based on a hierarchical clustering of the transcript abundances showed that nitrogen limitation had the largest effect on the transcriptomes (Fig. 1). Nitrogen limitation affected a majority of the B728a genes and thus likely imposed a large metabolic shift, as supported by the lack of growth during nitrogen limitation (Fig. S4). The transcriptomes of the in planta treatments diverged highly from the other treatments, with clear differences between epiphytic and apoplastic cells (Fig. 1). Among the remaining treatments, osmotic stress had the largest effect, whereas oxidative stress and iron limitation had relatively small effects. These results may reflect a broader array of genes required for cellular adaptation to osmotic stress than to oxidative stress and low iron and/or stress attenuation caused by peroxide detoxification. Collectively, this hierarchical clustering indicates that each treatment had a detectably distinct impact on the cells.
Fig. 1.

Each environmental treatment induced a distinct stimulon. The hierarchical clustering was based on 500 genes with the lowest P values in an F test for the combined effect of all seven treatments among all of the samples. Numbers 1–2, 3–4, and 5–6 are the two replicate samples from laboratories A, B, and C, respectively. Colors indicate treatments, which include nitrogen limitation (Low N); epiphytic sites (Epiphytic); apoplastic sites (Apoplastic); osmotic stress (NaCl); basal medium (Basal); oxidative stress (H2O2); and iron limitation (Low Fe).
We evaluated the extent to which the transcriptomes in planta reflected exposure to each environmental stress by correlation analysis of the combined dataset, i.e., the pooled data from the three laboratories. When transcript levels relative to the basal medium were plotted for the in vitro and in planta treatments, the transcripts that were increased in the epiphytic and apoplastic sites correlated most strongly with those increased in the osmotic stress and nitrogen-limitation treatments (Fig. 2). These plots also show the general direction and magnitude of the changes in transcript abundance, with the nitrogen-limitation treatment causing large decreases as well as increases in transcript abundance and the other stresses primarily causing only increases. This result is consistent with nitrogen limitation inducing a metabolic downshift and the other stresses inducing specific adaptations. Prior reports documented that B728a cells decrease in size following inoculation (1), suggesting a metabolic downshift in most cells. However, the predominance of increases rather than decreases in the transcript levels in the epiphytic and apoplastic cells relative to the basal medium (Fig. 2) suggests that, at least by 48–72 h after inoculation, the majority of cells were not in a physiological state of starvation like that of the nitrogen-limited cells.
Fig. 2.

Correlation between the P. syringae transcriptomes of cells exposed to environmental stresses in vitro and those recovered from (A) epiphytic sites or (B) apoplastic sites. The log(fold-change) values of the transcript levels of all the genes in the in vitro stress treatments relative to transcript levels in the basal medium (y axes) were plotted against those of the in planta treatments relative to transcript levels in the basal medium (x axes). The dotted gray lines indicate fivefold changes in transcript levels. Red dots indicate genes that were altered fivefold or more in both plotted treatments.
We also evaluated the extent to which the transcriptomes in planta reflected exposure to each stress by using multiple regression analysis. For the transcriptomes identified in each laboratory and the combined dataset, we regressed the transcript levels of all the genes in the epiphytic transcriptome on those of the in vitro stresses and basal medium while constraining the coefficients to be nonnegative and to sum to one (Table 1); we did the same for the apoplastic transcriptome data. The resulting coefficients suggested a large contribution of osmotic stress and nitrogen limitation to the transcriptome of cells in epiphytic and apoplastic sites. Moreover, within each dataset, the osmotic stress transcriptome was correlated more strongly to the apoplastic transcriptome than to the epiphytic transcriptome, suggesting that P. syringae experienced a more severe water limitation in the leaf interior than on the leaf surface. Surprisingly, the in planta transcriptomes were correlated most poorly with the oxidative stress transcriptome, possibly because of the relatively small impact of oxidative stress on the transcriptome of P. syringae, an unexpected attenuation of the applied stress, or a response of the cells to oxidative stress in planta that was distinct from the response seen in vitro.
Table 1.
Correlation coefficients from a multiple regression analysis of the transcriptome in epiphytic or apoplastic sites on the transcriptomes of cells exposed to the basal medium and to each of the four environmental stresses in vitro
| Stress | Epiphytic sites* |
Apoplastic sites* |
||||||
| Lab A | Lab B | Lab C | Combined dataset | Lab A | Lab B | Lab C | Combined dataset | |
| Osmotic stress | 0.40 | 0.47 | 0.25 | 0.42 | 0.50 | 0.75 | 0.42 | 0.64 |
| Nitrogen limitation | 0.34 | 0.32 | 0.33 | 0.36 | 0.46 | 0.22 | 0.41 | 0.28 |
| Oxidative stress | 0 | 0.02 | 0.26 | 0 | 0 | 0 | 0 | 0 |
| Iron limitation | 0.26 | 0.15 | 0.10 | 0.18 | 0.04 | 0.04 | 0.16 | 0.07 |
*Multiple regression analysis was performed with the constraints that the coefficients were non-negative and had to sum to one. The transcriptome data were in the form of the transcript abundances weighted with variances using a least-squares approach. Regression analyses were performed separately for the data from each laboratory and for the combined dataset.
P. syringae Encounters Distinct Environments in Epiphytic Versus Apoplastic Sites.
For the combined dataset, the transcript levels of 65% of the B728a genes were altered by growth in epiphytic sites as compared with growth in the basal medium, and 22% of these genes were altered in epiphytic but not in apoplastic sites (Fig. 3). Similarly 50% of the B728a genes were altered in apoplastic sites, with 8% altered specifically in the apoplast. A large impact of the in planta treatments on gene expression and a distinct response to epiphytic versus apoplastic sites were evidenced similarly in the individual datasets generated in each laboratory.
Fig. 3.
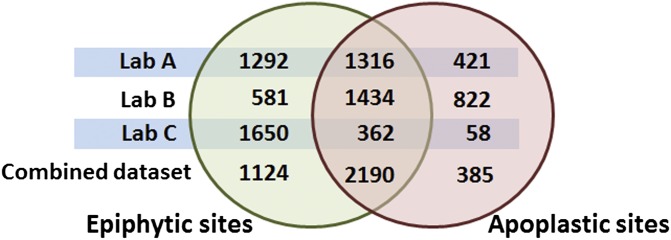
Comparison of the number of genes showing significant differences in transcript abundance in epiphytic and apoplastic sites. The Venn diagram indicates the number of genes showing differences in transcript abundance (q value < 0.01) in cells isolated from the leaf surface (epiphytic sites) and from the leaf interior (apoplastic sites). The total number of putative genes in the datasets was 5,132. The results are shown in separate rows for datasets originating from each of the three laboratories and for a meta-analysis of the combined datasets.
To identify the B728a adaptations specific to each environment, we identified the functional categories in which the representation of differentially expressed genes was greater than that in all the B728a genes (Fig. 4 and Tables S1 and S2); genes were designated as differentially expressed based on a P value < 0.05 and a q value < 0.01. Genes in the chemosensing and chemotaxis category were unique in being overrepresented among induced genes in epiphytic cells and among repressed genes in apoplastic cells (Fig. 4 A and B). Genes in the sulfur metabolism and transport category were overrepresented among induced genes in epiphytic but not apoplastic cells. In contrast, genes in the phage and insertion sequence (IS) elements and mechanosensitive ion channels categories were overrepresented among induced genes in apoplastic but not epiphytic cells. Many other categories showed quantitative differences between epiphytic and apoplastic cells based on the percentage of differentially expressed genes (Fig. 4 A and B). For categories with particularly large differences, or for individual gene sets within these categories, we calculated the mean fold-changes in transcript abundance across all the genes in the category or gene set (Fig. 5). We discuss many of these differences below. The categories with overrepresented genes that were induced in cells exposed to osmotic stress and iron and nitrogen limitation generally reflected the functions known to be bacterial responses to these stresses (Fig. 4C).
Fig. 4.

Percentage of genes in functional categories that were overrepresented among the differentially expressed (DE) genes in each treatment. The x axis indicates the functional categories that were significantly overrepresented in one or more sets of differentially expressed genes (q value < 0.05), with the differentially expressed genes identified based on a q value < 0.01. The y axis labels indicate the treatments that were compared with the basal medium. The z axis indicates the percentage of genes within the category specified on the x axis that were differentially expressed between the treatment indicated on the y axis and the basal medium. This analysis was applied separately to genes with increased transcript abundance (A and C) and those with decreased transcript abundance (B and D) compared with cells in the basal medium. For clarity, the in planta treatments (A and B) are shown separately from the in vitro treatments (C and D). The results for all of the functional categories are shown in Table S1.
Fig. 5.

The geometric mean of the fold-change in transcript levels of all the genes in selected functional categories or of selected genes associated with individual traits. The fold-change values were relative to transcript levels in the basal medium. The geometric means were calculated by exponentiating the arithmetic average of all the estimated log fold-changes in each category. The unidentified NRPS was encoded by Psyr_4311-4315.
P. syringae Traits Strongly Favored on the Leaf Surface Include Motility and Specific Amino Acid Metabolism Pathways.
Flagellar synthesis and motility.
The mean induction level of genes related to flagellar synthesis and motility was >4.5-fold greater for cells in epiphytic than apoplastic sites (Fig. 5 and Table S3). Flagellar motility contributes to P. syringae invasion of bean leaves (9) and to Salmonella enterica invasion through stomata into submerged leaves (10). It also contributes to B728a fitness on bean leaf surfaces, in part by promoting movement to sites protected from environmental stresses (11). The strong preferential expression of flagellar motility genes on leaf surfaces suggests more active relocation for nutrients on the surface than in the interior, as well as possibly movement to stomata for entry into the interior.
Swarming motility by B728a requires surfactant production (12). The rhlA gene that is involved in synthesizing the surfactant 3-(3-hydroxyalkanoyloxy) alkanoic acid (HAA) (12) also was induced more in epiphytic cells (9.1-fold) than in apoplastic cells (6.7-fold). Although the rhlA transcripts were more abundant than 97% of the other B728a genes in the basal medium, this gene was induced 50-fold by nitrogen limitation. Based on the known role of HAA in swarming motility, this induction pattern is consistent with HAA and swarming motility contributing to cellular motility to acquire nutrients on leaf surfaces.
Chemosensing and chemotaxis.
Genes involved in chemosensing and chemotaxis generally were induced in epiphytic cells but were repressed in apoplastic cells (Fig. 5 and Table S3). This finding suggests that active, directed movement to nutrients is not needed in the apoplast. The role of chemotaxis in P. syringae fitness and pathogenesis has not been evaluated. P. syringae exhibits chemotaxis to host extracts (13) and to the plant hormone ethylene (14), although the gene for the putative ethylene methyl-accepting chemotaxis protein, Psyr_2682, was not induced in planta. The need for chemosensing and chemotaxis on leaves is supported by the heterogeneous distribution of nutrients on leaves, as assessed using a fructose bioreporter (6) and the preferential formation of P. syringae aggregates near glandular trichomes (15), suggesting a benefit from attraction to the compounds at these sites.
Phenylalanine metabolism.
Although genes involved in amino acid metabolism and transport generally were decreased in expression in planta (Fig. 4B), genes for phenylalanine catabolism were induced by an average of 12.2-fold in epiphytic cells and 5.9-fold in apoplastic cells (Fig. 5). These genes encode orthologs to Pseudomonas putida enzymes that degrade phenylalanine to tyrosine via PhhAB and tyrosine to homogentisate, acetoacetate, and fumarate via Hpd, HmgABC, and a two-subunit acetoacetyl-CoA transferase, DhcAB (16). Although B728a lacks an HmgC ortholog, genes for the other seven enzymes were induced in both in planta sites. The induction of phhAB by phenylalanine (Fig. S7) suggests that sufficient phenylalanine is present to induce a high level of expression on leaf surfaces and a moderate level in the apoplast. Phenylalanine in plants serves as a substrate for the synthesis of phenylpropanoid compounds, which are important in plant defense. Moreover, phenylalanine and tyrosine levels increase in Arabidopsis plants following infection with P. syringae strain DC3000, based on metabolomic analyses (17), and suppression of genes for some key phenylpropanoid biosynthetic enzymes was associated with P. syringae type III effector proteins (18). These observations support a model in which P. syringae infection elicits phenylalanine synthesis as a step toward phenylpropanoid synthesis and in which P. syringae delivery of effector proteins suppresses this plant defense response. Our results are surprising in their support for increased catabolism of these amino acids by B728a, particularly on leaf surfaces, suggesting that B728a activates these plant defenses before infection of the apoplast and counteracts this defense response through active aromatic amino acid degradation on the leaf surface.
Tryptophan and indole-3-acetic acid metabolism.
Transcripts for the trpAB operon also showed large increases in the cells recovered from plants. In P. putida, trpAB is induced by TrpI in response to indole 3-glycerol phosphate (InGP), whereas trpEFGDC is repressed by TrpI in response to tryptophan (19). Transcripts of trpEFGDC in B728a decreased approximately twofold in both in planta sites (Table S3), suggesting the presence of tryptophan both on and in the leaves. In contrast, the ∼4.2-fold induction of trpAB in epiphytic cells and 1.6-fold induction in apoplastic cells suggest the presence of InGP. A likely source of InGP on leaves is from TrpA-mediated conversion of indole to InGP, which may be converted to tryptophan via TrpAB (19). A likely source of the indole is from the plant, as suggested by the recent demonstration that P. syringae infection of Arabidopsis plants resulted in an increase in Arabidopsis transcripts involved in the synthesis of indole derivatives (17).
B728a has the genetic capacity to convert tryptophan to indole-3-acetamide (IAM) and then to indole-3-acetic acid (IAA) using the IaaM and IaaH proteins, respectively (20). We observed a five- to sevenfold induction of iaaM-1 in planta but almost no iaaH-1 or iaaH-2 expression, suggesting that IAM but not IAA likely was produced in planta. The fate of IAM, if produced, is not clear. B728a also appears to have the genetic capacity to convert indole-3-acetaldoxime, which is produced in Arabidopsis following P. syringae infection (17), to IAA. This pathway involves a putative aldoxime dehydratase (Psyr_0006) that dehydrates indole-3-acetaldoxime to indole-3-acetonitrile and a nitrilase (Psyr_0007) that has been shown to convert indole-3-acetonitrile to IAA (21). However, transcript levels for these two genes were extremely low in basal medium and were not altered in planta, suggesting that IAA likely was not produced by this pathway. Although IAA production by another P. syringae strain influences its interaction with bean plants (20), our results do not provide evidence for IAA production by B728a on leaves.
P. syringae Traits Strongly Favored in the Apoplast Include GABA Uptake and Catabolism and the Production of Various Secondary Metabolites.
GABA metabolism and transport.
Genes involved in the metabolism and transport of the nonprotein amino acid GABA were induced an average of 4.1-fold in apoplastic sites and 2.2-fold in epiphytic sites (Fig. 5). These genes include gabP, which encodes a GABA permease for uptake, and three paralogs for gabT and gabD, which encode enzymes that sequentially convert GABA to succinate (22). With the exception of gabD-2, all these genes were induced in planta and were induced more in the apoplast than on the leaf surface. They also were induced by nitrogen limitation (Table S3), consistent with the use of GABA as a carbon and nitrogen source (23). As in B728a, gabP in P. syringae pv. phaseolicola was induced by apoplastic fluid from bean leaves (24). This induction likely reflects the availability of plant-derived GABA. The presence of plant-derived GABA in bean is suggested by the high levels of GABA found in the apoplastic fluid of healthy, uninfected tomato leaves (23) and by the threefold increase in GABA levels in Arabidopsis leaves following P. syringae infection (17). Interestingly, GABA may play a regulatory role in addition to its nutritional role, because high (>1 mM) GABA concentrations inhibited P. syringae growth in planta, strongly reduced expression of the hrpL and avrPto virulence genes, and induced the Arabidopsis defense gene PR1 (22). The greater induction of genes for GABA catabolism in the apoplast than in epiphytic sites may be associated with a greater need to prevent GABA-mediated repression of virulence genes during its apoplastic, or pathogenic, phase. Several GABA genes, including gabT and gabD, were induced by osmotic stress; this observation is consistent with the speculation that GabT has a role in polyamine homeostasis and thus in osmoregulation (22).
Production of secondary metabolites.
Many genes for secondary metabolites that are synthesized by nonribosomal peptide synthetases (NRPSs) or NRPSs fused with polyketide synthetases (PKSs) were induced more in the apoplast than on leaf surfaces. For example, genes involved in the synthesis and transport of the phytotoxins syringomycin and syringopeptin were induced an average of 11.4- and 4.9-fold in apoplastic and epiphytic sites, respectively (Fig. 5). This result is consistent with a previous report that the syringomycin syrE gene was induced in B728a during its association with bean leaves (8). Transcript levels of most syringomycin and syringopeptin genes were not affected by the in vitro treatments, consistent with the need for plant-derived compounds for induction (25). Transcripts for the syringomycin synthesis genes were increased more than those of the syringopeptin genes in planta. The relative contribution of these phytotoxins to virulence on bean leaves is not known, but for strain B301D on immature cherry fruit, syringopeptin was found to contribute more to virulence than syringomycin (2).
The sylABCDE genes involved in the synthesis and transport of syringolin A, a compound produced by a mixed NRPS/PKS, were induced 5.8- and 1.6-fold in cells in the apoplast and on the leaf surface, respectively (Fig. 5). Syringolin A was first identified as a peptide elicitor of resistance to a fungal pathogen in rice (26) but later was recognized as a virulence factor of B728a on bean. Syringolin A recently was shown to contribute to B728a virulence on bean by counteracting an initial step in basal plant immunity, stomatal closure (27). Syringolin A does so by irreversibly inhibiting the eukaryotic proteasome, possibly preventing turnover of the key defense protein NPR1 (27). Although open stomata primarily should benefit cells on the leaf surface, the greater induction of the syl genes in the apoplast than on the leaf surface suggests that syringolin A may have additional functions, including suppression of additional host defenses following movement into the apoplast and promoting egression back onto the leaf surface after colonization of the apoplast.
A third set of genes encoding NRPSs are the genes involved in syringafactin synthesis. The syringafactin synthesis (syfAB) and regulatory (syfR) genes were induced in the apoplast (3.9-fold) and slightly less in epiphytic sites (Fig. 5). Syringafactin is a linear lipopeptide surfactant that contributes to P. syringae swarming motility (28). The induction of this surfactant on the surface of an agar medium occurs at the transcriptional level (29), indicating that increased transcript levels in planta correlate with increased syringafactin production. The syfAB transcript levels in the basal medium and the induction levels in planta were much lower than those for the HAA surfactant-encoding rhlA gene; this observation, combined with the higher syfAB induction in apoplastic than epiphytic sites and higher rhlA induction in epiphytic than apoplastic sites, suggests that these two surfactants may have distinctive roles during B728a interactions with leaves.
Two uncharacterized secondary metabolites—an operon encoding several PKSs, Psyr_4311–4315, and the NRPS-encoding gene, Psyr_3722—showed elevated transcripts in planta (Table S3). These genes, and all other NRPS- and PKS-encoding genes that were induced in planta, were induced more in the apoplast than on the leaf surface. This finding suggests a greater role for these secondary metabolites during the pathogenic phase of B728a’s association with leaves than during the epiphytic phase. Transcript levels of genes for three other NRPSs, as encoded by Psyr_1792–1795, Psyr_4662, and Psyr_5009–5012, were not altered in the in planta treatments, although Psyr_5009–5012 showed induction by iron and nitrogen limitation.
P. syringae Experienced Distinct Nutritional and Abiotic Environments on Leaf Surfaces Versus in the Leaf Interior.
Water limitation.
Three of the functional categories that were overrepresented based on gene induction in planta also were induced by osmotic stress (Fig. 4 A and C). These categories included polysaccharide synthesis and regulation, compatible solute synthesis, and quaternary ammonium compound (QAC) metabolism and transport. Transcripts of genes involved in the synthesis and regulation of alginate, a polysaccharide associated with enhanced tolerance to water limitation (30), were increased an average of twofold by the in planta treatments (Fig. 5) and 3.8-fold by osmotic stress (Table S3). Biosynthetic genes for the two major compatible solutes of B728a, N-acetylglutaminylglutamine amide (NAGGN) and trehalose (31), showed an even more pronounced induction in planta than the alginate genes, with an average of 13.2- and 8.2-fold induction in the apoplast for the NAGGN and trehalose genes, respectively (Fig. 5), as well as a strong response to osmotic stress, with an average of 42.5- and 10.9-fold induction, respectively (Table S3). The NAGGN and trehalose synthesis genes and the genes encoding transporters for osmoprotective QAC compounds were induced more in the apoplast than on leaf surfaces (Fig. 5 and Table S3). If these genes show a proportional response to water limitation, greater induction in the apoplast suggests that B728a was even more limited for water in the leaf interior than on the leaf surface under the growth conditions used. Water limitation in the apoplast may result from low water content, such as from rapid evapotranspiration, and/or from a high concentration of solutes, such as from nutrient leakage and secretion in the mesophyll.
Iron limitation.
We did not find evidence that B728a cells were limited for iron in planta. Three of the four functional categories that were overrepresented in the transcriptomes of the iron-limited cells were not overrepresented in either of the in planta transcriptomes (Fig. 4 A and C). Genes for the siderophore pyoverdin were induced fivefold more by iron limitation than those for the siderophore achromobactin, but almost none of these genes was induced in planta. Citrate also can function as a siderophore in P. syringae DC3000 (32), but putative genes for citrate-mediated iron uptake were not induced by iron limitation. Siderophore-mediated ferric iron uptake occurs via TonB-dependent outer-membrane receptors, with subsequent reduction and transport into the cell. Of the six tonB-exbB-exbD operons in B728a, only one, Psyr_0203–0205, was induced by iron limitation, and this operon was not induced in planta. Genes for iron storage proteins in the Dps, ferritin, and bacterioferritin families were repressed twofold on average by iron limitation but were induced twofold in planta. Last, three fecIR-like operons that encode regulators activating iron-starvation responses were induced by iron limitation, as expected, but were not induced in planta. Collectively, these results indicate that iron is available to B728a cells both on leaf surfaces and in the apoplast. This conclusion is consistent with the finding that few B728a cells were iron limited on bean leaves (5) and that DC3000 growth in the apoplast was not affected by loss of siderophore production (32).
Oxidative stress.
Genes for antioxidant enzymes were overrepresented in the transcriptome of cells exposed to oxidative stress but were not overrepresented in the in planta transcriptomes (Table S1). Antioxidant enzymes expressed in vitro were distinct from those expressed in planta. Of 17 antioxidant enzymes, genes for five were induced by oxidative stress: ahpF, ahpC, ohr, katA, and sodA. Genes for a distinct set of six enzymes were induced in planta: cpoF, which is predicted to encode a chloroperoxidase involved in the reduction of hydrogen peroxide, the catalase-encoding katE, katG, and katN genes, and the superoxide dismutase-encoding sodA and sodC genes. All but one of these genes were induced more in the apoplast than on the leaf surface, as illustrated by the 49-, 31-, and 15-fold induction of cpoF, katE, and katN, respectively, in the apoplast but only 11-, 12-, and eightfold induction, respectively, in epiphytic sites. These results suggest that B728a was exposed to some oxidative stress in plants and to more oxidative stress in the apoplast than on the leaf surface, as is consistent with a role for oxidative stress in plant defense, but also suggest that the protective enzymes invoked by B728a against oxidative stress in a host plant are distinct from those invoked in culture.
Nutritional metabolism.
We investigated whether B728a was nitrogen limited in planta. Nitrogen limitation in vitro decreased the transcript levels of 33% of the B728a genes, demonstrating that the nitrogen-limitation treatment caused a major metabolic downshift and thus conferred a severe limitation for nitrogen. An overrepresentation analysis showed that nitrogen limitation favored the induction of genes in the nitrogen-metabolism category (Fig. 4C), including many that are known or predicted to be induced by nitrogen limitation (Table S3). An overrepresentation analysis also indicated that the nitrogen-limitation treatment and growth in planta affected genes in many of the same functional categories (Fig. 4 B and D). To evaluate whether this similarity suggested limitation in planta, we examined the expression of a collection of genes assembled as indicators for nitrogen versus carbon limitation based on previous studies with Sinorhizobium meliloti and Bacillus licheniformis (Table S4) (33, 34). We found only equivocal evidence for nitrogen limitation in or on leaves, given that only 33% of the nitrogen-limitation indicator genes were induced in epiphytic sites, and only 11% were induced in the apoplast; moreover, only a quarter of the nitrogen-metabolism genes that were induced by the nitrogen-limitation treatment were induced in epiphytic sites, and only 13% were induced in the apoplast. The strongest evidence against severe nitrogen limitation on and in leaves was the finding that none of the 15 nitrogen metabolism genes that were induced the most by nitrogen limitation in vitro (Table S3) was induced in the apoplast, and only three were weakly induced in epiphytic sites. Thus, as we concluded above, the majority of B728a cells were not in a physiological state of starvation like that of the nitrogen-limited cells.
About half of the sulfur metabolism and transport genes were induced more in epiphytic sites than in apoplastic sites (Figs. 4A and 5). These genes included many involved in sulfonate uptake and metabolism, sulfate transport, sulfite oxidation, and thiosulfate reduction (Table S1). A previous study identified the B728a sulfonate metabolism ssuE gene as plant inducible (8), as we did here, but also identified the sulfur-related genes cysE and betC as plant inducible, which we did not. In general, sulfur nutrition in the phyllosphere is poorly understood.
Phosphate metabolism and transport genes were not overrepresented among the differentially expressed genes in planta; however, the genes that were expressed suggest active phosphate scavenging. Both an alkaline phosphatase and an ortholog of a protein involved in alkaline phosphatase secretion in P. aeruginosa, Psyr_3150, were induced in planta, as was the PhoB/PhoR two-component regulator of phosphate assimilation and a phosphate transporter (Table S3). All these genes showed greater levels of induction in epiphytic sites than in the apoplast, with the transporter showing the largest difference, an 18.5-fold increase in epiphytic sites compared with only a 3.5-fold increase in the apoplast. The reason for greater phosphate scavenging on the leaf surface than in the apoplast is not clear but could reflect differences in chemistry or competition from the small epiphytic microbial communities that likely were present.
As expected, carbohydrate and organic acid metabolism and transport genes were overrepresented among the genes induced in planta, with half of these genes induced in both epiphytic and apoplastic cells (Fig. 4A). Among the carbohydrates, a gene for a transporter of fucose, a plant cell-wall component, was induced only on the leaf surface (Table S5), and transporter genes for the five-carbon sugars ribose, arabinose, and xylose were induced in both environments, with those for xylose metabolism induced over 20-fold. In contrast, genes for the transport and metabolism of sucrose, inositol, and an unidentified disaccharide were induced far more in the apoplast than on the leaf surface. Among the organic acids, transporter genes for acetate, citrate, malate, and an unidentified dicarboxylate were induced more in epiphytic than apoplastic cells, whereas transporter genes for glycolate, malonate, and an unidentified tricarboxylate were induced more in the apoplast (Table S5). The presence of fructose, mannitol, and succinate in the basal medium precluded the detection of genes activated by their presence in planta.
Metabolism and transport genes for a few amino acids were induced in planta. These genes included transporters for glutamate/aspartate, glutamine, methionine, and histidine and, with the exception of the histidine transporter, were induced to similar levels in the epiphytic and apoplastic sites. The liuDCBAE genes, which are predicted to catalyze the second half of the leucine catabolic pathway, were induced an average of fivefold in planta (Table S3). Moreover, genes supporting histidine catabolism via urocanate were induced, and like the histidine transporter, were induced more in epiphytic than apoplastic sites (Table S3). Histidine is among the least abundant amino acids in leachates from bean leaves (35) and in apoplastic fluids from tomato leaves (23), suggesting that induction of these genes may reflect a novel role for histidine, consistent with the recent demonstration that histidine or urocanate has a key role in biofilm formation (36).
The expression of several additional metabolic genes provides insights into the nutritional environment of leaves for P. syringae. First, only 15% of the genes involved in nucleotide metabolism were induced, but half of these genes were predicted to promote degradation of the purine base xanthine and were induced on leaves and even more in the leaf apoplast (Table S3). This degradation may be associated with reducing the capacity for bean to generate superoxide as a component of defense (37). Second, genes for the potassium transporter KdpFABC were induced an average of 3.6-fold on leaf surfaces but were not induced in the apoplast. The conserved regulation of this transporter, namely induction by an osmotic upshift and by severe potassium starvation, suggests more osmotic fluctuations in epiphytic than apoplastic sites (because kdpFABC expression decreases once cells reach homeostasis in the presence of osmotic stress) or a deficit of potassium in surface sites, although the driving force for such a deficit is not clear. Third, the betIAB genes that enable conversion of choline to the osmoprotective compound glycine betaine were induced more in the apoplast (8.1-fold) than in epiphytic sites (3.3-fold), supporting previous evidence that choline is abundant on leaves (38) and that water stress may be greater in the apoplast. Thirteen genes that likely contribute to glycine betaine catabolism in B728a also were induced in planta (Table S3), suggesting that these QAC compounds serve as a source of nutrition as well as osmoprotection. Last, a polyamine transporter gene was induced 13.4- and 8.7-fold in epiphytic and apoplastic sites, respectively (Table S3), suggesting that polyamines such as spermidine or putrescine, which are known to be abundant in plants, are used by P. syringae during leaf colonization.
Although the type III secretion system (T3SS) and its secreted factors are critical to P. syringae virulence (18), the T3SS genes were expressed at low levels in the basal medium and in planta (Table S3). Almost 90% of these genes were induced by the low-nitrogen treatment, consistent with the role of RpoN in expression of hrpL. Their lack of detectable expression in planta may indicate induction in only a subset of the cells, as was shown recently for avrPto in B728a in epiphytic and apoplastic sites (39), or induction that was only transient after infection and no longer was detectable at 48–72 h after inoculation.
P. syringae Phage Genes Were Induced in planta and Particularly in the Apoplast.
A surprising finding was that phage-related genes in B728a were overrepresented among the differentially expressed genes in cells from apoplastic but not epiphytic sites (Fig. 4A). B728a has two clusters of putative prophage or phage genes, the 90-gene region Psyr_2762–2854 and the seven-gene region Psyr_4586–4592, and another 28 genes that are insertion elements, transposases, phage integrases, or other phage-related genes. None of the genes in the seven-gene region were induced in planta, whereas 60 of the 90 genes in the other region were induced in apoplastic cells, at an average of 3.2-fold, and 35 genes were induced in epiphytic cells, at an average of twofold. A similar bias toward the apoplast was shown in the remaining 28 genes, with six showing increased expression in the apoplast compared with only two on leaf surfaces. Consistent with our findings, a recent characterization of the infectivity of phage isolated from the leaf surface versus from the leaf interior demonstrated greater infectivity of phage from the leaf interior (40).
Conclusions
Global transcriptome profiling of P. syringae B728a cells recovered from the leaf surface and leaf interior indicate that these two habitats offer distinct environments for the bacteria and thus likely present distinct driving forces for P. syringae adaptation (Fig. S8 and SI Conclusions). This conclusion is congruent with the finding that these habitats select for distinct bacterial and phage communities (40). Overall, the transcript profiles of B728a support a model in which the epiphytic environment favors motility, chemosensing, and chemotaxis, including HAA surfactant-mediated swarming, and offers a nutritional environment that requires scavenging of phosphate but not iron, active uptake of exogenous sulfur compounds, and utilization of plant-derived indole as a source of tryptophan. Although the microhabitats on a leaf are heterogeneous in their environmental conditions, and these studies captured only the average transcript levels across cells, the transcript profiles indicate that the leaf environment is water limited in general. Furthermore, they suggest that the cells in epiphytic sites experience greater fluctuations but less severe shortages in water availability than the cells in the apoplast under the conditions tested. The epiphytic environment also favors phenylalanine degradation, which may be a mechanism to counteract phenylpropanoid-based plant defense responses even before infection of the apoplast.
Transcript profiles in the apoplast support a model in which B728a cells experience at least low levels of oxidative stress, with potentially distinct responses to this stress in planta and in culture. Moreover, the cells experience surprisingly high levels of water stress, which could be related to plant defense, as shown for a resistance response (41) or could be an effect of rapid evapotranspiration or high solute concentrations in interior sites. The apoplastic environment favors the degradation of the alternative amino acid GABA, perhaps contributing to virulence by attenuating GABA repression of virulence (22), and also favors the synthesis of secondary metabolites, including two phytotoxins, several as yet uncharacterized secondary metabolites, and syringolin A. Syringolin A production in the apoplast suggests an expanded function, including suppression of host defenses beyond stomatal closure and possibly eventual enhancement of stomatal opening for egression back to the surface. Finally, the apoplastic environment preferentially activates phage-related genes within the B728a chromosome, with interesting implications for the activation and activity of phages and their associated role in gene transfer, community dynamics, and possibly even pathogen control in the leaf habitat.
Methods
Bacterial Strain and Growth Media.
The complete genome sequence is available for P. syringae pv. syringae strain B728a (42), a foliar pathogen originally isolated from a bean leaf (Phaseolus vulgaris L.) in Wisconsin (43). B728a was grown in King’s B medium (44) containing 50 μg/mL of rifampin or in modified HRP MM-mannitol medium (45) (hereafter designated “HMM medium”), which contained 11mM D-fructose, 11mM D-mannitol, 17mM succinate, 10 mM L-glutamine, 10 µM FeCl3, 10 µM N-(β-ketocaproyl)-L-homoserine lactone (AHL), 50 mM potassium phosphate buffer, 7.6 mM (NH4)2SO4, 1.7 mM MgCl2, and 1.7 mM NaCl. This study was part of a broader study evaluating nine B728a mutants; glutamine, FeCl3, and AHL were included in this medium to meet the needs of these mutants. All chemicals were purchased from Sigma-Aldrich. Bacteria were grown at 25 °C.
Exposure of Bacteria to Environmental Stress Conditions In Vitro for RNA Extraction.
B728a cells were grown on solid King’s B medium, transferred to liquid HMM medium, and subcultured twice in this medium. When the cells reached late-log phase (5 × 10⁸ cfu/mL), they were collected by centrifugation at 5,000 × g for 10 min. The cell pellets were resuspended in HMM medium lacking L-glutamine, FeCl3, AHL, and (NH4)2SO4 (hereafter designated “HMM-FeN medium”). The cells were washed in HMM-FeN and resuspended in HMM-FeN to a final density of 2.5 × 10⁹ cfu/mL Aliquots were transferred to five test tubes and diluted to 2.5 × 10⁸ cfu/mL with (i) HMM medium; (ii) HMM medium with NaCl to a final concentration of 0.23 M; (iii) HMM medium with H2O2 to a final concentration of 0.5 mM; (iv) HMM medium lacking FeCl3 but with N,N’-di(2-hydroxybenzyl)ethylenediamin-N,N’-diacetic acid monohydrochloride hydrate (Strem Chemicals, Inc.) to a final concentration of 100 µM; or (v) HMM medium lacking L-glutamine, (NH4)2SO4, and AHL; these media were designated as the basal medium, osmotic stress, oxidative stress, iron-limitation, and nitrogen-limitation treatments, respectively. Cells were incubated with shaking at 25 °C and were diluted with an RNA-stabilizing agent (RNAprotect Bacteria Reagent; Qiagen, Inc.) after 15 min for tubes 1–3 and after 2 h for tubes 4 and 5. This procedure was performed simultaneously with two replicate cultures derived from independent colonies, and the treated cells from the two cultures were combined after dilution with the RNA-stabilizing agent. These cells were harvested by centrifugation at 5,000 × g for 10 min, the supernatant was removed, and the cell pellets were stored at −20 °C. This procedure was repeated in its entirety a separate time, and the RNA isolated from each of the two cell pellets, as described below, was pooled. This pooled RNA, which was derived from four independent cultures, served as a single biological replicate for a treatment. Two biological replicates for each treatment were generated in this way at each of three separate laboratories at Iowa State University (“laboratory A”), University of California, Berkeley (“laboratory B”), and Texas A&M University (“laboratory C”).
Growth of Bacteria in Planta for RNA Extraction.
Beans (P. vulgaris cultivar Bush Blue Lake 274) were grown in potting medium until the primary leaves were fully expanded, with an average of five germinated plants per 4-in pot. The inoculum cells were grown as described above for the in vitro treatments, and after the initial collection by centrifugation, the cells were suspended in water containing 0.01% Silwet L-77 (Lehle Seeds) to a density of 1 × 10⁶ cfu/mL. To establish epiphytic populations, bacteria were introduced by spraying onto both the adaxial and abaxial surfaces of the leaves to run-off, immediately enclosing the plants in a mist chamber with 95% relative humidity, and incubating for 24 h. The chamber was opened partially until the visible water on the leaves had evaporated; then the chamber was resealed, and the plants were incubated without active humidification for another 48 h. The incubations were at 25 °C with ambient but not supplemental lighting. A total of 400–600 primary leaves were collected, immediately submerged in 2 L of an acidic phenol RNA-stabilizing solution [10 mL water-saturated phenol (pH <7.0), 190 mL ethanol, 1.8 L water] (46), sonicated for 10 min, and then physically removed from the solution. The bacterial cells in the suspension were harvested by centrifugation at 5,000 × g for 10 min, and the cell pellets were suspended in residual supernatant and filtered through a 5-μm filter (Millex-SV syringe filter unit; Millipore Corp.). The cells in the filtrate were harvested by centrifugation at 5,000 × g for 5 min, the supernatant was discarded, and the pellets were placed at −20 °C. The cells collected from the 400–600 leaves on a single day served as a biological replicate, and the procedure was repeated to provide two biological replicates. Because of the availability of facilities, all the epiphytic treatments were conducted at the University of California, Berkeley laboratory with cultures provided from each of the other laboratories, and the cell pellets were returned to those laboratories for RNA extraction and analysis.
To establish apoplastic populations, bacteria were introduced by vacuum infiltration into leaves that were submerged in the inoculum. The plants and bacteria were grown, and the inoculum was prepared, as described above. Infiltrated plants were incubated for 48 h under plant growth lights with a 12-h photoperiod. A total of 40–80 leaves were collected and submerged immediately in an acidic phenol RNA-stabilizing solution, described above. The leaves were cut into squares (∼3 × 3 mm2) while submerged, and the plant tissues and liquid were sonicated for 10 min. The solution was filtered through Whatman #1 filter paper, with repeated filter changes. The filtrate was centrifuged at 7,000 × g for 10 min, and the pellet was suspended in residual supernatant. The suspension was filtered through a 5-µm filter with repeated filter changes. The bacterial cells were harvested by centrifugation at 7,000 × g for 10 min, the supernatant was discarded, and the pellets were flash frozen and placed at −20 °C. The cells collected from the 40–80 leaves on a single day served as a biological replicate, and two biological replicates were generated at each of the three laboratories.
RNA Extraction, Microarray Design, and Hybridization.
RNA was purified using a Qiagen RNeasy mini kit, and DNA was removed using the on-column DNase I digestion with subsequent DNase I removal. RNA integrity was evaluated using an Agilent 2100 Bioanalyzer. RNA samples were sent to Roche NimbleGen, Inc. for conversion into cDNA, labeling with U-CYA-3 fluorophore, and hybridization to a B728a ORF-based microarray.
The B728a microarray was designed using the complete genome sequence for B728a (RefSeqNC_007005.1) and 75 predicted small, noncoding RNA (sRNA) genes. The latter included 13 sRNAs that were known or were similar to known sRNAs, 46 putative sRNAs that were predicted by the small RNA identification protocol using high-throughput technologies (SIPHT) (47), and 16 putative sRNAs that were identified in a previous screen for plant-inducible genes (8). Each gene was represented by 14 60-mer nucleotide probes, with a few exceptions (namely 11 ORFs and four sRNAs that were represented by fewer probes because of their short size or low complexity). Two ORFs, Psyr_2216 and Psyr_3732, and 13 sRNA genes were omitted from the array because of their extreme shortness or low complexity, and another 16 ORFs and one sRNA showed sequence similarity to other probe sets that was too high to enable them to be represented by the remaining probes. A total of 5,132 features were represented on the final microarray, including 5,071 ORFs and 61 putative sRNAs. Each slide contained four replicate arrays. Although the data are not included in this report, the microarray experiment was performed with an additional nine B728a mutant strains that were each subjected to the five in vitro and two in planta treatments in a full factorial design; thus, the treatments were arranged on the slides to maximize the pairing of treatment comparisons of interest. The data for all 10 strains were included in the analysis, described below, although only the results for the wild-type B728a are presented in this report. The expression data from this report have been deposited in the National Center for Biotechnology Information’s Gene Expression Omnibus (accession no. GSE42544) according to Minimum Information About a Microarray Experiment (MIAME) guidelines and are accessible through GEO (accession no. GSE42544).
Microarray Data Analysis.
The fluorescence intensity for each probe was measured and subjected to robust multiarray averaging, which included adjustment for the background intensity, log2 transformation, quantile normalization, and median polishing (48). A robust estimated mean value was determined for each feature on the array. A linear model analysis of the resulting data was conducted for each feature. Each linear model included fixed effects for replications, treatments, strains, and treatment-by-strain interactions, as well as a fixed intercept parameter and one random error effect for each observation. Linear models for microarray data analysis (49) were applied to share information across genes when estimating error variances. Application of the linear models was performed separately for distinct groups of treatments that had similar absolute median residuals. The resulting variance estimates were used to calculate Welch t statistics and corresponding P values among all pairwise treatment comparisons of interest. For each comparison of interest, q values were estimated from the corresponding distribution of P values, as described previously (50). Features exhibiting a P value < 0.05 and a q value < 0.01 (i.e., an estimated False Discovery Rate less than 1%) were identified as differentially expressed.
A meta-analysis was performed on the datasets from the three laboratories using the following approach. The set of three two-sided P values corresponding to a single gene that were derived from the three laboratory datasets were considered to result from a common hypothesis test across the three laboratories. For each two-sided P value, the corresponding quantile ( 0.5 P) from a standard normal distribution was found, and the positive or negative quantile sign was matched to the sign of the t statistic from which the original P value was calculated. The average of the three quantiles was compared further with a standard normal distribution with mean 0 and variance 1/3 to obtain a single two-sided P value based on the combined information across the three laboratory datasets. The q values were estimated from the distribution of corresponding P values, as described above, and features in the meta-analysis exhibiting a P value < 0.05 and a q value < 0.01 were identified as differentially expressed.
Within a dataset from a laboratory, the linear model analysis yielded an estimated fold-change value between a treatment and the basal medium for each feature on the microarray. For the combined dataset from the three laboratories, the estimated fold-change values were computed by exponentiating the average of the estimated log-transformed fold-change values for the three laboratory datasets using the inverse of the estimated variances as weights. The geometric mean of the fold-change values across genes was calculated based on exponentiating the arithmetic mean of the log-transformed fold-change values.
Hierarchical Clustering.
A dendrogram was generated using the fluorescent intensities for each of the biological replicates from the three laboratory datasets. The data for each gene were subjected to an ANOVA across the seven treatments. The observed intensities from the 500 genes that exhibited the lowest P values in an F test for the combined effect of all treatments from this ANOVA were used to perform hierarchical clustering among all the samples. The observed intensities for each gene were divided by the gene’s estimated SD, so that each gene would contribute roughly equally to the distance metric during clustering. The hierarchical clustering was performed by the “hclust” function in R using Manhattan distance in a “bottom-up” approach.
Assignment and Analysis of Gene Representation in Functional Categories.
The B728a genes were assigned to 63 functional categories (Table S2). These assignments were based on the genome annotation, KEGG pathway assignments, and known or predicted functions based on the literature. Each gene was assigned to a single functional category or to no category if it could be placed into multiple categories or its function was unknown. For each functional category, we formed a 2 × 2 contingency table reporting the number of differentially expressed and nondifferentially expressed genes included in the given category and, separately, those for genes not included in the given category. We then performed a Fisher’s exact test to evaluate overrepresentation of the differentially expressed genes. We performed this analysis separately for the differentially induced genes and the differentially repressed genes. The q values were generated from the resulting P values, as described above.
Supplementary Material
Acknowledgments
We thank David Morgan and Jia Wang for help with the bacterial recovery from leaf surfaces. This project was supported by the National Research Initiative Competitive Grants Program Grant 2008-35600-18766 from the US Department of Agriculture National Institute of Food and Agriculture.
Footnotes
The authors declare no conflict of interest.
Data deposition: The data reported in this paper have been deposited in the Gene Expression Omnibus (GEO) database, www.ncbi.nlm.nih.gov/geo (accession no. GSE42544).
This article contains supporting information online at www.pnas.org/lookup/suppl/doi:10.1073/pnas.1221892110/-/DCSupplemental.
References
- 1.Monier JM, Lindow SE. Pseudomonas syringae responds to the environment on leaves by cell size reduction. Phytopathology. 2003;93(10):1209–1216. doi: 10.1094/PHYTO.2003.93.10.1209. [DOI] [PubMed] [Google Scholar]
- 2.Scholz-Schroeder BK, Hutchison ML, Grgurina I, Gross DC. The contribution of syringopeptin and syringomycin to virulence of Pseudomonas syringae pv. syringae strain B301D on the basis of sypA and syrB1 biosynthesis mutant analysis. Mol Plant Microbe Interact. 2001;14(3):336–348. doi: 10.1094/MPMI.2001.14.3.336. [DOI] [PubMed] [Google Scholar]
- 3.Hirano SS, Charkowski AO, Collmer A, Willis DK, Upper CD. Role of the Hrp type III protein secretion system in growth of Pseudomonas syringae pv. syringae B728a on host plants in the field. Proc Natl Acad Sci USA. 1999;96(17):9851–9856. doi: 10.1073/pnas.96.17.9851. [DOI] [PMC free article] [PubMed] [Google Scholar]
- 4.Yu J, Peñaloza-Vázquez A, Chakrabarty AM, Bender CL. Involvement of the exopolysaccharide alginate in the virulence and epiphytic fitness of Pseudomonas syringae pv. syringae. Mol Microbiol. 1999;33(4):712–720. doi: 10.1046/j.1365-2958.1999.01516.x. [DOI] [PubMed] [Google Scholar]
- 5.Joyner DC, Lindow SE. Heterogeneity of iron bioavailability on plants assessed with a whole-cell GFP-based bacterial biosensor. Microbiology. 2000;146(Pt 10):2435–2445. doi: 10.1099/00221287-146-10-2435. [DOI] [PubMed] [Google Scholar]
- 6.Leveau JHJ, Lindow SE. Appetite of an epiphyte: Quantitative monitoring of bacterial sugar consumption in the phyllosphere. Proc Natl Acad Sci USA. 2001;98(6):3446–3453. doi: 10.1073/pnas.061629598. [DOI] [PMC free article] [PubMed] [Google Scholar]
- 7.Boch J, et al. Identification of Pseudomonas syringae pv. tomato genes induced during infection of Arabidopsis thaliana. Mol Microbiol. 2002;44(1):73–88. doi: 10.1046/j.1365-2958.2002.02877.x. [DOI] [PubMed] [Google Scholar]
- 8.Marco ML, Legac J, Lindow SE. Pseudomonas syringae genes induced during colonization of leaf surfaces. Environ Microbiol. 2005;7(9):1379–1391. doi: 10.1111/j.1462-2920.2005.00825.x. [DOI] [PubMed] [Google Scholar]
- 9.Panopoulous NJ, Schroth MN. Role of flagellar motility in invasion of bean leaves by Pseudomonas phaseolicola. Phytopathology. 1974;64(11):1389–1397. [Google Scholar]
- 10.Kroupitski Y, et al. Internalization of Salmonella enterica in leaves is induced by light and involves chemotaxis and penetration through open stomata. Appl Environ Microbiol. 2009;75(19):6076–6086. doi: 10.1128/AEM.01084-09. [DOI] [PMC free article] [PubMed] [Google Scholar]
- 11.Haefele DM, Lindow SE. Flagellar motility confers epiphytic fitness advantages upon Pseudomonas syringae. Appl Environ Microbiol. 1987;53(10):2528–2533. doi: 10.1128/aem.53.10.2528-2533.1987. [DOI] [PMC free article] [PubMed] [Google Scholar]
- 12.Burch AY, et al. Pseudomonas syringae coordinates production of a motility-enabling surfactant with flagellar assembly. J Bacteriol. 2012;194(6):1287–1298. doi: 10.1128/JB.06058-11. [DOI] [PMC free article] [PubMed] [Google Scholar]
- 13.Cuppels DA. Chemotaxis by Pseudomonas syringae pv. tomato. Appl Environ Microbiol. 1988;54(3):629–632. doi: 10.1128/aem.54.3.629-632.1988. [DOI] [PMC free article] [PubMed] [Google Scholar]
- 14.Kim HE, Shitashiro M, Kuroda A, Takiguchi N, Kato J. Ethylene chemotaxis in Pseudomonas aeruginosa and other Pseudomonas species. Microbes Environ. 2007;22(2):186–189. [Google Scholar]
- 15.Monier JM, Lindow SE. Frequency, size, and localization of bacterial aggregates on bean leaf surfaces. Appl Environ Microbiol. 2004;70(1):346–355. doi: 10.1128/AEM.70.1.346-355.2004. [DOI] [PMC free article] [PubMed] [Google Scholar]
- 16.Arias-Barrau E, et al. The homogentisate pathway: A central catabolic pathway involved in the degradation of L-phenylalanine, L-tyrosine, and 3-hydroxyphenylacetate in Pseudomonas putida. J Bacteriol. 2004;186(15):5062–5077. doi: 10.1128/JB.186.15.5062-5077.2004. [DOI] [PMC free article] [PubMed] [Google Scholar]
- 17.Ward JL, et al. The metabolic transition during disease following infection of Arabidopsis thaliana by Pseudomonas syringae pv. tomato. Plant J. 2010;63:443–457. doi: 10.1111/j.1365-313X.2010.04254.x. [DOI] [PubMed] [Google Scholar]
- 18.Truman W, de Zabala MT, Grant M. Type III effectors orchestrate a complex interplay between transcriptional networks to modify basal defence responses during pathogenesis and resistance. Plant J. 2006;46(1):14–33. doi: 10.1111/j.1365-313X.2006.02672.x. [DOI] [PubMed] [Google Scholar]
- 19.Molina-Henares MA, et al. Functional analysis of aromatic biosynthetic pathways in Pseudomonas putida KT2440. Microb Biotechnol. 2009;2(1):91–100. doi: 10.1111/j.1751-7915.2008.00062.x. [DOI] [PMC free article] [PubMed] [Google Scholar]
- 20.Mazzola M, White FF. A mutation in the indole-3-acetic acid biosynthesis pathway of Pseudomonas syringae pv. syringae affects growth in Phaseolus vulgaris and syringomycin production. J Bacteriol. 1994;176(5):1374–1382. doi: 10.1128/jb.176.5.1374-1382.1994. [DOI] [PMC free article] [PubMed] [Google Scholar]
- 21.Howden AJ, Rico A, Mentlak T, Miguet L, Preston GM. Pseudomonas syringae pv. syringae B728a hydrolyses indole-3-acetonitrile to the plant hormone indole-3-acetic acid. Mol Plant Pathol. 2009;10(6):857–865. doi: 10.1111/j.1364-3703.2009.00595.x. [DOI] [PMC free article] [PubMed] [Google Scholar]
- 22.Park DH, et al. Mutations in γ-aminobutyric acid (GABA) transaminase genes in plants or Pseudomonas syringae reduce bacterial virulence. Plant J. 2010;64(2):318–330. doi: 10.1111/j.1365-313X.2010.04327.x. [DOI] [PubMed] [Google Scholar]
- 23.Rico A, Preston GM. Pseudomonas syringae pv. tomato DC3000 uses constitutive and apoplast-induced nutrient assimilation pathways to catabolize nutrients that are abundant in the tomato apoplast. Mol Plant Microbe Interact. 2008;21(2):269–282. doi: 10.1094/MPMI-21-2-0269. [DOI] [PubMed] [Google Scholar]
- 24.Hernández-Morales A, et al. Transcriptional profile of Pseudomonas syringae pv. phaseolicola NPS3121 in response to tissue extracts from a susceptible Phaseolus vulgaris L. cultivar. BMC Microbiol. 2009;9:257. doi: 10.1186/1471-2180-9-257. [DOI] [PMC free article] [PubMed] [Google Scholar]
- 25.Mo YY, Gross DC. Plant signal molecules activate the syrB gene, which is required for syringomycin production by Pseudomonas syringae pv. syringae. J Bacteriol. 1991;173(18):5784–5792. doi: 10.1128/jb.173.18.5784-5792.1991. [DOI] [PMC free article] [PubMed] [Google Scholar]
- 26.Waspi U, Blanc D, Winkler T, Ruedi P, Dudler R. Syringolin, a novel peptide elicitor from Pseudomonas syringae pv. syringae that induces resistance to Pyricularia oryzae in rice. Mol Plant Microbe Interact. 1998;11(8):727–733. [Google Scholar]
- 27.Schellenberg B, Ramel C, Dudler R. Pseudomonas syringae virulence factor syringolin A counteracts stomatal immunity by proteasome inhibition. Mol Plant Microbe Interact. 2010;23(10):1287–1293. doi: 10.1094/MPMI-04-10-0094. [DOI] [PubMed] [Google Scholar]
- 28.Berti AD, Greve NJ, Christensen QH, Thomas MG. Identification of a biosynthetic gene cluster and the six associated lipopeptides involved in swarming motility of Pseudomonas syringae pv. tomato DC3000. J Bacteriol. 2007;189(17):6312–6323. doi: 10.1128/JB.00725-07. [DOI] [PMC free article] [PubMed] [Google Scholar]
- 29.Burch AY, Browne PJ, Dunlap CA, Price NP, Lindow SE. Comparison of biosurfactant detection methods reveals hydrophobic surfactants and contact-regulated production. Environ Microbiol. 2011;13(10):2681–2691. doi: 10.1111/j.1462-2920.2011.02534.x. [DOI] [PubMed] [Google Scholar]
- 30.Chang WS, et al. Alginate production by Pseudomonas putida creates a hydrated microenvironment and contributes to biofilm architecture and stress tolerance under water-limiting conditions. J Bacteriol. 2007;189(22):8290–8299. doi: 10.1128/JB.00727-07. [DOI] [PMC free article] [PubMed] [Google Scholar]
- 31.Kurz M, Burch AY, Seip B, Lindow SE, Gross H. Genome-driven investigation of compatible solute biosynthesis pathways of Pseudomonas syringae pv. syringae and their contribution to water stress tolerance. Appl Environ Microbiol. 2010;76(16):5452–5462. doi: 10.1128/AEM.00686-10. [DOI] [PMC free article] [PubMed] [Google Scholar]
- 32.Jones AM, Wildermuth MC. The phytopathogen Pseudomonas syringae pv. tomato DC3000 has three high-affinity iron-scavenging systems functional under iron limitation conditions but dispensable for pathogenesis. J Bacteriol. 2011;193(11):2767–2775. doi: 10.1128/JB.00069-10. [DOI] [PMC free article] [PubMed] [Google Scholar]
- 33.Voigt B, et al. The glucose and nitrogen starvation response of Bacillus licheniformis. Proteomics. 2007;7(3):413–423. doi: 10.1002/pmic.200600556. [DOI] [PubMed] [Google Scholar]
- 34.Krol E, Becker A. ppGpp in Sinorhizobium meliloti: Biosynthesis in response to sudden nutritional downshifts and modulation of the transcriptome. Mol Microbiol. 2011;81(5):1233–1254. doi: 10.1111/j.1365-2958.2011.07752.x. [DOI] [PubMed] [Google Scholar]
- 35.Morgan JV, Tukey HB. Characterization of leachate from plant foliage. Plant Physiol. 1964;39(4):590–593. doi: 10.1104/pp.39.4.590. [DOI] [PMC free article] [PubMed] [Google Scholar]
- 36.Cabral MP, et al. Proteomic and functional analyses reveal a unique lifestyle for Acinetobacter baumannii biofilms and a key role for histidine metabolism. J Proteome Res. 2011;10(8):3399–3417. doi: 10.1021/pr101299j. [DOI] [PubMed] [Google Scholar]
- 37.Montalbini P. Changes in xanthine oxidase activity in bean leaves induced by Uromyces phaseoli infection. J Phytopathol. 1992;134(1):63–74. [Google Scholar]
- 38.Chen C, Beattie GA. Pseudomonas syringae BetT is a low-affinity choline transporter that is responsible for superior osmoprotection by choline over glycine betaine. J Bacteriol. 2008;190(8):2717–2725. doi: 10.1128/JB.01585-07. [DOI] [PMC free article] [PubMed] [Google Scholar]
- 39.Lee J, et al. Type III secretion and effectors shape the survival and growth pattern of Pseudomonas syringae on leaf surfaces. Plant Physiol. 2012;158(4):1803–1818. doi: 10.1104/pp.111.190686. [DOI] [PMC free article] [PubMed] [Google Scholar]
- 40.Koskella BKB, Thompson JN, Preston GM, Buckling A. Local biotic environment shapes the spatial scale of bacteriophage adaptation to bacteria. Am Nat. 2011;177(4):440–451. doi: 10.1086/658991. [DOI] [PubMed] [Google Scholar]
- 41.Freeman BC, Beattie GA. Bacterial growth restriction during host resistance to Pseudomonas syringae is associated with leaf water loss and localized cessation of vascular activity in Arabidopsis thaliana. Mol Plant Microbe Interact. 2009;22(7):857–867. doi: 10.1094/MPMI-22-7-0857. [DOI] [PubMed] [Google Scholar]
- 42.Feil H, et al. Comparison of the complete genome sequences of Pseudomonas syringae pv. syringae B728a and pv. tomato DC3000. Proc Natl Acad Sci USA. 2005;102(31):11064–11069. doi: 10.1073/pnas.0504930102. [DOI] [PMC free article] [PubMed] [Google Scholar]
- 43.Loper JE, Lindow SE. Lack of evidence for in situ fluorescent pigment production by Pseudomonas syringae pv. syringae on bean leaf surfaces. Phytopathology. 1987;77(10):1449–1454. [Google Scholar]
- 44.King EO, Ward MK, Raney DE. Two simple media for the demonstration of pyocyanin and fluorescin. J Lab Clin Med. 1954;44(2):301–307. [PubMed] [Google Scholar]
- 45.Huynh TV, Dahlbeck D, Staskawicz BJ. Bacterial blight of soybean: Regulation of a pathogen gene determining host cultivar specificity. Science. 1989;245(4924):1374–1377. doi: 10.1126/science.2781284. [DOI] [PubMed] [Google Scholar]
- 46.Khodursky AB, et al. Escherichia coli spotted double-strand DNA microarrays: RNA extraction, labeling, hybridization, quality control, and data management. Methods Mol Biol. 2003;224:61–78. doi: 10.1385/1-59259-364-X:61. [DOI] [PubMed] [Google Scholar]
- 47.Livny J, Teonadi H, Livny M, Waldor MK. High-throughput, kingdom-wide prediction and annotation of bacterial non-coding RNAs. PLoS ONE. 2008;3(9):e3197. doi: 10.1371/journal.pone.0003197. [DOI] [PMC free article] [PubMed] [Google Scholar]
- 48.Irizarry RA, et al. Exploration, normalization, and summaries of high density oligonucleotide array probe level data. Biostatistics. 2003;4(2):249–264. doi: 10.1093/biostatistics/4.2.249. [DOI] [PubMed] [Google Scholar]
- 49.Smyth GK. 2004. Linear models and empirical Bayes methods for assessing differential expression in microarray experiments. Stat Appl Genet Mol Biol 3:Art 3.
- 50.Nettleton D, Hwang JTG, Caldo RA, Wise RP. Estimating the number of true null hypotheses from a histogram of P values. J Agric Biol Environ Stat. 2006;11(3):337–356. [Google Scholar]
Associated Data
This section collects any data citations, data availability statements, or supplementary materials included in this article.