

Abstract
Optimal decision making requires that we integrate mnemonic information regarding previous decisions with value signals that entail likely rewards and punishments. The fact that memory and value signals appear to be coded by segregated brain regions, the hippocampus in the case of memory and sectors of prefrontal cortex in the case of value, raises the question as to how they are integrated during human decision making. Using magnetoencephalography to study healthy human participants, we show increased theta oscillations over frontal and temporal sensors during nonspatial decisions based on memories from previous trials. Using source reconstruction we found that the medial temporal lobe (MTL), in a location compatible with the anterior hippocampus, and the anterior cingulate cortex in the medial wall of the frontal lobe are the source of this increased theta power. Moreover, we observed a correlation between theta power in the MTL source and behavioral performance in decision making, supporting a role for MTL theta oscillations in decision-making performance. These MTL theta oscillations were synchronized with several prefrontal sources, including lateral superior frontal gyrus, dorsal anterior cingulate gyrus, and medial frontopolar cortex. There was no relationship between the strength of synchronization and the expected value of choices. Our results indicate a mnemonic guidance of human decision making, beyond anticipation of expected reward, is supported by hippocampal–prefrontal theta synchronization.
Introduction
Mnemonic information can guide optimal human decision making. As memory and value information are represented in different brain regions, optimal decision making requires a mechanism for integrating among and between such distributed neural populations (Buzsaki and Draguhn, 2004). This is likely to involve orchestration of memory signals in the hippocampus, a structure that represents memory for past events (Eichenbaum et al., 2007), and sectors of prefrontal cortex that encode value representations (Rushworth et al., 2011). Studies in rodents have shown that the hippocampus and medial prefrontal cortex are synchronized by neural oscillations in the theta frequency range (4–8 Hz) (Jones and Wilson, 2005; Siapas et al., 2005; Benchenane et al., 2010; Sigurdsson et al., 2010; Fujisawa and Buzsaki, 2011; Kim et al., 2011). The generality of these observations is limited by the fact that they rest heavily on studies that involve spatial navigation, working memory, and episodic memory with fixed reward expectations (Jones and Wilson, 2005; Siapas et al., 2005; Benchenane et al., 2010; Sigurdsson et al., 2010; Fujisawa and Buzsaki, 2011; Kim et al., 2011).
To investigate interregional synchronization during decision making, we studied 20 healthy human participants using magnetoencephalography (MEG). There is now good evidence that hippocampal activity can be detected and localized using MEG (Cornwell et al., 2008; Poch et al., 2011; Quraan et al., 2011; Kaplan et al., 2012). We hypothesized that rather than spatial navigation and reward anticipation, the key aspect underlying this synchronization is the need to use a memory-guided contextual rule to make the correct choice (Jones and Wilson, 2005; Benchenane et al., 2010; Fujisawa and Buzsaki, 2011; Kim et al., 2011). To address this hypothesis we designed a new decision-making task, devoid of spatial learning, that included active choice trials with different levels of reward and punishment where decisions were informed by memory of past trials. Furthermore, by acquiring MEG whole-head recordings, we determined whether the predicted synchrony between hippocampus and prefrontal cortex during decision making was anatomically specific or instead reflected a more extensive synchronized network.
We show theta synchronization between the medial temporal lobe (MTL) and the prefrontal cortex while human participants engaged in memory-guided decision making. This synchronization is related to decision making per se and not the expected value of any likely reward. The findings indicate that a mnemonic underpinning of human decision making, beyond anticipation of expected reward, involves theta synchronization between the hippocampus and sectors of prefrontal cortex.
Materials and Methods
Subjects.
Twenty adults participated in the experiment (10 female; age range, 19–30 years; mean, 22.4; SD = 2.98 years). A further seven participants were recruited but not scanned, as they failed to learn the dynamics of the task during training. All participants were healthy, right-handed, and had normal or corrected-to-normal visual acuity. None of the participants reported a history of neurological, psychiatric, or any other current medical problems. All experiments were run with each subject's written informed consent and in accordance to local ethics clearance (University College London, London, UK).
Experimental design and task.
Participants engaged in a new decision-making task (Fig. 1) designed to emulate, but also go beyond, tasks used in rats to study hippocampal–prefrontal synchrony. We hypothesized that the key aspect in these tasks is a need to deploy a memory-guided contextual rule so as to make the correct choice (Jones and Wilson, 2005; Siapas et al., 2005; Benchenane et al., 2010; Sigurdsson et al., 2010; Fujisawa and Buzsaki, 2011; Kim et al., 2011). On each trial, participants saw six distinct geometrical items in two groups, one to the right and one to the left of the screen. These geometric items varied in terms of shape and color. Participants were instructed to fixate their gaze on a black question mark in the middle of the screen (decision period). After 2000 ms the question mark turned white and participants had to choose one of the groups of items (response period). Following their response, the three nonchosen items were removed and the three chosen items remained on screen for a further 500 ms. Finally, after 500 ms an outcome (i.e., reward or punishment) was shown for 1000 ms. On each trial, the distinct geometric items were presented in different and random positions on the screen, and therefore the groups of three items were changed on a trial-by-trial basis. The task consisted of four experimental blocks and two control blocks. At the beginning of each block a new group of six items was selected and they were used throughout the block.
Figure 1.

Memory and decision-making task. A, Example of the active choice condition (experimental task). B, Example of the forced choice condition (control task). C, Example timeline of the experiment. D, Probability of making a correct choice across all experimental blocks (mean ± SEM). The x-axis represents the trial index relative to the last error trial before learning occurred (highlighted in red) that was defined using an arbitrary criterion (last error trial before participants performed six or more consecutive correct choices). Participants required on average 8.31 trials to reach this criterion (highlighted in green), and during this period performance was at chance. The first six trials after the criterion did not involve any error trial, because the learning criterion was determined based on the performance of six correct trials (highlighted in blue).
In experimental blocks (active choice conditions), a decision was correct if participants selected the group of items containing the geometric item that was set to be rewarded at the beginning of the block. This rewarded item was presented with different items and in different positions on every trial. Participants were required to discover the rewarded item based on the reward/loss feedback at the end of each trial. The reward item switched, without prior warning, 20–25 trials after participants had learnt the correct item–reward contingency. Learning was assumed to have occurred after six consecutive correct choices (see below, next paragraph). If participants failed to learn, the rewarded item was switched after 40 trials. There were three item switches within each block. In experimental blocks, the outcome was probabilistic; correct choices were rewarded with a probability of 0.8 and punished with a probability of 0.2; incorrect choices were always punished. The magnitudes of the outcomes were manipulated in a 2 × 2 design with two levels of reward (high and low, £1 and £0.1, respectively) for correct choices and two levels of punishment (high and low, −£1 and −£0.1, respectively) for incorrect choices. Before acquisition of MEG data, participants were first trained on an experimental block and we restricted scanning to those participants that learned three of the four rewarded items during this training block.
Our approach to defining a learning criterion is based on the observation that in many learning tasks, including the present, the learning process is not cumulative but instead is steplike as if resulting from an “aha” moment in which participants apprehend the correct response (Gallistel et al., 2004). In the present experiment it was not possible to define the learning trial using the quantitative analysis outlined by Gallistel et al. (2004) as participants tended to learn the identity of the rewarded stimulus too quickly, which does not allow for the establishment of a reliable prelearning baseline. This resulted in an arbitrary choice of learning criterion. However, by setting the learning criterion to six consecutive correct trials we were conservative and ensured that participants were performing based on acquired knowledge of the correct stimulus. In fact, the mean accuracy (percent of correct choices) after learning as defined with the current criterion is 98.63 (range 94–100%). In this measure we did not find any main effect of reward (F(1,19) = 1.494; p = 0.236), punishment (F(1,19) = 0.16; p = 0.694) or an interaction (F(1,19) = 0.098; p = 0.758).
In control blocks (forced choice conditions) participants saw the same sequence of stimuli as in the experimental condition, but on every trial an item was randomly selected and circled. In this condition, participants had to choose the group containing the circled item. This condition was analogous to the forced choice trials used in animal experiments where one of the arms of a maze is blocked (Jones and Wilson, 2005; Siapas et al., 2005; Benchenane et al., 2010; Sigurdsson et al., 2010; Fujisawa and Buzsaki, 2011; Kim et al., 2011). The circle was displayed during the whole delay period to avoid differences in working memory load between the experimental and control conditions. At the end of each trial, feedback was given in the form of “correct” or “incorrect” with no monetary reward or loss. Each control block contained 76 trials. The order of experimental and control blocks was pseudo-randomized to ensure that the experiment started with an experimental block and that one control block occurred in the first half and one in the second half of the experimental session. Other than that, the order of the different experimental blocks was randomized across participants.
Behavioral data analysis.
Prelearning and postlearning trials were designated as those preceding and following the last error trial in experimental blocks. The number of prelearning trials, the number of postlearning errors, and the response times on prelearning and postlearning trials were analyzed with a two-way, repeated-measures ANOVA with reward (high/low) and punishment (high/low) as factors.
Eye-tracking data acquisition and analysis.
Eye-tracking data were acquired using a high-resolution eye tracker (EyeLink 2000, SR Research) synchronized with the experimental protocol and MEG recordings. Data were imported into MATLAB (MathWorks), and artifact periods (such as blinks and potential losses of pupil tracking) were eliminated using a semiautomatic rejection tool analogous to the FieldTrip artifact rejection for electrophysiological data (Bauer et al., 2006; Oostenveld et al., 2011). To this end, a histogram of the time series of the pupil size recordings was calculated and any periods exceeding a standardized threshold (z-value) were rejected, for the horizontal and vertical eye position signals, from further analysis. The threshold was chosen by the user interactively, as pupil size and its variation differ greatly between subjects. To identify saccades, the toolbox from Engbert, 2006 was used. The data were first smoothed using the function “smoothdata.m,” then the velocities were computed using “vecvel.m,” and finally saccades were classified using “microsaccades.m” (with an exceedance threshold of σ = 3.5 standard deviations for at least 10 ms). Note that this algorithm does not treat ordinary saccades and microsaccades differently and is suitable for the detection of both, as there is no specific difference in the kinetics of microsaccades and saccades, and the overall distinction is not well defined (van Beers, 2007; Yuval-Greenberg et al., 2008; Dimigen et al., 2009). Furthermore, for each trial and time bin saccades were counted, as was the associated angular displacement (gaze shift) along the horizontal and vertical dimension. These values were then smoothed over time (with a box car function of 50 ms) to allow for efficient averaging of these otherwise highly temporally localized signals. Before averaging the gaze shift values, the absolute values were taken (separately for vertical and horizontal eye movements) to prevent the cancellation of saccades of opposing direction across trials.
MEG data acquisition and preprocessing.
MEG data were recorded in a magnetically shielded room using a 275 channel CTF MEG system (MEG International Services) in third-order gradiometer configuration at a sampling rate of 600 Hz. Analyses were conducted using SPM8 [Statistical Parametric Mapping (SPM); http://www.fil.ion.ucl.ac.uk/spm] as well as using custom-made scripts within MATLAB (MathWorks). The continuous MEG data from each block were high-pass filtered at 0.2 Hz using a fifth-order Butterworth filter, downsampled to 300 Hz, and epoched from −1000 to 3000 ms relative to the start of the decision period of each trial. Error trials were not epoched together with the correct trials and do not contribute to reported differences between experimental and control conditions. Any epochs with field magnitudes of >1e-11 tesla in any channel were discarded as artifactual.
Time frequency analysis.
Time frequency (TF) analysis of MEG oscillatory activity was quantified by continuous Morlet wavelet transformation (factor 5). The wavelet decomposition was applied to each trial, sensor, and subject across the frequency range 1–20 Hz. Epochs were cropped from −200 to 2000 ms relative to the start of the decision period and averaged across the postlearning trials of the same condition. The resulting TF spectrograms were rescaled to a percentage of the power in the baseline, and the control condition was subtracted from each experimental condition. The TF data for the theta range (4–8 Hz) were subsequently converted into NIfTI (Neuroimaging Informatics Technology Initiative) format. This produced a 3D image of channel space × time (averaged across 4–8 Hz). The 2D channel space was created by projecting the sensor locations onto a plane followed by a linear interpolation to a 64 × 64 pixel grid. The time dimension consisted of 660 3.33 ms samples per epoch. Finally, these images were smoothed across time using an isotropic Gaussian kernel [full-width at half-maximum (FWHM)] of 40 voxels. No smoothing was applied on the spatial dimensions. This left four 3D images per participant (one per experimental condition after subtraction of the control condition). For each participant these four different images were entered into a second level random effects 2 × 2 analysis of variance (ANOVA) with the factors reward (high and low) and punishment (high and low). Using this analysis we tested for average effects of condition, that is effects that were significant across all experimental conditions relative to the control condition, as well as the main effects of reward and punishment and their interaction. To correct for multiple comparisons, we used the standard method implemented in SPM comprising a familywise error (FWE) correction using a Gaussian Random Field Theory method (Worsley et al., 1996; Kiebel and Friston, 2004a; Kiebel and Friston, 2004b; Worsley et al., 2004). Therefore, all reported statistical parametric maps were thresholded at p < 0.05 FWE for all space and time voxels within our 3D images.
Source localization.
The linearly constrained minimum variance scalar beamformer spatial filter algorithm (Sekihara et al., 2004a; Sekihara et al., 2004b), implemented in SPM8, was used to generate maps of source activity in a 10 mm grid. Coregistration to the Montreal Neurological Institute (MNI) coordinates was based on three fiducial points: nasion and left and right preauricular points. We used a single-shell (rather than single sphere) model fit, based on spherical harmonic series (Nolte, 2003), to the inner skull surface of the inverse normalized SPM template to more precisely characterize the MEG forward model. The beamformer source reconstruction calculates the weights that map sensors to source locations (constructed based on the data covariance window and the source space lead fields). To obtain a time series estimate at each source location, the raw data are multiplied by these weights. In this case, the time-varying estimate of the electromagnetic activity at each of the locations of the brain image was projected through the spatial filter constructed based on the covariance matrix of all trials in the frequency range of 4–8 Hz. We used a time window ranging from 200 to 2000 ms relative to the onset of the decision period until the end of decision period. This time window was selected based on the results on the sensor space showing enhanced theta power in the experimental conditions when compared to the control in this time epoch.
As the beamformer source reconstruction did not include a baseline period, the source analysis did not involve baseline correction. To rule out any differences in theta power at baseline between the experimental and the control condition, we performed the same beamformer analysis that we used to detect differences in theta power between the experimental and the control conditions on a purely baseline time window (−600–0 ms). We found no increase in theta power during the baseline in the hippocampus or the medial prefrontal cortex, although there were two small but significant clusters in unrelated areas (data not shown).
As a check, we computed the relative lead field magnitudes within the hippocampus and the primary somatosensory cortex as compared to the primary auditory cortex for each subject (Garrido et al., 2012). The sensitivities of the MEG system to voxels within the hippocampus and the primary sensory cortex relative to the auditory cortex were 64.8 ± 2 and 183.4 ± 20%, respectively. This demonstrates that we do not lose much sensitivity in the hippocampus when compared to the auditory cortex, a structure extensively studied with MEG yet already rather far from the sensors (Hillebrand and Barnes, 2002).
We created four normalized whole brain images depicting the difference in theta (4–8 Hz) power between experimental and control conditions. The resulting images were then smoothed using a Gaussian kernel at 10 mm FWHM and subjected to a group random effects analysis using a 2 × 2 ANOVA with reward (high/low) and punishment (high/low) as factors. Using this analysis, we tested for average effects of condition, that is, effects that are significant across all experimental conditions relative to the control condition as well as the main effects of reward and punishment and their interaction. To correct for multiple comparisons, we used the standard method implemented in SPM comprising a FWE correction using a Gaussian Random Field Theory method (Worsley et al., 1996; Kiebel and Friston, 2004a; Kiebel and Friston, 2004b; Worsley et al., 2004). All reported statistical parametric maps were thresholded at p < 0.05 FWE for the whole brain volume.
Synchronization analysis.
To quantify synchronization, we calculated an index of phase consistency between a seed voxel and every other voxel in the brain. For this analysis, the seed voxel was the MTL peak source of theta power compatible with an anterior hippocampus source (identified from the group image in the preceding analysis as showing higher theta power under experimental conditions when compared to control conditions). We used the time series estimate in the frequency range of 4–8 Hz at each source location obtained with the beamformer and used continuous single-trial Hilbert transformation to obtain a phase difference between the seed and all other voxels on each sample within every trial. To remove effects due to volume conduction, we used the phase lag index (PLI) metric to test for phase relationships between voxels (Hillebrand et al., 2012). Briefly, this entails assigning each sample a value of +1 or −1 depending on whether the phase difference to the seed voxel is positive or negative. For each trial, the absolute value of the sum of these integers (which will be zero for a random phase difference) divided by the number of samples gives a measure of PLI. Therefore, this computation yielded a value of phase synchronization ranging from 0 to 1. A value of 1 would correspond to perfect phase consistency across samples and a value of 0 to random phase variation across samples. These trial-by-trial PLI values are then averaged within each condition to give a total of five (one for the control condition and one for each experimental condition) mean PLI values per voxel.
We first performed this analysis on a time window ranging between 200 and 2000 ms, which includes the whole time used for the source localization algorithm. To test which sources in the brain showed a significant synchronization with the MTL peak across the whole time window, we created four normalized images depicting the difference in PLI between each experimental condition and the control condition in this time window. The resulting images were then smoothed using a Gaussian kernel at 10 mm FWHM and subjected to a group random effects analysis using a 2 × 2 ANOVA with reward (high/low) and punishment (high/low) as factors. Using this analysis we tested for average effects of condition, that is, effects that are significant across all experimental relative to the control condition as well as the main effects of reward and punishment and their interaction. To correct for multiple comparisons, we used the standard method implemented in SPM comprising a FWE correction using a Gaussian Random Field Theory method (Worsley et al., 1996; Kiebel and Friston, 2004a; Kiebel and Friston, 2004b; Worsley et al., 2004). All reported statistical parametric maps were thresholded at p < 0.05 FWE for the volume of the whole frontal lobe. The mask of the prefrontal cortex used to this end was generated using MarsBaR (Brett et al., 2002) and included the anterior and middle cingulate gyrus, the inferior, middle, and superior frontal gyrus (including lateral and orbital portions), the rectus gyrus, the supplementary motor area, and the precental gyrus regions of interest available in MarsBaR.
To check for the evolution over time of the synchronization between the identified prefrontal sources and the medial temporal seed, we extracted PLI values of all experimental conditions and the control condition in three consecutive time windows of 600 ms duration that cover the whole period used to identify the synchronized source. The first time window started at 200 ms after the onset of the decision period. Note that there is some tradeoff here between time resolution and sensitivity—the shorter the time window used, the closer to unity will be the PLI values (as there is not sufficient time for the theta phase to change); in contrast, if we consider longer time windows it becomes more difficult to establish when the phase locking occurs. Critically, however, we are only interested in the differences in PLI over conditions. Effects of time were assessed using repeated-measures ANOVA. Post hoc tests were made using one sample t tests on each time window with a Bonferroni correction for three comparisons.
Correlative analysis approach.
To assess whether medial temporal theta or phase synchronization between the MTL and the prefrontal cortex were predictive of the level of performance in our decision-making task, we correlated the total number of incorrect choices in the postlearning period across participants with the following: (1) the mean theta power difference between experimental and control conditions in the MTL; and (2) the mean PLI across experimental conditions in the peak prefrontal voxel resulting from the synchronization analysis.
Results
Performance on the decision-making task
Participants required on average 8.31 trials before they reached a learning criterion in the experimental conditions, and they had an accuracy higher than 94% in the postlearning phase (Fig. 1D). Choices were executed faster in high reward trials as indicated by a main effect of reward on response times (F(1,19) = 4.45, p = 0.049) in the absence of a main effect of punishment or a reward by punishment interaction (see Table 1 for details). Similar to previous reports (Cools et al., 2005; Guitart-Masip et al., 2011), these results show that participants were sensitive to the value of outcome magnitude. However, we did not find any effect of reward or punishment on the number of trials required to reach a learning criterion (main effect of reward: F(1,19) = 0.049, p = 0.827; main effect of punishment: F(1,19) = 1.256, p = 0.276; interaction: F(1,19) = 0.004, p = 0.948; see Table 1 for details) or the number of decision errors after learning (main effect of reward: F(1,19) = 0.065, p = 0.802; main effect of punishment: F(1,19) = 2.545, p = 0.127; interaction: F(1,19) = 0.789, p = 0.385; see Table 1 for details), suggesting that expected outcome value or valence did not impact on task performance.
Table 1.
Behavioral results
| High reward/high punishment | High reward/low punishment | Low reward/high punishment | Low reward/low punishment | |
|---|---|---|---|---|
| Reaction time | 386.2 ± 94.4 | 383.2 ± 94.0 | 399.8 ± 106.0 | 413.6 ± 104.5 |
| Trials to criteria | 8.1 ± 2.8 | 8.7 ± 3.1 | 7.9 ± 2.2 | 8.6 ± 3.1 |
| Choice errors after reaching criterion | 3.1 ± 2.8 | 2.8 ± 2.8 | 3.5 ± 2.3 | 2.2 ± 2.4 |
Increased theta power in the MTL during the decision period
We first checked that our task modulated theta power during the decision period in the postlearning phase, specifically within the 2000 ms time window when participants were presented with the items that preceded a requirement to execute their choices. We performed a TF analysis on MEG sensor space and compared the experimental and the control conditions in theta power (4–8 Hz), across all sensors and time points (see Materials and Methods for details). We found a significant (p < 0.05, FWE) enhancement of theta power over frontomedial sensors (peak at 830 ms; Fig. 2A,C) across all active choice conditions compared to forced choice conditions. Furthermore, our analysis revealed an increase in theta power over centrotemporal sensors (peak at 853 and 563ms; Fig. 2B,D).
Figure 2.

Time frequency analysis. A, B, The topographical maps of the T values (sensor space) and thresholded (p < 0.05; whole brain FWE) T maps in the time domain that result from contrasting active versus forced choice trials show higher induced theta power in the active choice conditions over frontal and centrotemporal sensors. C, D, Group-averaged time frequency activity (pooled from all channels included within the highlighted areas in A and B) for the active choice, the forced choice, and their difference. E, Anatomical localization of the sources of the differences in theta power between active and forced choice conditions detected a medial prefrontal cortex and an anterior hippocampal cluster (p < 0.05, FWE). The color scale indicates T values.
Source analysis revealed that two regions showed increased theta power in the active conditions (see Fig. 2E): one over the medial prefrontal cortex encompassing the anterior cingulate cortex (ACC) (Brodmann areas 25 and 32) [MNI space coordinates (x, y, z) 0, 16, −4; peak Z = 4.67; p < 0.05 FWE; and MNI coordinates 2, 14, 42; peak, Z = 4.14; p < 0.05 FWE], and the other in the MTL, a localization compatible with an anterior hippocampus source [MNI coordinates −22, −2, −26; peak Z = 3.86; p < 0.05 FWE]. We did not find any effect of the level of reward or punishment on the magnitude of theta power at either sensor or source level. As shown in Figure 3, the difference in theta power between experimental and control conditions during the decision period was negatively correlated with the number of decision errors (R2 = 0.421; p = 0.002). This robust correlation supports the notion that the measured electrophysiological phenomena are related to the performance of the cognitive task.
Figure 3.

Theta power in medial temporal lobe correlates with behavioral performance. In the medial temporal lobe source, the difference in theta power between experimental and control condition during the decision period was negatively correlated with the number of decision errors (R2 = 0.421; p = 0.002).
Previous work has shown that selective attention samples multiple stimuli rhythmically, as target detection fluctuates rhythmically in the theta range (Landau and Fries, 2012). Similarly, exploration behaviors, such as saccadic eye movements, also occur in the theta range (Otero-Millan et al., 2008). While beamformer methods are very efficient in suppressing even high amplitude activity from outside the region of interest (Van Veen et al., 1997; Litvak et al., 2010), to rule out confounds in our data whereby the detected differences in cortical or MTL theta power or synchronization were potentially linked to differences in eye movements, we analyzed saccadic and eye position data on the same epochs. Specifically, we calculated the frequency of saccades during the decision period for control and experimental conditions. We also calculated the horizontal or vertical gaze shift introduced by a saccade during the same time window. We found a significantly higher frequency of saccadic activity during the decision period in the control compared to the experimental condition (Fig. 4). When looking at the average absolute horizontal or vertical gaze shift (to avoid cancellation of saccades in opposite directions, the absolute value was taken for each trial) introduced by a saccade, no significant differences between experimental and control conditions were revealed (with a clear but nonsignificant trend for smaller amplitudes in the experimental condition compared to the control condition at the time of peak saccadic activity). These results thus show that the increase in theta power and phase synchrony observed during the decision period in the experimental condition cannot be explained by differences in saccadic eye movements.
Figure 4.

Quantitative eye movement analysis. Probability of a saccade across the decision period is shown. On average, a higher frequency of saccades was observed in the control than in the experimental condition. The line on the top highlights significant differences between control and experimental conditions on a related samples t test (p < 0.05).
Theta phase synchronization between the hippocampus and the prefrontal cortex
We next tested our key hypothesis that a prefrontal source would show theta synchronization with MTL. We first looked for synchronization spanning a time window ranging between 200 and 2000 ms. Importantly, we adopted an unbiased whole brain approach wherein for each voxel in the brain we calculated a phase lag index in relation to a seed voxel, in this case the peak of MTL theta power change (see Materials and Methods for details). PLI is an index of phase synchronization ranging from 0 to 1. A value of 1 corresponds to perfect phase consistency across trials and a value of 0 to random phase variation across trials. PLI is not sensitive to zero lag relationships and therefore to effects due to volume conduction (Hillebrand et al., 2012), a potential problem with MEG. Not considering zero lag is appropriate in this study, because previously reported rodent studies have shown a nonzero lag relationship between hippocampus and prefrontal cortex (Jones and Wilson, 2005; Siapas et al., 2005; Benchenane et al., 2010; Sigurdsson et al., 2010; Kim et al., 2011).
Across the whole brain we found three prefrontal sources that showed increased phase synchronization in the theta range with a peak voxel in the left MTL (compatible with an anterior hippocampus source) in the active choice conditions compared to the forced choice conditions (Fig. 5A–C). These sources of synchronization with the medial temporal seed were located in the right lateral superior frontal gyrus, an area corresponding to Brodmann area 8 (MNI: 18, 18, 66; peak, Z = 4.53; p < 0.05, FWE); the right dorsal ACC, an area corresponding to Brodmann area 32 (MNI: 16, 36, 38; peak, Z = 4.67; p < 0.05, FWE); and the medial frontopolar cortex, an area corresponding to Brodmann area 10 (MNI: 0, 50, −4; peak, Z = 4.04; p < 0.05 FWE; for a volume encompassing the entire frontal lobe. Note that this effect was detected by averaging across all experimental conditions. In none of these sources was it the case that mean PLI correlated with the number of incorrect choices in the postlearning period across participants (p > 0.05).
Figure 5.
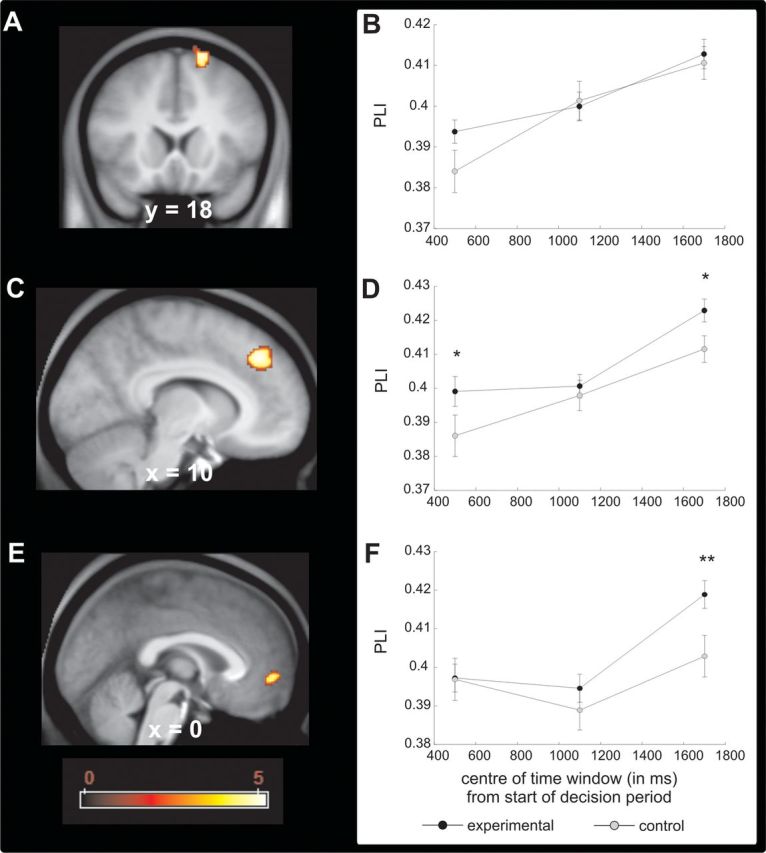
Theta phase synchronization between the hippocampus and the prefrontal cortex during decision making in the postlearning phase. A, Phase locking index, PLI, of the theta rhythm to the medial temporal lobe theta rhythm was higher in the active choice conditions when compared to the forced choice condition in the lateral superior frontal gyrus (p < 0.05, whole brain FWE). PLI was calculated within a time window spanning 200 to 2000 ms after the start of the decision period. B, Time course of PLI for the active and forced choice conditions for the peak voxel identified in A. For this analysis, the original time window was divided into three 600 ms time windows. C, PLI of the theta rhythm to the medial temporal lobe theta rhythm was higher in the active choice conditions when compared to the forced choice condition in the dorsal anterior cingulate cortex (p < 0.05, whole brain FWE). PLI was calculated within a time window spanning 200 to 2000 ms after the start of the decision period. D, Time course of PLI for the active and forced choice conditions for the peak voxel identified in C. For this analysis, the original time window was divided into three 600 ms time windows. E, PLI of the theta rhythm to the medial temporal lobe theta rhythm was higher in the active choice conditions when compared to the forced choice condition in the medial frontopolar cortex (p < 0.05, whole brain FWE). PLI was calculated within a time window spanning 200 to 2000 ms after the start of the decision period. F, Time course of PLI for the active and forced choice conditions for the peak voxel identified in E. For this analysis, the original time window was divided in three 600 ms time windows.
As the main effects of reward and punishment, as well as their interaction, are orthogonal to the average effect of condition, it is possible that there are differences between conditions on the magnitude of synchronization between the MTL and the prefrontal cortex. To test this possibility we performed a 2 × 2 ANOVA with reward and punishment as factors on the PLI difference between experimental and control within the sources showing an average effect of condition. No differences among experimental conditions were detected with this analysis in any of the sources (p > 0.05 for both main effects and interaction). This lack of modulation by reward or punishment illustrates that synchronization was not a function of the magnitude of the expected reward.
To reveal the temporal evolution of synchronization between the identified prefrontal sources and the medial temporal peak, we extracted the average PLI for all experimental conditions and the average PLI for the control condition in three consecutive time windows of 600 ms duration that cover the whole period used to identify the synchronized sources (see Materials and methods for details). A repeated-measures ANOVA with time and experimental condition (experimental versus control) as factors on PLI showed a main effect of time in all three sources (right lateral superior frontal gyrus: F(2,38) = 15.752, p < 0.001; the dorsal ACC: F(2,38) = 16.186, p < 0.001; medial frontopolar cortex: F(2,38) = 7.6, p = 0.002), reflecting an increase in synchronization between the MTL and the three prefrontal sources as the time to emit the decision approached. We also found a significant main effect of experimental condition in the dorsal ACC (F(1,19) = 8.757, p = 0.008) and a trend in the medial frontopolar cortex (F(1,19) = 3.785, p = 0.067) in the absence of any interaction in any of the sources (p > 0.1). Post hoc t test revealed some subtle differences on the time when the experimental conditions differed from the control condition in synchronization between the MTL and these different prefrontal sources (see Fig. 5D–F). Whereas in the dorsal ACC synchronization was stronger in the experimental condition when compared to the control condition on the first and third thirds of the time window, in the medial prefrontal cortex/frontal pole synchronization this difference was only observed on the last time window. Finally, in the superior lateral frontal gyrus we did not detect any significant main effect of condition (p > 0.3) or interaction (p > 0.4). One untested possibility is that in this source synchronization occurs in an intermediate time window overlapping with the first two time windows.
Discussion
Our data show that the power of theta oscillations over frontal and temporal sensors increases while human participants make nonspatial decisions based on memories of past events. Using source reconstruction we found that the ACC in the medial prefrontal cortex and the MTL (a location compatible with the anterior hippocampus) are the likely sources of this increased theta power. These MTL theta oscillations were synchronized with medial frontopolar cortex, the dorsal ACC, and the lateral superior frontal gyrus.
Our decision-making task was inspired by animal experiments that described hippocampal and prefrontal synchronization in decision making (Jones and Wilson, 2005; Siapas et al., 2005; Benchenane et al., 2010; Sigurdsson et al., 2010; Fujisawa and Buzsaki, 2011; Kim et al., 2011). However, studies in humans have the advantage that decision making can be investigated independently of spatial navigation, a key component in these animal studies. Instead, the key requirement in our task, after learning the identity of a rewarding item, was for participants to use this knowledge on every subsequent active choice trial until a reversal occurred. Therefore, on each trial subjects needed to remember which item they had chosen on the preceding trial.
As in our experiment, increased theta power over midline and frontal sensors has been observed previously to precede choice and behavioral adjustments when decision conflict is high (Cavanagh et al., 2011; Cohen and Cavanagh, 2011). Our source analysis highlighted increased decision-related theta power in the anterior cingulate. This source location accords with a wealth of lesion and fMRI studies showing involvement of cingulate cortex in action monitoring and cognitive control (Botvinick, 2007; Shackman et al., 2011).
Increased theta power was also seen in MTL in a location compatible with the anterior hippocampus. Note that despite our strong a priori hypothesis about this source, our analysis was unconstrained in terms of anatomical location. Theta oscillations in the hippocampus during decision making have been reported in tasks with a spatial component (Jones and Wilson, 2005; Siapas et al., 2005; Cornwell et al., 2008; Benchenane et al., 2010; Sigurdsson et al., 2010; Fujisawa and Buzsaki, 2011; Kim et al., 2011; Kaplan et al., 2012). Thus, our data extend these observations by showing MTL theta (compatible with a hippocampal source) in nonspatial, memory-guided decision making. The lack of a spatial component in our task fits with the anterior location of the medial temporal source. Whereas the posterior hippocampus (dorsal and septal in rodents) is more closely related to spatial navigation and contextual memory, the anterior hippocampus (ventral and temporal in rodents) is more closely related to motivational and emotional behavior, including single item (noncontextual) memory (Fanselow and Dong, 2010). In this context it is interesting to highlight the intimate interrelation of the anterior hippocampus with the amygdala, noting that both structures share massive bidirectional connections (Pitkänen et al., 2000) and connections with some prefrontal cortex regions (Thierry et al., 2000; Hoover and Vertes, 2007), and both structures are known to be synchronized at theta frequency (Seidenbecher et al., 2003). Therefore, it is possible that both structures cooperate also in our task.
Our data show synchrony between the MTL and a set of three distributed prefrontal sources in the theta range. Our experimental design allowed us to rule out a number of potential alternative cognitive accounts of this synchronization, including the need for spatial navigation, anticipation of expected value, and differences in eye movements among conditions. Instead, we show that the key component is the need to deploy a memory-guided contextual rule to make the correct choice (the common factor across all active choice conditions). It remains a possibility that this memory involves an emotional element, as all experimental conditions involved rewards and punishments.
Medial temporal lobe–prefrontal theta synchrony is also compatible with the possibility that memory about the decision in the preceding trial is maintained in working memory rather than retrieved. Indeed, previous studies in animals (Siapas et al., 2005) and humans (Cashdollar et al., 2009; Cohen, 2011; Poch et al., 2011) have shown that prefrontal theta and hippocampal theta can be synchronized during working memory maintenance. Furthermore, there is converging evidence from imaging and lesion studies in humans that the hippocampus is recruited (Hannula and Ranganath, 2008) and may even be critical (Hannula et al., 2006; Cashdollar et al., 2009) for working memory. On the other hand, in classical multi-item perceptual short-term memory tasks, theta oscillations are induced in occipital, parietal, and temporal cortices (including the hippocampus), but not in the prefrontal cortex (Rizzuto et al., 2003; Raghavachari et al., 2006). These findings raise the possibility that theta oscillations in the prefrontal cortex are not required for maintenance itself and that the role of the prefrontal cortex is to provide executive control of the task at hand (Miller and Cohen, 2001). To disentangle whether the rule was retrieved on every trial or was maintained in working memory across trials is a question for future research and one that does not affect the main conclusion of the current experiment, namely that medial temporal lobe–prefrontal theta synchrony is associated with memory-guided decision making.
The presence of three prefrontal sources synchronized to MTL theta suggests these brain areas belong to an extensive synchronized network that is recruited during memory-guided decision making. Lesion studies have shown that disconnection of the inferotemporal and prefrontal cortex disrupts certain rule-based decision-making tasks (Gutnikov et al., 1997; Browning and Gaffan, 2008). Interestingly, lesions to dorsal ACC impair performance in a rule-based decision-making in monkeys (Buckley et al., 2009), presumably by disrupting the maintenance of extended sequences of correct choices between abstract rules (Kennerley et al., 2006; Buckley et al., 2009). On the other hand, prior fMRI studies have shown that the frontal pole is implicated in decision-making tasks that require participants to keep track of the value of an unchosen option (Daw et al., 2006; Boorman et al., 2009) or its uncertainty (Yoshida and Ishii, 2006; Badre et al., 2012). These observations are entirely compatible with the idea that this set of brain regions may integrate memory signals into the decision-making process.
A recent study with anesthetized rats showed that dopamine infusion into prefrontal cortex induces prefrontal synchronization with an ongoing hippocampal theta rhythm (Benchenane et al., 2010). Given the well established hypothesis that dopamine cells report reward prediction errors (Schultz et al., 1997), this synchronization could be triggered by reward expectation. Our data indicate synchrony is triggered in a broader context not limited to reward expectation, as the extent of the synchronization was not modulated by the amount of reward or punishment associated with the choices. This is compatible with the possibility that dopamine has a broader role in decision making beyond reward prediction errors extending to signaling punishments (Bromberg-Martin et al., 2010), action requirements (Guitart-Masip et al., 2012), and modulating cognitive flexibility and working memory (Cools, 2008).
Our source localization analysis of MEG data suggests the existence of oscillatory synchrony between the MTL and prefrontal regions in humans while performing memory-based decisions. These results open a new avenue for research into the real-time functional interaction of memory and value processes in human decision making. Up to now the major constraint was the difficulty in simultaneously performing recordings from distant locations, such as MTL and prefrontal cortex. Furthermore, intracranial recordings in humans are limited to individuals with a pathological condition. The ability to detect hippocampal sources using MEG is a feature of an increasing number of empirical (Cornwell et al., 2008; Poch et al., 2011; Quraan et al., 2011; Kaplan et al., 2012) and simulation studies (Stephen et al., 2005). Furthermore the hippocampus can be differentiated from other cortical structures in the MTL (Stephen et al., 2005; Attal et al., 2007). We should note that although we had a strong prior hypothesis for hippocampal involvement, both the source-localization algorithm (Quraan et al., 2011) and subsequent statistics were spatially unbiased, the latter based on a conservative familywise error correction for the whole brain volume. However, we acknowledge potential source reconstruction inaccuracy because of close to radial sources in the MTL or inaccurate source models (Hillebrand and Barnes, 2002; Quraan et al., 2011). Such limitations are not serious because adjacent sources (e.g., perirhinal and entorhinal cortices) are part of the same hippocampal prefrontal circuit (Murray et al., 2007).
Our data highlight that theta synchronization between the MTL/hippocampus and prefrontal cortex is a feature of memory-guided nonspatial decision making. An interesting question for future research is how synchrony and power relate to distinct components of decision making, including memory-guided valuation, choice, maintenance, and execution of choice. Addressing this will rest upon an ability to track choice processing in the brain. This will require new approaches to decode the neural signals of the choice process and cannot be precisely determined on the basis of reaction time alone. Furthermore, this avenue of research can help testing disconnection-based models of cognitive dysfunction in neuropsychiatric disorders (Sigurdsson et al., 2010), including schizophrenia (Friston and Frith, 1995).
Footnotes
This work was supported by Wellcome Trust Senior Investigator Award 078865/Z/12/Z to R.J.D. The Wellcome Trust Centre for Neuroimaging is supported by core funding from Wellcome Trust 091593/Z/10/Z.
The authors declare no competing financial interests.
References
- Attal Y, Bhattacharjee M, Yelnik J, Cottereau B, Lefèvre J, Okada Y, Bardinet E, Chupin M, Baillet S. Modeling and detecting deep brain activity with MEG and EEG. Conf Proc IEEE Eng Med Biol Soc. 2007;2007:4937–4940. doi: 10.1109/IEMBS.2007.4353448. [DOI] [PubMed] [Google Scholar]
- Badre D, Doll BB, Long NM, Frank MJ. Rostrolateral prefrontal cortex and individual differences in uncertainty-driven exploration. Neuron. 2012;73:595–607. doi: 10.1016/j.neuron.2011.12.025. [DOI] [PMC free article] [PubMed] [Google Scholar]
- Bauer M, Oostenveld R, Peeters M, Fries P. Tactile spatial attention enhances gamma-band activity in somatosensory cortex and reduces low-frequency activity in parieto-occipital areas. J Neurosci. 2006;26:490–501. doi: 10.1523/JNEUROSCI.5228-04.2006. [DOI] [PMC free article] [PubMed] [Google Scholar]
- Benchenane K, Peyrache A, Khamassi M, Tierney PL, Gioanni Y, Battaglia FP, Wiener SI. Coherent theta oscillations and reorganization of spike timing in the hippocampal-prefrontal network upon learning. Neuron. 2010;66:921–936. doi: 10.1016/j.neuron.2010.05.013. [DOI] [PubMed] [Google Scholar]
- Boorman ED, Behrens TE, Woolrich MW, Rushworth MF. How green is the grass on the other side? Frontopolar cortex and the evidence in favor of alternative courses of action. Neuron. 2009;62:733–743. doi: 10.1016/j.neuron.2009.05.014. [DOI] [PubMed] [Google Scholar]
- Botvinick MM. Conflict monitoring and decision making: reconciling two perspectives on anterior cingulate function. Cogn Affect Behav Neurosci. 2007;7:356–366. doi: 10.3758/cabn.7.4.356. [DOI] [PubMed] [Google Scholar]
- Brett M, Anton J-L, Valabregue R, Poline J-B. Region of interest analysis using an SPM toolbox. Paper presented at the 8th International Conference on Functional Mapping of the Human Brain; June; Sendai, Japan. 2002. [Google Scholar]
- Bromberg-Martin ES, Matsumoto M, Hikosaka O. Dopamine in motivational control: rewarding, aversive, and alerting. Neuron. 2010;68:815–834. doi: 10.1016/j.neuron.2010.11.022. [DOI] [PMC free article] [PubMed] [Google Scholar]
- Browning PG, Gaffan D. Impairment in object-in-place scene learning after uncinate fascicle section in macaque monkeys. Behav Neurosci. 2008;122:477–482. doi: 10.1037/0735-7044.122.2.477. [DOI] [PubMed] [Google Scholar]
- Buckley MJ, Mansouri FA, Hoda H, Mahboubi M, Browning PG, Kwok SC, Phillips A, Tanaka K. Dissociable components of rule-guided behavior depend on distinct medial and prefrontal regions. Science. 2009;325:52–58. doi: 10.1126/science.1172377. [DOI] [PubMed] [Google Scholar]
- Buzsáki G, Draguhn A. Neuronal oscillations in cortical networks. Science. 2004;304:1926–1929. doi: 10.1126/science.1099745. [DOI] [PubMed] [Google Scholar]
- Cashdollar N, Malecki U, Rugg-Gunn FJ, Duncan JS, Lavie N, Duzel E. Hippocampus-dependent and -independent theta-networks of active maintenance. Proc Natl Acad Sci U S A. 2009;106:20493–20498. doi: 10.1073/pnas.0904823106. [DOI] [PMC free article] [PubMed] [Google Scholar]
- Cavanagh JF, Wiecki TV, Cohen MX, Figueroa CM, Samanta J, Sherman SJ, Frank MJ. Subthalamic nucleus stimulation reverses mediofrontal influence over decision threshold. Nat Neurosci. 2011;14:1462–1467. doi: 10.1038/nn.2925. [DOI] [PMC free article] [PubMed] [Google Scholar]
- Cohen MX. Hippocampal-prefrontal connectivity predicts midfrontal oscillations and long-term memory performance. Curr Biol. 2011;21:1900–1905. doi: 10.1016/j.cub.2011.09.036. [DOI] [PubMed] [Google Scholar]
- Cohen MX, Cavanagh JF. Single-trial regression elucidates the role of prefrontal theta oscillations in response conflict. Front Psychol. 2011;2:30. doi: 10.3389/fpsyg.2011.00030. [DOI] [PMC free article] [PubMed] [Google Scholar]
- Cools R. Role of dopamine in the motivational and cognitive control of behavior. Neuroscientist. 2008;14:381–395. doi: 10.1177/1073858408317009. [DOI] [PubMed] [Google Scholar]
- Cools R, Blackwell A, Clark L, Menzies L, Cox S, Robbins TW. Tryptophan depletion disrupts the motivational guidance of goal-directed behavior as a function of trait impulsivity. Neuropsychopharmacology. 2005;30:1362–1373. doi: 10.1038/sj.npp.1300704. [DOI] [PubMed] [Google Scholar]
- Cornwell BR, Johnson LL, Holroyd T, Carver FW, Grillon C. Human hippocampal and parahippocampal theta during goal-directed spatial navigation predicts performance on a virtual Morris water maze. J Neurosci. 2008;28:5983–5990. doi: 10.1523/JNEUROSCI.5001-07.2008. [DOI] [PMC free article] [PubMed] [Google Scholar]
- Daw ND, O'Doherty JP, Dayan P, Seymour B, Dolan RJ. Cortical substrates for exploratory decisions in humans. Nature. 2006;441:876–879. doi: 10.1038/nature04766. [DOI] [PMC free article] [PubMed] [Google Scholar]
- Dimigen O, Valsecchi M, Sommer W, Kliegl R. Human microsaccade-related visual brain responses. J Neurosci. 2009;29:12321–12331. doi: 10.1523/JNEUROSCI.0911-09.2009. [DOI] [PMC free article] [PubMed] [Google Scholar]
- Eichenbaum H, Yonelinas AP, Ranganath C. The medial temporal lobe and recognition memory. Annu Rev Neurosci. 2007;30:123–152. doi: 10.1146/annurev.neuro.30.051606.094328. [DOI] [PMC free article] [PubMed] [Google Scholar]
- Engbert R. Microsaccades: A microcosm for research on oculomotor control, attention, and visual perception. Prog Brain Res. 2006;154:177–192. doi: 10.1016/S0079-6123(06)54009-9. [DOI] [PubMed] [Google Scholar]
- Fanselow MS, Dong HW. Are the dorsal and ventral hippocampus functionally distinct structures? Neuron. 2010;65:7–19. doi: 10.1016/j.neuron.2009.11.031. [DOI] [PMC free article] [PubMed] [Google Scholar]
- Friston KJ, Frith CD. Schizophrenia: a disconnection syndrome? Clin Neurosci. 1995;3:89–97. [PubMed] [Google Scholar]
- Fujisawa S, Buzsáki G. A 4 Hz oscillation adaptively synchronizes prefrontal, VTA, and hippocampal activities. Neuron. 2011;72:153–165. doi: 10.1016/j.neuron.2011.08.018. [DOI] [PMC free article] [PubMed] [Google Scholar]
- Gallistel CR, Fairhurst S, Balsam P. The learning curve: implications of a quantitative analysis. Proc Natl Acad Sci U S A. 2004;101:13124–13131. doi: 10.1073/pnas.0404965101. [DOI] [PMC free article] [PubMed] [Google Scholar]
- Garrido MI, Barnes GR, Sahani M, Dolan RJ. Functional evidence for a dual route to amygdala. Curr Biol. 2012;22:129–134. doi: 10.1016/j.cub.2011.11.056. [DOI] [PMC free article] [PubMed] [Google Scholar]
- Guitart-Masip M, Beierholm UR, Dolan R, Duzel E, Dayan P. Vigor in the face of fluctuating rates of reward: an experimental examination. J Cogn Neurosci. 2011;23:3933–3938. doi: 10.1162/jocn_a_00090. [DOI] [PubMed] [Google Scholar]
- Guitart-Masip M, Chowdhury R, Sharot T, Dayan P, Duzel E, Dolan R. Action controls dopaminergic enhancement of reward representations. Proc Natl Acad Sci U S A. 2012;109:7511–7516. doi: 10.1073/pnas.1202229109. [DOI] [PMC free article] [PubMed] [Google Scholar]
- Gutnikov SA, Ma YY, Gaffan D. Temporo-frontal disconnection impairs visual-visual paired association learning but not configural learning in Macaca monkeys. Eur J Neurosci. 1997;9:1524–1529. doi: 10.1111/j.1460-9568.1997.tb01507.x. [DOI] [PubMed] [Google Scholar]
- Hannula DE, Ranganath C. Medial temporal lobe activity predicts successful relational memory binding. J Neurosci. 2008;28:116–124. doi: 10.1523/JNEUROSCI.3086-07.2008. [DOI] [PMC free article] [PubMed] [Google Scholar]
- Hannula DE, Tranel D, Cohen NJ. The long and the short of it: relational memory impairments in amnesia, even at short lags. J Neurosci. 2006;26:8352–8359. doi: 10.1523/JNEUROSCI.5222-05.2006. [DOI] [PMC free article] [PubMed] [Google Scholar]
- Hillebrand A, Barnes GR. A quantitative assessment of the sensitivity of whole-head MEG to activity in the adult human cortex. Neuroimage. 2002;16:638–650. doi: 10.1006/nimg.2002.1102. [DOI] [PubMed] [Google Scholar]
- Hillebrand A, Barnes GR, Bosboom JL, Berendse HW, Stam CJ. Frequency-dependent functional connectivity within resting-state networks: an atlas-based MEG beamformer solution. Neuroimage. 2012;59:3909–3921. doi: 10.1016/j.neuroimage.2011.11.005. [DOI] [PMC free article] [PubMed] [Google Scholar]
- Hoover WB, Vertes RP. Anatomical analysis of afferent projections to the medial prefrontal cortex in the rat. Brain Struct Funct. 2007;212:149–179. doi: 10.1007/s00429-007-0150-4. [DOI] [PubMed] [Google Scholar]
- Jones MW, Wilson MA. Theta rhythms coordinate hippocampal-prefrontal interactions in a spatial memory task. PLoS Biol. 2005;3:e402. doi: 10.1371/journal.pbio.0030402. [DOI] [PMC free article] [PubMed] [Google Scholar]
- Kaplan R, Doeller CF, Barnes GR, Litvak V, Düzel E, Bandettini PA, Burgess N. Movement-related theta rhythm in humans: coordinating self-directed hippocampal learning. PLoS Biol. 2012;10:e1001267. doi: 10.1371/journal.pbio.1001267. [DOI] [PMC free article] [PubMed] [Google Scholar]
- Kennerley SW, Walton ME, Behrens TE, Buckley MJ, Rushworth MF. Optimal decision making and the anterior cingulate cortex. Nat Neurosci. 2006;9:940–947. doi: 10.1038/nn1724. [DOI] [PubMed] [Google Scholar]
- Kiebel SJ, Friston KJ. Statistical parametric mapping for event-related potentials: I. Generic considerations. Neuroimage. 2004a;22:492–502. doi: 10.1016/j.neuroimage.2004.02.012. [DOI] [PubMed] [Google Scholar]
- Kiebel SJ, Friston KJ. Statistical parametric mapping for event-related potentials (II): a hierarchical temporal model. Neuroimage. 2004b;22:503–520. doi: 10.1016/j.neuroimage.2004.02.013. [DOI] [PubMed] [Google Scholar]
- Kim J, Delcasso S, Lee I. Neural Correlates of Object-in-Place Learning in Hippocampus and Prefrontal Cortex. J Neurosci. 2011;31:16991–17006. doi: 10.1523/JNEUROSCI.2859-11.2011. [DOI] [PMC free article] [PubMed] [Google Scholar]
- Landau AN, Fries P. Attention samples stimuli rhythmically. Curr Biol. 2012;22:1000–1004. doi: 10.1016/j.cub.2012.03.054. [DOI] [PubMed] [Google Scholar]
- Litvak V, Eusebio A, Jha A, Oostenveld R, Barnes GR, Penny WD, Zrinzo L, Hariz MI, Limousin P, Friston KJ, Brown P. Optimized beamforming for simultaneous MEG and intracranial local field potential recordings in deep brain stimulation patients. Neuroimage. 2010;50:1578–1588. doi: 10.1016/j.neuroimage.2009.12.115. [DOI] [PMC free article] [PubMed] [Google Scholar]
- Miller EK, Cohen JD. An integrative theory of prefrontal cortex function. Annu Rev Neurosci. 2001;24:167–202. doi: 10.1146/annurev.neuro.24.1.167. [DOI] [PubMed] [Google Scholar]
- Murray EA, Bussey TJ, Saksida LM. Visual perception and memory: a new view of medial temporal lobe function in primates and rodents. Annu Rev Neurosci. 2007;30:99–122. doi: 10.1146/annurev.neuro.29.051605.113046. [DOI] [PubMed] [Google Scholar]
- Nolte G. The magnetic lead field theorem in the quasi-static approximation and its use for magnetoencephalography forward calculation in realistic volume conductors. Phys Med Biol. 2003;48:3637–3652. doi: 10.1088/0031-9155/48/22/002. [DOI] [PubMed] [Google Scholar]
- Oostenveld R, Fries P, Maris E, Schoffelen JM. FieldTrip: Open source software for advanced analysis of MEG, EEG, and invasive electrophysiological data. Comput Intell Neurosci. 2011;2011:156869. doi: 10.1155/2011/156869. [DOI] [PMC free article] [PubMed] [Google Scholar]
- Otero-Millan J, Troncoso XG, Macknik SL, Serrano-Pedraza I, Martinez-Conde S. Saccades and microsaccades during visual fixation, exploration, and search: foundations for a common saccadic generator. J Vis. 2008;8(14):21, 21–18. doi: 10.1167/8.14.21. [DOI] [PubMed] [Google Scholar]
- Pitkänen A, Pikkarainen M, Nurminen N, Ylinen A. Reciprocal connections between the amygdala and the hippocampal formation, perirhinal cortex, and postrhinal cortex in rat: a review. Ann N Y Acad Sci. 2000;911:369–391. doi: 10.1111/j.1749-6632.2000.tb06738.x. [DOI] [PubMed] [Google Scholar]
- Poch C, Fuentemilla L, Barnes GR, Düzel E. Hippocampal theta-phase modulation of replay correlates with configural-relational short-term memory performance. J Neurosci. 2011;31:7038–7042. doi: 10.1523/JNEUROSCI.6305-10.2011. [DOI] [PMC free article] [PubMed] [Google Scholar]
- Quraan MA, Moses SN, Hung Y, Mills T, Taylor MJ. Detection and localization of hippocampal activity using beamformers with MEG: a detailed investigation using simulations and empirical data. Hum Brain Mapp. 2011;32:812–827. doi: 10.1002/hbm.21068. [DOI] [PMC free article] [PubMed] [Google Scholar]
- Raghavachari S, Lisman JE, Tully M, Madsen JR, Bromfield EB, Kahana MJ. Theta oscillations in human cortex during a working-memory task: evidence for local generators. J Neurophysiol. 2006;95:1630–1638. doi: 10.1152/jn.00409.2005. [DOI] [PubMed] [Google Scholar]
- Rizzuto DS, Madsen JR, Bromfield EB, Schulze-Bonhage A, Seelig D, Aschenbrenner-Scheibe R, Kahana MJ. Reset of human neocortical oscillations during a working memory task. Proc Natl Acad Sci U S A. 2003;100:7931–7936. doi: 10.1073/pnas.0732061100. [DOI] [PMC free article] [PubMed] [Google Scholar]
- Rushworth MF, Noonan MP, Boorman ED, Walton ME, Behrens TE. Frontal cortex and reward-guided learning and decision-making. Neuron. 2011;70:1054–1069. doi: 10.1016/j.neuron.2011.05.014. [DOI] [PubMed] [Google Scholar]
- Schultz W, Dayan P, Montague PR. A neural substrate of prediction and reward. Science. 1997;275:1593–1599. doi: 10.1126/science.275.5306.1593. [DOI] [PubMed] [Google Scholar]
- Seidenbecher T, Laxmi TR, Stork O, Pape HC. Amygdalar and hippocampal theta rhythm synchronization during fear memory retrieval. Science. 2003;301:846–850. doi: 10.1126/science.1085818. [DOI] [PubMed] [Google Scholar]
- Sekihara K, Nagarajan SS, Poeppel D, Marantz A. Performance of an MEG adaptive-beamformer source reconstruction technique in the presence of additive low-rank interference. IEEE Trans Biomed Eng. 2004a;51:90–99. doi: 10.1109/TBME.2003.820329. [DOI] [PubMed] [Google Scholar]
- Sekihara K, Nagarajan SS, Poeppel D, Marantz A. Asymptotic SNR of scalar and vector minimum-variance beamformers for neuromagnetic source reconstruction. IEEE Trans Biomed Eng. 2004b;51:1726–1734. doi: 10.1109/TBME.2004.827926. [DOI] [PMC free article] [PubMed] [Google Scholar]
- Shackman AJ, Salomons TV, Slagter HA, Fox AS, Winter JJ, Davidson RJ. The integration of negative affect, pain and cognitive control in the cingulate cortex. Nat Rev Neurosci. 2011;12:154–167. doi: 10.1038/nrn2994. [DOI] [PMC free article] [PubMed] [Google Scholar]
- Siapas AG, Lubenov EV, Wilson MA. Prefrontal phase locking to hippocampal theta oscillations. Neuron. 2005;46:141–151. doi: 10.1016/j.neuron.2005.02.028. [DOI] [PubMed] [Google Scholar]
- Sigurdsson T, Stark KL, Karayiorgou M, Gogos JA, Gordon JA. Impaired hippocampal-prefrontal synchrony in a genetic mouse model of schizophrenia. Nature. 2010;464:763–767. doi: 10.1038/nature08855. [DOI] [PMC free article] [PubMed] [Google Scholar]
- Stephen JM, Ranken DM, Aine CJ, Weisend MP, Shih JJ. Differentiability of simulated MEG hippocampal, medial temporal and neocortical temporal epileptic spike activity. J Clin Neurophysiol. 2005;22:388–401. doi: 10.1097/01.WNP.0000172141.26081.78. [DOI] [PubMed] [Google Scholar]
- Thierry AM, Gioanni Y, Dégénétais E, Glowinski J. Hippocampo-prefrontal cortex pathway: anatomical and electrophysiological characteristics. Hippocampus. 2000;10:411–419. doi: 10.1002/1098-1063(2000)10:4<411::AID-HIPO7>3.0.CO;2-A. [DOI] [PubMed] [Google Scholar]
- van Beers RJ. The sources of variability in saccadic eye movements. J Neurosci. 2007;27:8757–8770. doi: 10.1523/JNEUROSCI.2311-07.2007. [DOI] [PMC free article] [PubMed] [Google Scholar]
- Van Veen BD, van Drongelen W, Yuchtman M, Suzuki A. Localization of brain electrical activity via linearly constrained minimum variance spatial filtering. IEEE Trans Biomed Eng. 1997;44:867–880. doi: 10.1109/10.623056. [DOI] [PubMed] [Google Scholar]
- Worsley KJ, Marrett S, Neelin P, Vandal AC, Friston KJ, Evans AC. A unified statistical approach for determining significant signals in images of cerebral activation. Hum Brain Mapp. 1996;4:58–73. doi: 10.1002/(SICI)1097-0193(1996)4:1<58::AID-HBM4>3.0.CO;2-O. [DOI] [PubMed] [Google Scholar]
- Worsley KJ, Taylor JE, Tomaiuolo F, Lerch J. Unified univariate and multivariate random field theory. Neuroimage. 2004;23(Suppl 1):S189–S195. doi: 10.1016/j.neuroimage.2004.07.026. [DOI] [PubMed] [Google Scholar]
- Yoshida W, Ishii S. Resolution of uncertainty in prefrontal cortex. Neuron. 2006;50:781–789. doi: 10.1016/j.neuron.2006.05.006. [DOI] [PubMed] [Google Scholar]
- Yuval-Greenberg S, Tomer O, Keren AS, Nelken I, Deouell LY. Transient induced gamma-band response in EEG as a manifestation of miniature saccades. Neuron. 2008;58:429–441. doi: 10.1016/j.neuron.2008.03.027. [DOI] [PubMed] [Google Scholar]