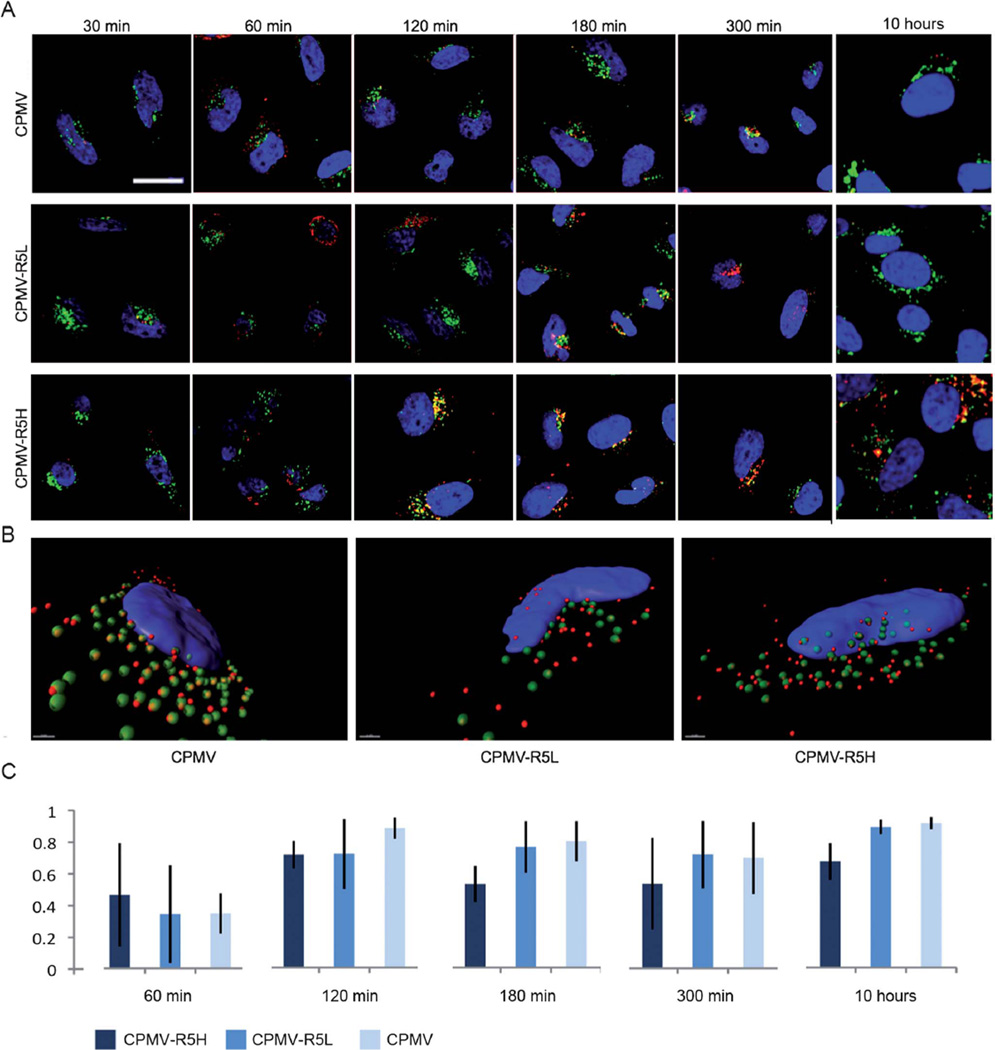
Fig. 5.
Subcellular fate of CPMV formulations in HeLa cells studied by confocal microscopy. CPMV formulations (red), endolysosomes are labeled with Lamp-1 (green), and nuclei are labeled with DAPI (blue). The overlay of endolysosomes and VNP signals is shown in yellow. (A) Time course and translocation of CPMV formulation over 10 hours. Scale bar = 10 µm. Images were analyzed using ImageJ. (B) Three-dimensional reconstruction of z-sectional data at time point 120 min. Images were recorded at a step size of 0.3 µm. Data were reconstructed using Imaris software. Scale bar = 1 µm. (C) Colocalization analysis of eight representative cells for each CPMV formulation showing the percentage of total internalized CPMV particles colocalizing with the endolyosomes, error bars represent the averages values of standard deviations of all analyzed cells. Co-localization analysis was performed using LSM Examiner software.

