Abstract
This experiment measured the capability of hearing-impaired individuals to discriminate differences in the cues to the distance of spoken sentences. The stimuli were generated synthetically, using a room-image procedure to calculate the direct sound and first 74 reflections for a source placed in a 7 × 9 m room, and then presenting each of those sounds individually through a circular array of 24 loudspeakers. Seventy-seven listeners participated, aged 22-83 years and with hearing levels from −5 to 59 dB HL. In conditions where a substantial change in overall level due to the inverse-square law was available as a cue, the elderly-hearing-impaired listeners did not perform any different from control groups. In other conditions where that cue was unavailable (so leaving the direct-to-reverberant relationship as a cue), either because the reverberant field dominated the direct sound or because the overall level had been artificially equalized, hearing-impaired listeners performed worse than controls. There were significant correlations with listeners’ self-reported distance capabilities as measured by the “SSQ” questionnaire [S. Gatehouse and W. Noble, Int. J. Audiol. 43, 85-99 (2004)]. The results demonstrate that hearing-impaired listeners show deficits in the ability to use some of the cues which signal auditory distance.
I. INTRODUCTION
A recent self-report study has shown that hearing-impaired listeners report deficits in their capability to perceive the distance or motion of sound sources, and that those reports are related to the hearing handicap experienced by the listeners (Gatehouse and Noble, 2004). The questionnaire used, the “Speech, Spatial, and Qualities of Hearing” test (SSQ), enquired about many real-world aspects of listening, of which distance-perception was one. Two of the questions (see Appendix 1) were concerned with distance directly (e.g. “Do the sounds of people or things that you hear, but cannot see at first, turn out to be closer than expected?”), four others with the distance of dynamic sounds (e.g. “Can you tell from the sound whether a bus or truck is coming towards you?”), and one question with location in general (“Do you have the impression of sounds being exactly where you would expect them to be?”). Gatehouse and Noble (2004) calculated the partial correlation between the scores on these SSQ questions and an independent measure of hearing handicap, controlling for better-ear and worse-ear averages, across a sample of 153 un-aided patients (mean age 71 years, mean better-ear-average 39 dB). They found that the four dynamic-distance questions correlated with hearing handicap (r = 0.3 to 0.5), as did the “further-than-expected” question (r = 0.26). As similar amounts of correlation were found for the other items that are traditionally associated with auditory deficit,1 it was clear that both distance and motion have prominent associations with hearing handicap.
The primary objectives of the present study were to test if such deficits in distance perception could be demonstrated experimentally, and to inquire if the experimental measures corresponded to the self-report data. Accordingly, we felt it was important for the experiment to use ecologically valid stimuli in a context that was commonly-experienced by hearing-impaired listeners. Voices form one of the distance topics directly asked in the SSQ, and so the experiment measured the discrimination of the distance of static, spoken sentences in a room; both of the other two topics — footsteps and traffic — are primarily dynamic situations, whose reproduction in the laboratory would have needed quite-complex signal processing.
The cues to distance perception were reviewed by Coleman (1963), Blauert (1997, and Zahorik et al. (2005). One cue is the intensity or overall level of a sound; in an anechoic room, it reduces at a rate of 6 dB per doubling of distance by the inverse-square law, while in any non-anechoic room the rate is somewhat less; for instance, it was about 4 dB in both Simpson and Stanton’s (1973) 3.5 × 3.8 m room and for Zahorik’s (2002a) 12-m × 14-m auditorium. A second cue is based on a distinction between the first sound to arrive and all the subsequent sounds. The first sound is the “direct” sound, and it is independent of the properties of the room; its level always changes at a rate of 6 dB per doubling of distance. The subsequent sounds are all reflections from the surfaces of the room and any objects within it. As their total level is dependent much less upon distance (in the small auditorium used by Zahorik, 2002a, it decreased at 1 dB per doubling of distance), the relationship between the direct sound and the reverberation is a second cue to distance.2 This relationship is often measured by the ratio of the level of the direct sound to the total level of the reverberant sounds: this “direct-to-reverberant ratio” is larger for a closer source than a further source (the exact values depend upon both the room and the distance, but, as an example, Zahorik’s values for his small auditorium were approximately +12 dB at 1 m and 0 dB at 10 m). Both of these two cues were contrasted in our experiment, as we expected them to be characteristic of the range of distances commonly encountered by hearing-impaired people in domestic or public rooms. Two other distance cues were excluded, as they would only be informative for much larger or much smaller distances: the effect on the spectrum due to the differential absorption of the air across frequency, which only becomes substantial above 15 m or more (Blauert, 1997), and the effect on the sound’s ITD and ILD of the listener being close to the source, which is only important for distances closer than about 1 m (Brungart et al., 1999).
As the environments inquired about in the SSQ questionnaire are quite general and often complex, we developed a synthetic method that had the potential for recreating in the laboratory the acoustics of many different environments. Our system — termed the “room-image/circular-loudspeaker-array” system (“RI-CLA”) — used a computational method to calculate the acoustics of a medium-sized, virtual room and combined that with a circular array of loudspeakers placed in a smaller, laboratory room. For computational simplicity the virtual room was set to be rectangular, with dimensions of 7-m wide by 9-m long by 2.5-m high (volume = 158 m3). It was chosen to be representative of a normal room that might be commonly encountered by a listener; its size was also close to that of the 7.6 m × 8.75 m real classroom used by Nielsen (1993). Each wall of the virtual room was given an absorption value of 0.5 (i.e., 3 dB loss per reflection), but the floor and ceiling were made perfect absorbers as there were no loudspeakers above or below the listener in our array. The overall reverberation time of the virtual room was about 250 ms (Sabine, 1964).
This method contrasts with the more obvious one of using loudspeakers placed at different distances in a real environment, such as an anechoic room (e.g., Nielsen, 1993), a non-anechoic room (e.g., Nielsen, 1993), or outdoors on an open field (e.g., Ashmead et al., 1995). Such environments, however, offer limited flexibility or generality, whereas synthetic environments avoid these problems, and can be created using loudspeakers or headphones. Three studies have investigated distance synthetically using headphone presentation allied to the techniques of “virtual auditory space” (e.g., Wightman and Kistler, 1993, 2005): Zahorik (2002a) recorded the acoustics of a small auditorium using binaural in-ear microphones and then presented those over headphones, while Bronkhorst and Houtgast (1999) and Bronkhorst (2000) used a computational model to calculate the acoustic environment of a room, which they then convolved with a set of head-related-transfer functions (“HRTFs”). We deliberately chose loudspeakers for the final presentation so that we could compare the present data with future experiments on the benefits or drawbacks of aided listening, as placing headphones over hearing-aids would have severely compromised the frequency characteristics and the directivity patterns of the aids.
We used an implementation of the “room-image” procedure (e.g., Allen and Berkeley, 1979; Peterson, 1986; Kompis and Dillier, 1993) to calculate the acoustic characteristics of the room. This procedure was used by Bronkhorst and Houtgast (1999; Bronkhorst, 2000) in their studies of distance perception, as well as in non-distance studies that required the acoustic environment of a room (e.g., Culling et al., 2003; Zurek et al., 2004). It calculates a list of all the sounds that reach a single point in space — the virtual “listener” — each labeled with an arrival direction, time, and level. We then presented each one of these sounds, individually, from the loudspeaker whose azimuth was closest to the arrival direction, at the arrival level, and after waiting for its arrival time. The result is a recreation at the center of the loudspeaker array of the acoustics experienced by the virtual listener in the virtual room.3
II. METHOD
A. Design
Psychometric functions were measured for the distance discrimination of spoken sentences in a virtual room. A two-interval forced-choice procedure was used to measure the psychometric functions. In one interval, a sentence was simulated to be at a reference distance, while in the other interval, a different sentence was simulated to be at some comparison distance. One of the sentences was spoken by a man, the other by a woman. The task was to decide which of the two sentences was furthest. The two reference distances that were chosen — 2 m and 5 m — represented typical real-life situations. The comparison distances were either closer-than or further-than the reference. This design gave psychometric functions for four tasks: closer-than 2 m (“2-Closer”), further-than 2 m (“2-Further”), closer-than 5 m (“5-Closer”), and further-than 5 m (“5-Further”).
Each of the four psychometric functions was measured for two conditions of the overall level of the stimuli. In one set (“Normal-level”), the levels of the sound were those calculated by the room-image procedure. For these, both the overall level and the relationship between the direct and the reverberant sounds (here characterized by the direct-to-reverberant ratio) were available to determine which of the two sentences was further away. In the second set of conditions (“Equalized-level”), the overall level of the comparison interval was equalized to that of the reference, and so the direct-to-reverberant relationship was the primary cue to the relative distance of the two sentences.
B. Apparatus
The stimuli were presented using a circular array of 24 loudspeakers that we had developed for other applications. It was installed in a small room, 2.5 m wide by 4.4 m long by 2.5 m tall. The room was acoustically treated to reduce its reverberation time, although it was not anechoic. The walls and inside surfaces of the two doors were faced with a 25-mm thick layer of sound-absorbing foam (“Melatech”) decorated by a thin, light fabric. The ceiling was a suspended network of acoustic tiles, and the floor was carpeted. The reverberation time (T60) of the room was found by measuring the decay of impulsive sounds using Schroeder’s (1979) method; it was 120 ms, 100 ms, 90 ms, 70 ms, 60 ms and 60 ms, for the octave bands at 250, 500, 1000, 2000, 4000, and 8000 Hz, respectively. The A-weighted levels in the octave bands from 125 to 8000 Hz were, respectively, about 27, 28, 27, 22, 16, 19, and 13 dB, giving an overall A-weighted level of approximately 35 dB SPL.
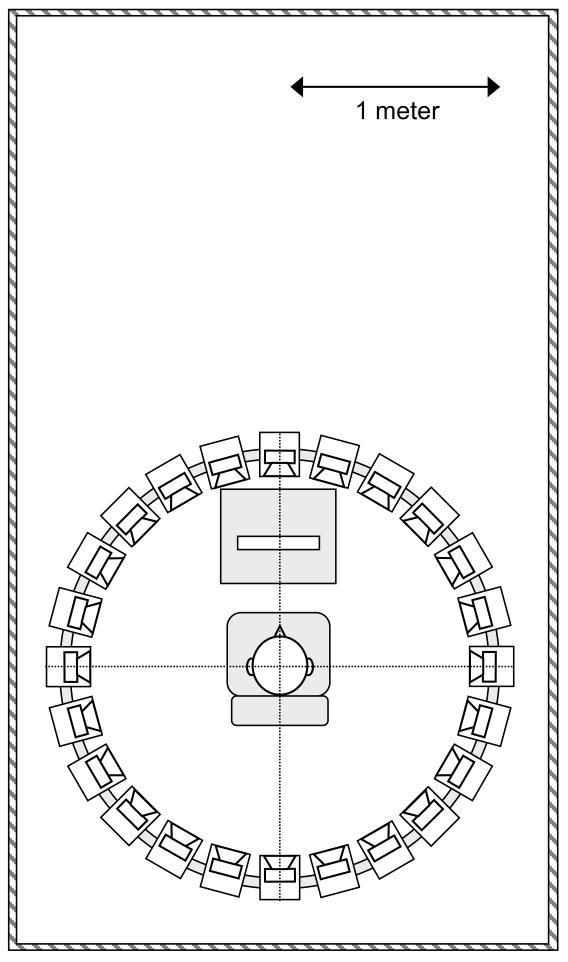
The loudspeaker array was placed near one end of the experimental room (see Fig. 1). Each loudspeaker was a Phonic Sep-207, consisting of a 6.25″-bass driver, a 1″-tweeter, and an amplifier inside an 11.5″ × 7.8″ × 9.3″ cabinet. Their nominal −3 dB frequency response was 70-20000 Hz. The loudspeakers were attached to a custom-made aluminum frame, such that the loudspeakers formed a horizontal circle 1.2 m off the floor and of 0.9-m radius (both measured to the center point of the front of the loudspeaker cabinets). The loudspeakers were placed at azimuths of 0° (straight ahead), 15°, 30°, … 330°, 345°. The front of the loudspeaker cabinets were covered in another layer of sound-absorbing foam, with holes cut out for the drivers, which was done in order to minimize reflections from the cabinet faces. The listener sat in the center of the array, facing the 0° loudspeaker. A small, low table was placed in front of the listener, on which sat a touch screen for collecting responses.4
FIGURE 1.
Plan of the experimental room, showing the array of speakers, the response box, the chair, and a listener.
The loudspeaker feeds were derived from a PC computer, equipped with a 24-channel digital audio interface (Mark of the Unicorn MOTU 2408), whose output was fed into three 8-channel digital-to-analog converters (Fostex VC-8), monitored via three 8-channel VU meters (Behringer Ultralink Pro), and then passed through three computer-controlled gates (custom-programmed DSP chips) before being sent to the loudspeakers. The presentation of each sound was controlled by a custom-written software package.
C. Stimuli
The stimuli were spoken sentences from the 336-sentence “BKB” (Bench and Bamford, 1979) and 270-sentence “ASL” corpora (Macleod and Summerfield, 1987). The BKB sentences were spoken by a female, the ASL by a male; both were native British-English speakers. Both sets of sentences had a simple syntactical structure (e.g., “The leaves dropped from the trees”), with an average length of 1.5 seconds. The average levels of the sentences varied naturally, with a standard deviation of 1.2 dB (ASL sentences) or 1.5 dB (BKB sentences).
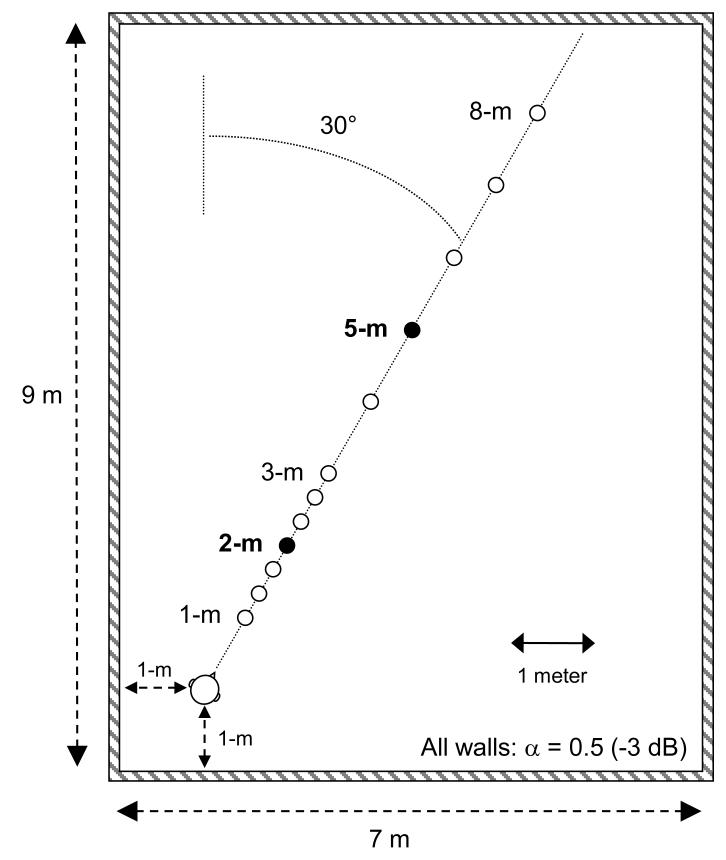
The virtual room was set to be 7 m wide by 9 m long by 2.5 m high (Fig. 2). The virtual receiver, representing the listener, was set to be 1-m in from one corner, at a height of 1 m, while the virtual sources were set to be at distances of 1-m to 8-m from the listener (at steps of either 1/3 m or 1 m), at an angle of 30° relative to the long wall, and again at a height of 1 m. The virtual receiver faced the line of sources: from its perspective, it was looking diagonally across the virtual room, and all the virtual sources were directly ahead of it. This was done to ensure that there was some left/right asymmetry in the sounds. Each of the walls of the virtual room had an absorption value of 0.5, corresponding to a 3-dB loss per reflection. Because our loudspeaker array was installed in the horizontal plane, we set the absorption value of the floor and ceiling to be 1.0 (i.e., an infinite loss), so that all echoes coming from non-horizontal directions were removed. The Sabine equation gave a reverberation time for the virtual room of 250 ms (Sabine, 1964).
FIGURE 2.
Plan of the virtual room, showing the position of each of the virtual sources and the listener’s head.
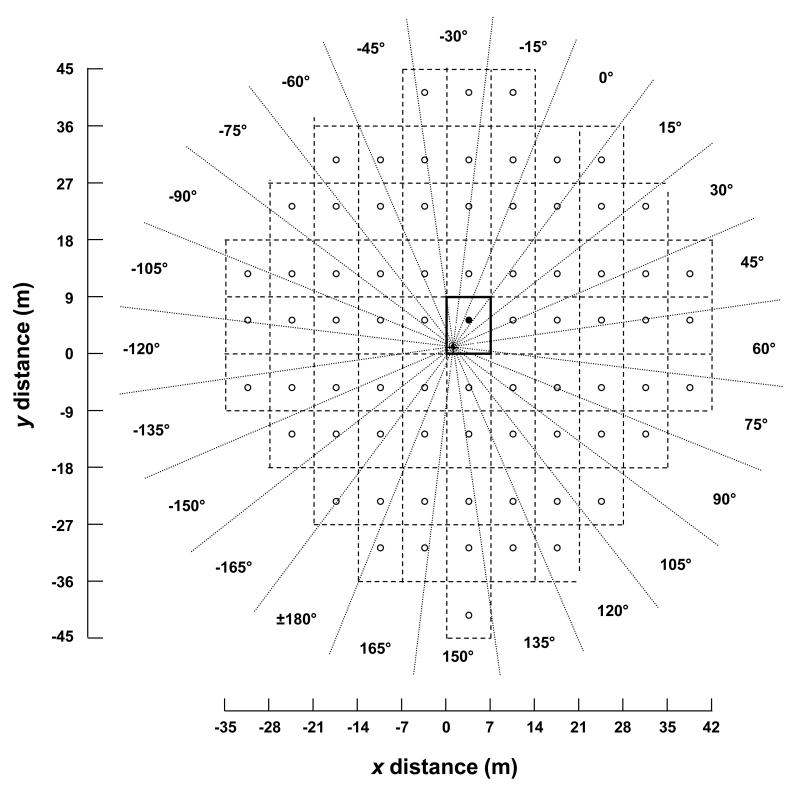
An implementation of Allen and Berkeley’s (1979) room-image procedure was used to calculate the direct and the first 74 reflected sounds in the virtual room; we felt that 75 sounds was a suitable compromise between the complexity of the presentation —- mainly limited by the speed of the array-control computer — and the accuracy of the simulation (c.f. Bronkhorst and Houtgast, 1999). Figure 3 illustrates the calculations for a virtual distance of 5 m. The solid rectangle shows the original, virtual room, with the cross marking the location of the receiver and the filled circle marking the location of the virtual source. Each of the dashed rectangles represents one of the room-images, in which an open circle represents its image source. A straight line drawn from any image-source to the receiver represents the path of a sound: the length corresponds to the distance traveled — which determines both the inverse-square law reduction in level and the travel time — the angle the arrival angle, and the number of dashed or solid lines crossed the number of times the sound has reflected at a wall. The angle of each sound was then quantized into 15° sectors, and the sound presented though that sector’s loudspeaker at the required time and at a level determined by the sum of the inverse-square law and the number of wall reflections.5
FIGURE 3.
Schematic illustration of the image method for calculating the echoes. The original virtual room is shown by the solid rectangle together with the receiver (cross) and source (filled circle). Each of the image rooms are shown by the dashed rectangles, with the image source in each shown by the open circles. The angles are quantized to 15°-intervals (dashed lines) for presentation over the array. The x- and y-axes mark the scale, in meters.
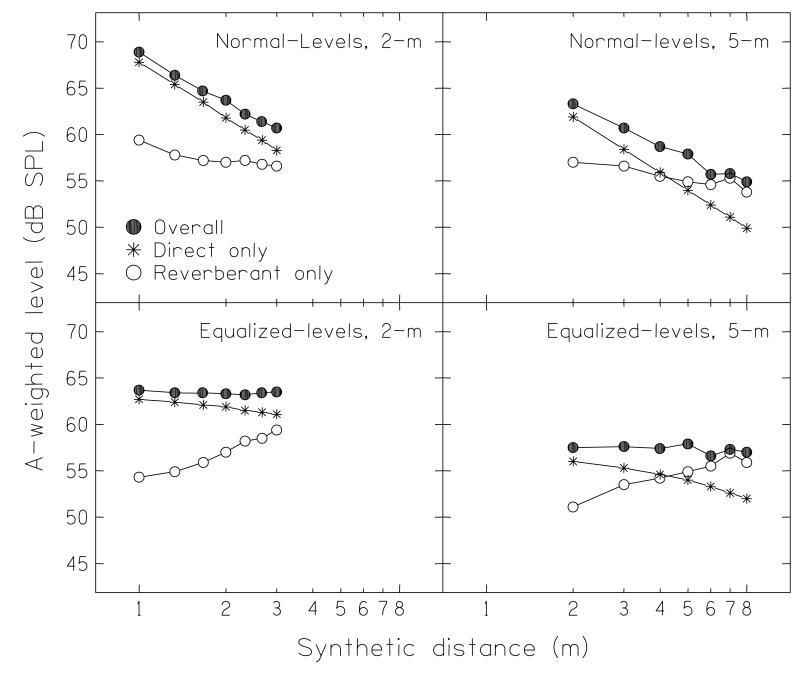
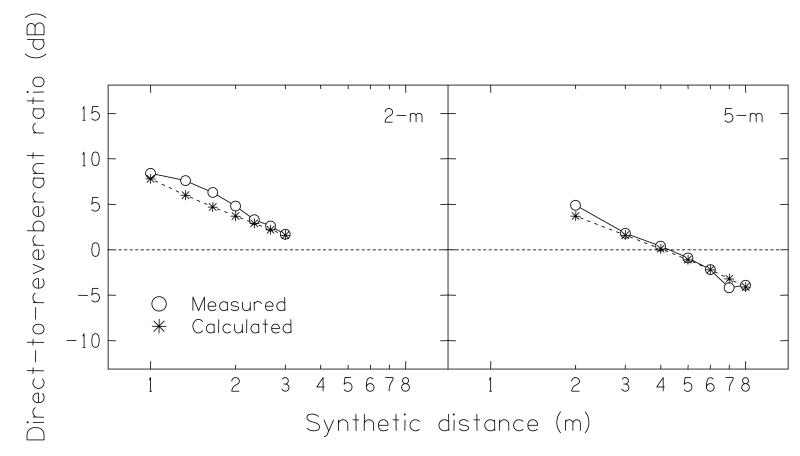
The sound levels generated were measured in situ by placing a microphone at the center of the loudspeaker array. The top panels of Fig. 4 shows the overall level of the signals for each of the Normal-level conditions (filled circles), as well as the level of the direct sound alone (asterisks) and the level of all the reverberant sound (i.e., everything but the direct sound; open circles). The level of the direct sound showed the expected inverse-square dependence on distance. The reverberant sounds showed much less of a dependence on distance. The two were approximately equal at a distance of 4 m; for distances less than this, the overall level was dominated by the direct sound, while for distances greater, it was dominated by the reverberant sound. The bottom panels of Fig. 4 show the corresponding plots for the Equalized-level conditions. For these, the overall level from each distance was corrected so that the sounds at the comparison distances were at the same overall level as those at the two reference distances. These correction factors were calculated directly from the results of the room-image simulation, and acoustic measurements (filled circles) showed the equalization had matched the levels to within 1 dB. This equalization meant that the change in level of the direct sound with distance was necessarily much reduced (i.e., there was no longer an inverse-square dependence for the asterisks), while the level of the reverberant sounds now increased with distance (open circles). Figure 5 shows the direct-to-reverberant ratio for each of the distances. The open circles are derived from the acoustical measurements, while the asterisks are the computational values. This ratio depended upon the distance of the source, being almost +8 dB at a distance of 1 m but about −4 dB at a distance of 8 m. For three of the four conditions (2-Closer, 2-Further, 5-Closer), the direct-to-reverberant ratio was positive, while for one (5-Further), it was negative. The dependence of direct-to-reverberant ratio with log distance was well fitted by a straight line, which gave a rate of change of about −4 dB per doubling in distance.
FIGURE 4.
The measured levels produced at the center of the array, for each of the virtual sources, as a function of the virtual distances. The asterisks mark the level of the direct sound, the open circles the level of all the other (reverberant) sounds, and the filled circles the combined level. The four panels are for the reference distance (2 or 5 m) crossed by the condition (normal- or equalized-level).
FIGURE 5.
The direct-to-reverberant ratios for each of the virtual sources. The circles are derived from the measured levels reported in Fig. 4; the asterisks are computed directly from the results of the image-source method. The dashed line marks a direct-to-reverberant ratio of 0 dB.
D. Procedures
The experiment was conducted across two visits, each of about 2 hours. At the beginning of the first visit, each listener participated in a short demonstration so they became used to the loudspeaker array and the distance simulation. The listener was told to imagine that he/she was sitting in a large classroom, and a sequence of five sentences was then presented, with the virtual distance of the sentence either approaching or receding as the sequence progressed. The listener was asked if he/she felt the talker move, and, if so, whether the talker approached towards or receded away from him/herself. These sequences ranged between virtual distances of 1 and 8 m. Next, single sentences were presented, and each listener was asked how far away the talker was, if the talker was in front or behind, and what the sentence was.
A progressive training scheme was then used to train the listener in the experimental procedure. A two-interval, forced-choice method was used, in which two sentences were presented, one simulated to be at the reference distance, the other simulated to be at the comparison distance. One sentence was chosen at random, without replacement, from the ASL set (and so spoken by a male), the other was similarly chosen from the BKB set (spoken by a female). The listener task was to decide if the female was further than the male or vice-versa. No feedback was given. The target interval and sex were counterbalanced across trials. In the training phase, the listener first undertook 16 trials of the 2-m reference, Normal-Level conditions, followed by 32 trials of the 5-m reference, Equalized-Level conditions, and then 64 trials of the 2-m reference, Equalized-Level conditions.
In the remainder of the first session the listener completed an experimental block for the 2-m reference distance followed by an experimental block for the 5-m distance. Each block lasted about 20 minutes and consisted of 168 trials (one reference distance times seven comparison distances times Equalized-Level or Normal-Level, presented 12 times each and in a random order). In the second session, the listener completed two more of each of the experimental blocks. The results were based on the results from all the experimental blocks, and so there were 36 trials for each point on each psychometric function.
E. Listeners
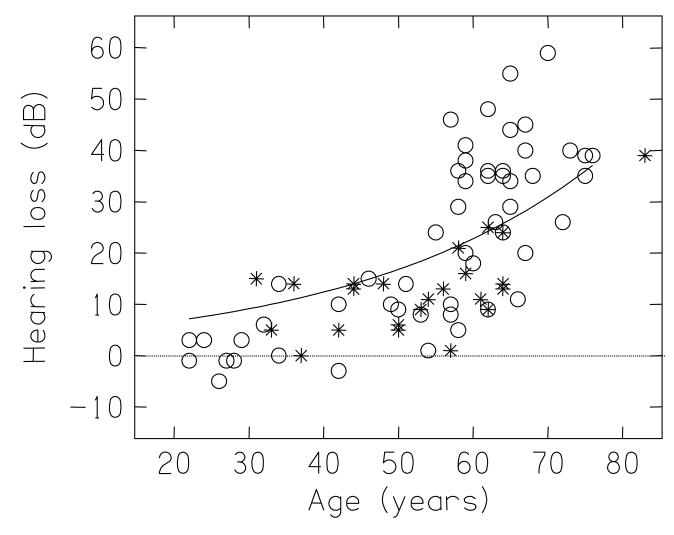
The listeners were patients and volunteers from the local population as well as members of staff. Seventy-eight listeners took part; one listener was removed as his best discrimination score was just 64%; in contrast, the best discrimination scores of the other 77 listeners were 86% or better. They were aged between 22 and 83 years (mean 54 years; standard deviation 14 years). Their hearing levels (defined as the average of the audiogram values at 500, 1000, 2000, and 4000 Hz, in their better ears) ranged from −5 to 59 dB HL (mean = 20 dB; standard deviation = 16 dB). Figure 6 shows a plot of their hearing loss against age. The open circles mark those listeners who had completed a SSQ questionnaire (see below); the asterisks those who did not. As the distribution was similar to the UK National Study of Hearing (Davies, 1995), which is shown by the solid line, the sample of listeners was a fair representation of the UK population.
FIGURE 6.
The mean hearing loss in their better ear of the 77 listeners who took part in the experiment, plotted as a function of their age. The values are the average of 500, 1000, 2000, and 4000 Hz. The open circles are those listeners who completed a SSQ questionnaire; the asterisks are those who did not. The solid line plots the mean hearing loss from of the UK National Study of Hearing (Davies, 1995).
For some of the analyses we divided the listeners into three equal-sized groups, according to age and hearing loss (see Table 1). We defined an older hearing-impaired group, an older normal-hearing control group, and a younger, normal-hearing control group. The two older-adult groups were matched for age; it was not possible to match the hearing-levels of the two normal-hearing groups. Fifteen of the 19 individuals in the older, hearing-impaired group had sensorineural losses (defined by air-bone gaps ≤ 10 dB), the other four had mixed losses.
TABLE 1.
The age and hearing-loss classifications used to define the three groups.
| Group | Age, years | Hearing loss, dB | |||
|---|---|---|---|---|---|
| N | Conditional | Mean | Conditional | Mean | |
| Younger, normal-hearing | 19 | < 45 | 33 | <= 25 | 5 |
| Older, normal-hearing | 19 | 56-69 | 61 | <= 25 | 14 |
| Older, hearing-impaired | 19 | 56-69 | 63 | > 25 | 38 |
Two-thirds (53/77) of the listeners also completed the SSQ questionnaire (Gatehouse and Noble, 2004; Noble and Gatehouse, 2004). They formed a representative selection of our population, although there was an under-sampling of people aged between about 30 and 60 (Fig. 6). As our focus was the distance questions of the SSQ, we generated three summary measures of the SSQ responses (see Appendix): “expected-distance” (items #15 and #16); “expected location” (#17), and “dynamic-distance” (#8, #9, #12, #13). Each response to a question was marked from 0 to 10, with 0 representing complete inability or absence of a quality, and 10 representing complete ability or presence of a quality.
III. RESULTS
A. Group results
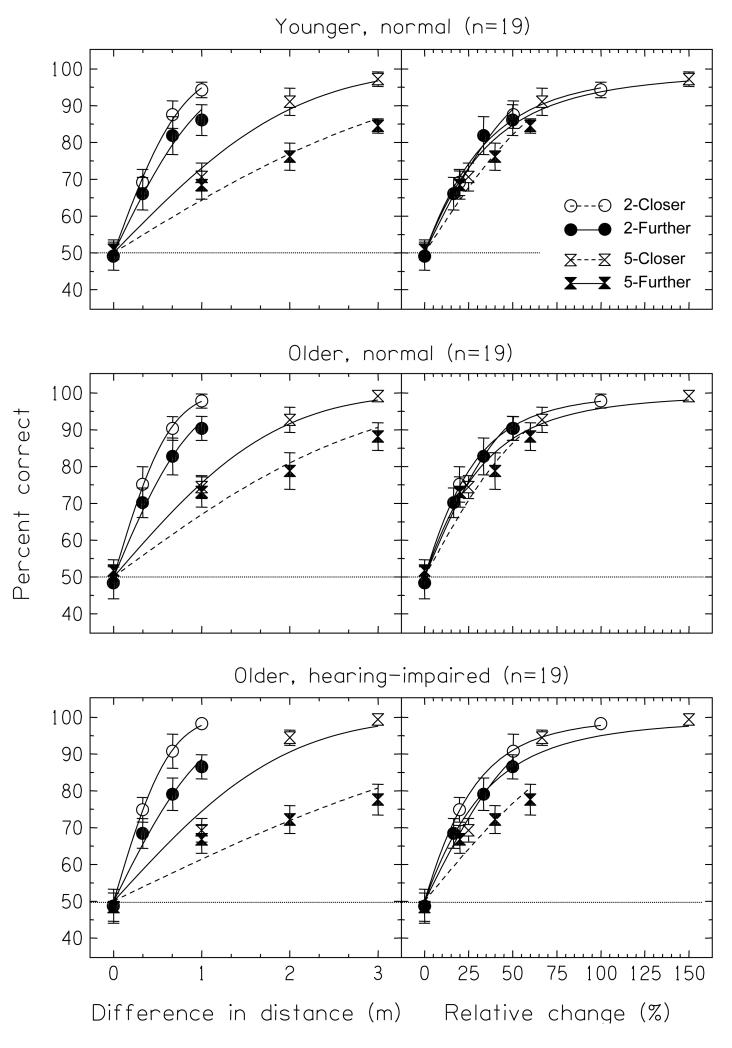
The average psychometric functions for the three groups of listeners in the Normal-level conditions are shown in the panels of Fig. 7. Within each panel, the four tasks of 2-Closer, 2-Further, 5-Closer, and 5-Further are marked by open circles, filled circles, open hourglasses, and filled hourglasses, respectively. The error bars mark the ±95%-confidence intervals for each point of the psychometric functions; a score of 50% corresponds to chance. The left column plots the data as a function of the difference in distance between the two intervals of each trial, Δr; the right column plots the same data as a function of the percentage change from the closest of the two distances, Δr/rmin. The lines show psychometric functions fitted to the group data, and assume that d′ was proportional to Δr; the 5-Further psychometric functions are shown by dashed lines to differentiate them from the others.
FIGURE 7.
Average psychometric functions for the Normal-level conditions from each of the three groups of listeners (young normal, older normal, and older hearing-impaired). The four functions in each panel are for the four tasks of “2-Closer”, “2-Further”, “5-Closer”, and “5-Further”. In the left column the data is plotted as a function of the difference in distance between the two trials, Δr; in the right column the same data is plotted as a function of the percentage change in distance, Δr/rmin. The lines show psychometric functions fitted to the group data, assuming that was proportional to Δr; the 5-Further psychometric functions are shown by dashed lines to differentiate them from the others. Chance performance is 50%.
In the left-hand panels it can be seen that there was a clear advantage for the 2-Closer task over the 2-Further task and for the 5-Closer task over the 5-Further task, and also that both the 2-m tasks were easier than either of the 5-m tasks. That is, the listeners found distance discrimination to be easier for a closer target than for a further target when expressed as Δr; for example, 1 vs 2 m was easier than 2 vs 3 m, and both were easier than 4 vs 5 m or 5 vs 6 m. These results reflect the well-known result that discrimination thresholds for distance are generally larger for further source distances (see review by Zahorik et al., 2005). The right-hand panels show that the data are almost invariant across task when plotted as a function Δr/rmin; discrimination threshold (taken as 75% correct) corresponded to a Δr/rmin of about 25%. The exception was the 5-Further task, which generally gave lower performance than the other tasks. This was especially so for the older-impaired group (bottom-right panel); here discrimination threshold corresponded to a Δr/rmin of approximately 50%.
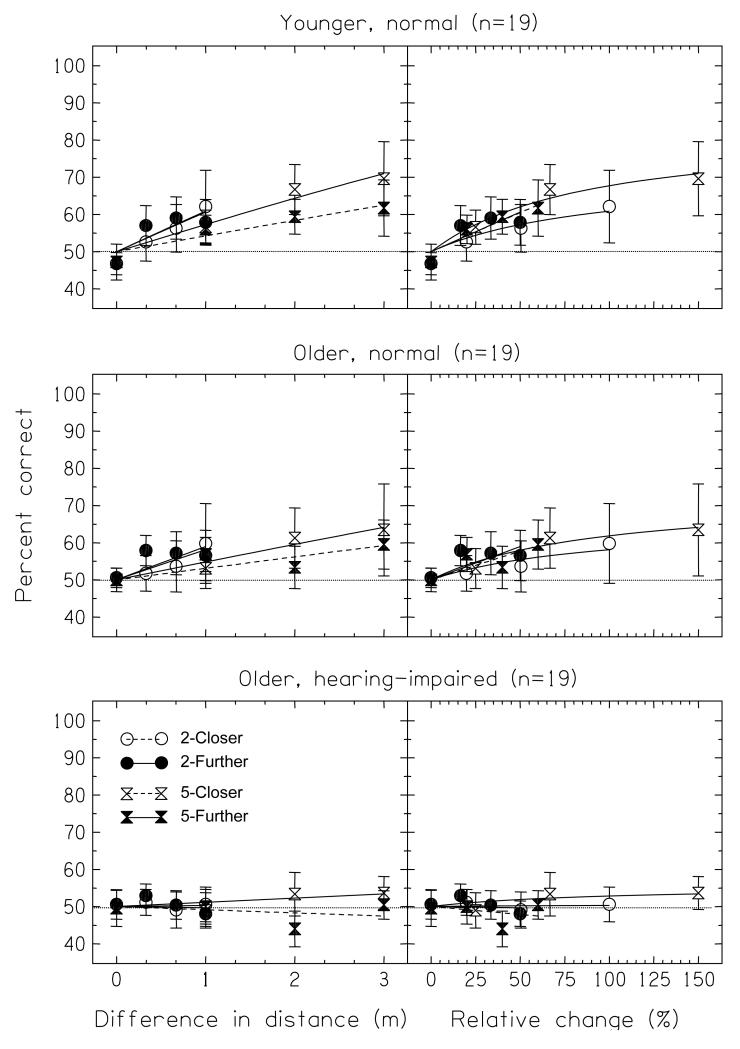
Figure 8 plots the corresponding data for the Equalized-level conditions. Performance was lower overall, and many of the psychometric functions — especially those for the older-impaired group — were near chance. The invariance with distance ratio was mostly observed, although here it was the 2-Closer task (open circles) that appeared to give lower performance than the other tasks. None of the average functions reached threshold (75%), but an extrapolation of the functions would give a discrimination threshold of, at best, a Δr/rmin of somewhere around 200%.
FIGURE 8.
As Fig. 7 but for the Equalized-level conditions.
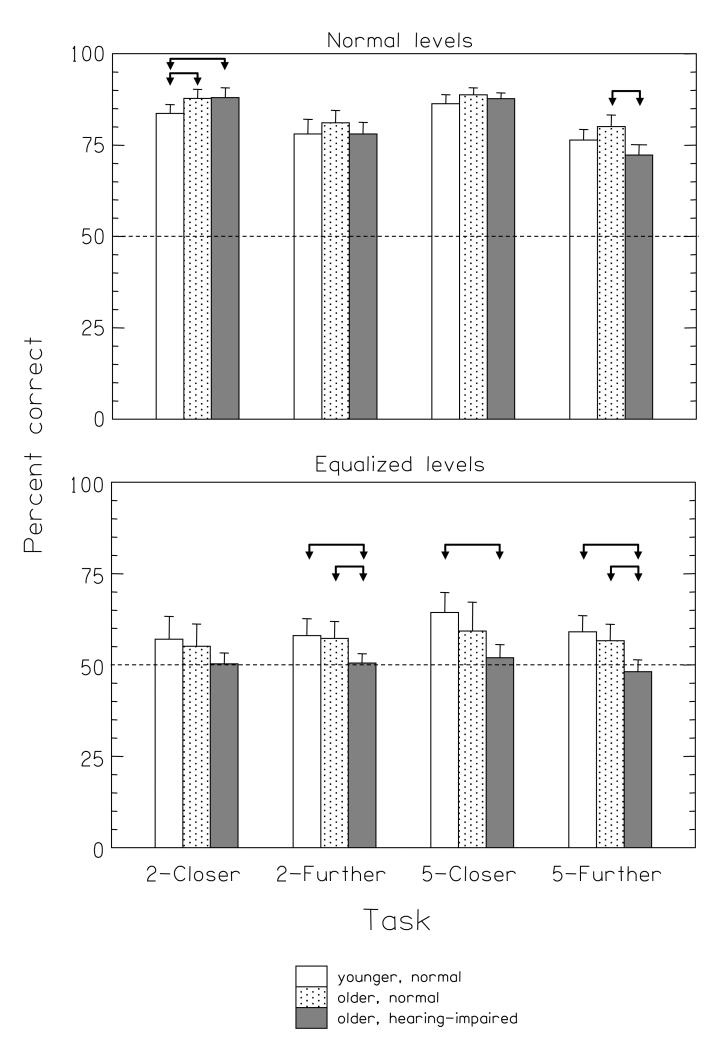
In order to formally compare the results across groups we calculated the average score across the three points with non-zero Δr/rmin in each of the psychometric functions. The results for the Normal-Level conditions are shown by the histogram bars in the top panel of Fig. 9. The arrows mark the significant comparisons, with a criterion for significance of p < 0.05. Non-parametric statistical tests showed that there was an overall effect of listener group for the 2-Closer and 5-Further tasks (respectively, Kruskall-Wallis H = 8.0, p < 0.05 and H = 9.7, p < 0.01); within these, the younger-control group gave significantly lower scores than the older-control and older-impaired groups for the 2-Closer task (respectively, Mann-Whitney Z = 2.2, p < 0.05, and Z = 2.5, p < 0.05), while the older-impaired group gave significantly lower scores than the older control group in the 5-Further task (Z = 3.1, p < 0.01). Neither the 2-Further nor 2-Closer tasks gave a significant overall effect (respectively, H = 1.8, not significant; H = 1.8, not significant). The equivalent results for the Equalized-level conditions are shown in the bottom panel of Fig. 9. Significant effects of listener group were found for the 2-Further, 5-Closer and 5-Further tasks (respectively, H = 8.2, p < 0.05; H = 8.4, p < 0.05; H = 14.0, p < 0.01). In all three tasks, the older-impaired group performed worse than the younger-control group (respectively, Z = 2.6, p < 0.01; Z = 3.1, p < 0.01; and Z = 3.5, p < 0.01), but the older-impaired group performed worse than the older-control group in only the 2-Further and 5-Further tasks (respectively, Z = 2.3, p < 0.05; Z = 2.8, p < 0.01). No effect was found for the 2-Closer condition (H = 3.0; not significant).
FIGURE 9.
Top panel: Average discrimination thresholds for each of the three groups of listeners for the four tasks in the normal-level conditions. The error bars are the 95% confidence intervals. The discrimination thresholds were calculated for d′ = 1. Bottom panel: Average percent-correct for each of the three groups of listeners for the four tasks in the equalized-level conditions and in the normal-level conditions. The values are the averages of the 3 right-most points in each psychometric function plotted in Figs. 7 and 8. The error bars are the 95% confidence intervals. Chance performance is 50%. In both panels the arrows mark the significant comparisons reported in the main text.
B. Individual results
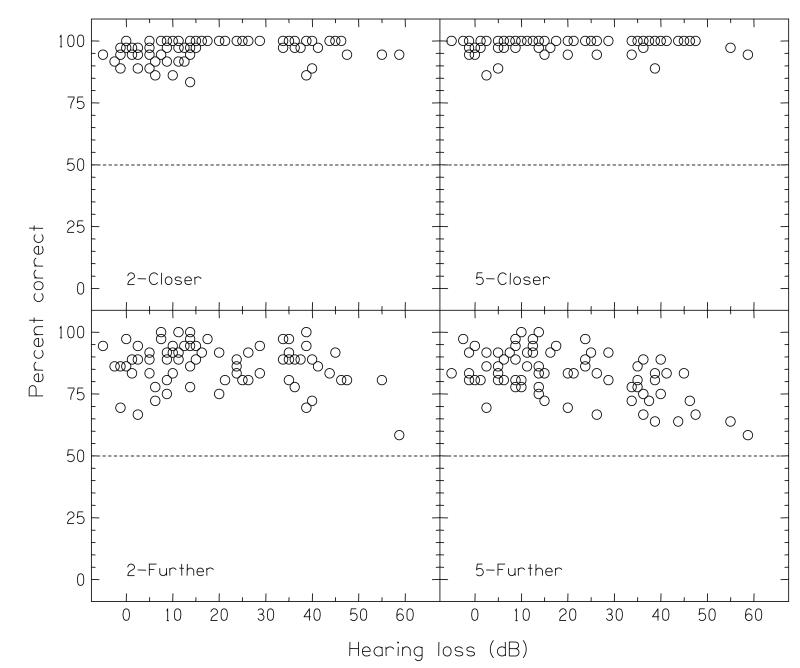
Further insight into the results can be found from considering the individual data. The four panels of Fig. 10 show, for each of the normal-level tasks, each individual’s score in the last point of the psychometric function as a function of their hearing loss (in 92% of the cases, this point gave the highest score on the psychometric function), for which the absolute difference in distance Δr was either ±1 (2-m tasks) or ±3 m (5-m tasks). As each point was based on 36 trials, the expected ±95% confidence interval about a score of 50% was a score range of ±17%. In the 2-Closer and 5-Closer tasks (top row), most of the listeners were performing the task at ceiling for this point (for the 2-Closer task, 54/77 listeners either scored maximum or made one mistake in the 36 trials; for the 5-Closer task, 67/77 listeners did the same). Nevertheless, in the 2-Closer task (top-left panel), there was a surprising number of normal-hearing listeners who performed lower than ceiling. In the 2-Further and 5-Further tasks (bottom row), the results were more variable; only a minority of listeners performed at ceiling (the corresponding counts were 11/77 and 6/77), while even at the lowest levels of hearing loss there were some listeners who performed notably poorly. The non-parametric correlations (Spearman’s rho) of performance with hearing loss for the four tasks, in the order 2-Closer, 2-Further, 5-Closer and 5-Further, were, respectively, +0.27, −0.11, −0.01, and −0.39 (p < 0.02, not significant, not significant, p < 0.01).
FIGURE 10.
Individual scores in the best (rightmost point) in each of the psychometric functions, plotted as a function of that individual’s hearing loss for the normal-level conditions.
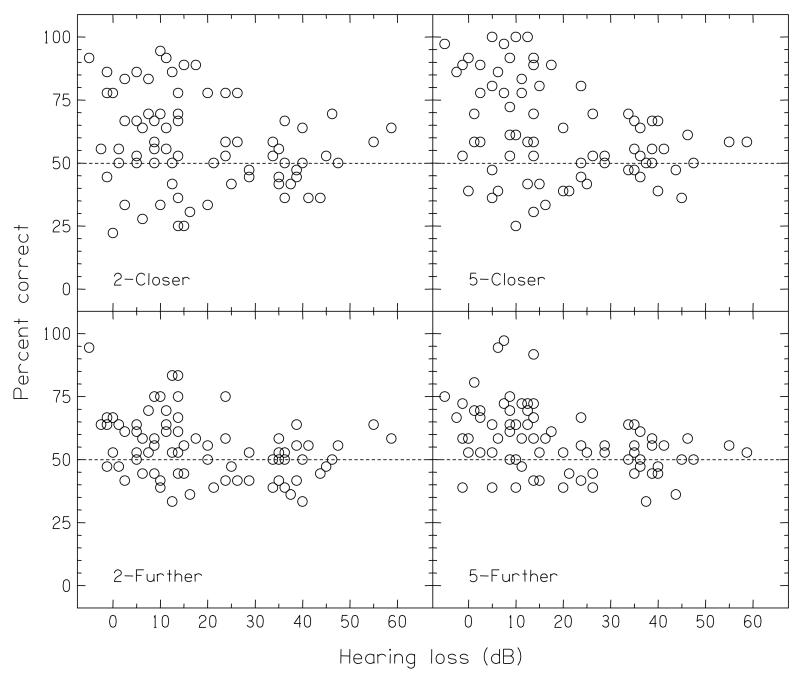
The corresponding plots for the Equalized-level conditions are shown in Fig. 11. In all four tasks there was a significant non-parametric correlation with hearing loss (respectively, r = −0.25, −0.34, −0.42, −0.49; p < 0.03, <0.01, <0.01, <0.01). Inspection of the graphs showed that the correlations were probably due to a relative lack of listeners who had high hearing losses and who performed well; at the lowest levels of hearing loss, the range of performances found was generally from 50% to 100%, but at the higher levels of hearing loss (25 dB or more), no-one performed above 75%.
FIGURE 11.
As Fig. 10, but the individual scores for the equalized-level conditions.
C. SSQ results
Table 2 reports the non-parametric correlations between the three summary measures of the SSQ distance questions and the average scores in each of the experimental conditions (columns 1-4) and with the average score across all the conditions (column 5). Apart from the 5-Further task with the “expected distance” summary measure, none of the Normal-level data correlated significantly with any of the SSQ responses. In contrast, the majority of the correlations of the Equalized-level data with the SSQ responses were significant; the correlation coefficients with the “expected distance” and “expected location” summary measures were about equal, although the correlation coefficients with the “dynamic-distance” summary measure were slightly less.
TABLE 2.
Correlations of the summary measures of the SSQ items with the experimental data
| Task |
||||||
|---|---|---|---|---|---|---|
| SSQ summary measure | Condition | 2-Closer | 2-Further | 5-Closer | 5-Furthe | All |
| Expected distance (#15, #16) | Normal-level | −0.03 | 0.20 | 0.25 | 0.28* | 0.21 |
| Expected location (#17) | Normal-level | 0.06 | 0.17 | 0.05 | 0.24 | 0.14 |
| Dynamic distance (#8, #9, #12, #13) | Normal-level | −0.16 | −0.11 | −0.04 | 0.12 | −0.05 |
|
| ||||||
| Expected distance (#15, #16) | Equalized-level | 0.32* | 0.47** | 0.40** | 0.25 | 0.40** |
| Expected location (#17) | Equalized-level | 0.30* | 0.39** | 0.36** | 0.26 | 0.37** |
| Dynamic distance (#8, #9, #12, #13) | Equalized-level | 0.22 | 0.30* | 0.29* | 0.14 | 0.28* |
The significance levels are marked by
** for < 0.01
and
* for < 0.05
That the signs of the significant correlations were all positive was expected: a higher mark on a SSQ item represented a better self-reported capability than a lower mark, while a higher score on the experimental test represented better distance discrimination than a lower score.
IV. DISCUSSION
A. Experimental results
We measured distance discrimination in a virtual 7-m × 9-m room for a population of normal-hearing and hearing-impaired listeners. When the levels of the sentences were “normal”, in that the differences in overall level due to the effect of the inverse-square law were available, the threshold (taken at 75% correct) corresponded to a relative change in distance Δr/rmin of about 25%. Only for the “further-than” task with the 5-m reference distance did a group of elderly hearing-impaired individuals perform worse than an age-matched normal-hearing group; there the threshold Δr/rmin was about 50%. These thresholds were derived from psychometric functions that assumed d′ was proportional to the absolute change in distance Δr, which, apart from one condition, gave good fits to the data (the exception was, again, the 5-m, further-than task). When the level of the sentences was equalized, in that the effect of the inverse-square-law was removed, performance was substantially worse in every condition. Everyone with a hearing loss more than about 25 dB performed at chance, and there was substantial individual variation even in the normal-hearing listeners: some were able to discriminate the distances well, while others were also at chance. Thresholds could not be reliably determined for these cases, but visual inspection suggested they would be of the order of 200%.
The previous studies of distance discrimination were reviewed by Zahorik et al. (2005). There is little agreement on threshold values, and both the methods used and the acoustic environment both affect the results. The smallest values have been found for anechoic or pseudo-anechoic (outdoor) environments; for instance Ashmead et al. (1990) reported a threshold change as small as 6% using an anechoic chamber with reference distances of 1 and 2 m and with a 500-ms broadband noise. A useful comparison may be made with Simpson and Stanton’s (1973) study who, like us, were also interested in normal situations of indoor listening. They used a 3.5 × 3.8 m IAC room, which they described as acoustically complex with some reverberant sound, and which gave a rate-of-change of overall level of 4 dB per doubling of distance; they did not report its reverberation time. A 1600-Hz pulse train served as the stimulus, which was continually presented while the loudspeaker was moved until the listener reported that it had moved. For a reference distance of 2.3 m they found a difference limen of 13% or 15% (expressed as Δr/rmin; the first value is for a target closer-than the reference, the second for further-than). We are unsure why this value is lower than what we found, but it may relate to our use of spoken sentences as stimuli. These were chosen specifically because they are typical and because speech is a prominent topic in the SSQ questionnaire; had we adopted other stimuli, we might have compromised the relationship between the experimental measure and the questionnaire data. But spoken sentences have fast, dynamic, unpredictable variations in level, and the mean level of each sentence in the present databases also varied by about 1-1.5 dB. It is possible that both effects contributed to a detriment on the psychophysical performance, as stimulus-specific effects have been observed before in distance studies: for instance, Zahorik (2002a) noted that listeners placed more weight on the direct-to-reverberant ratio for a noise-burst stimulus than for a single spoken-syllable stimulus.
Most of the listeners suffered considerable difficulties in comparing the distances of sounds in situations where changes in the overall level were unavailable and the primary cue to distance was the relationship between the direct and the reverberant sounds. We estimated a Δr/rmin of somewhere around 200% in the Equalized-level conditions, which compares poorly to the excellence of distance discriminability when overall level was the primary cue (e.g. Simpson and Stanton, 1973; Strybel and Perrott, 1984; Ashmead et al., 1990). It is also somewhat larger than that found by Zahorik (2002b), who determined the discrimination threshold for distance via measurements of the discrimination thresholds for the direct-to-reverberant ratio itself using a virtual-acoustic, headphone-presentation method. His results gave a direct-to-reverberant discrimination threshold of about 5 dB, corresponding to a distance-discrimination threshold of 2.59 when expressed as a factor of the reference distance or 159% when expressed as Δr/rmin. Zahorik also noted that it was similar to the factor (2.04, or a Δr/rmin of 104%) that he independently derived from a consideration of the variability in listeners’ reports of apparent distance that had collected in an earlier experiment in a small auditorium with a reverberation time of around 700 ms (Zahorik, 2002a).
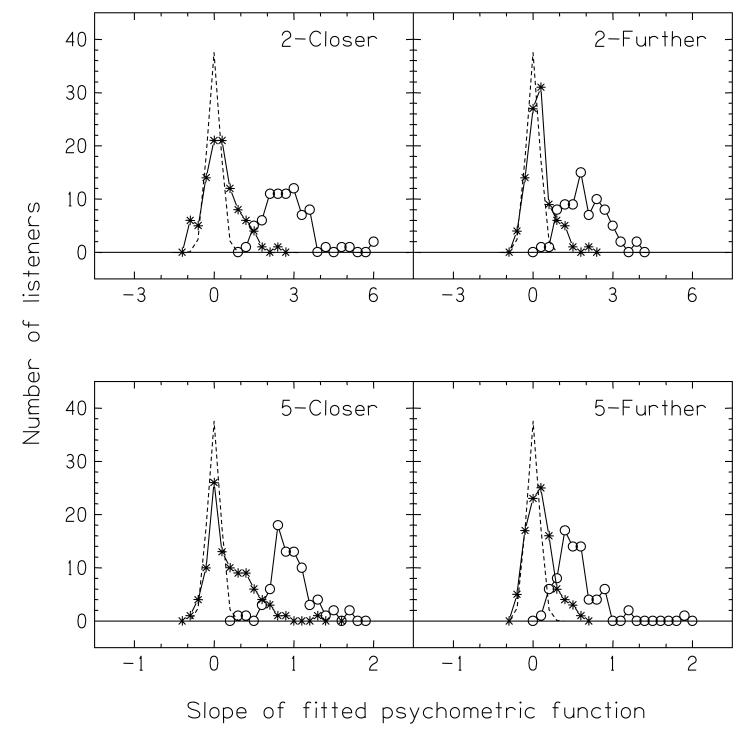
There was considerable individual variability in the Equalized-level conditions, however, and inspection of the results shown in Fig. 11 shows that some listeners may have been performing significantly worse than chance. This would suggest that they were using the total level of the reverberant sounds as a cue, rather than the direct-to-reverberant ratio: as can be seen from Fig. 4 (open circles), in the Equalized conditions this increased with distance, so, if a listener was deciding on the furthest-away of the stimuli in the two intervals by choosing that with a lower level, he/she would be marked wrong. To quantify this possibility, we fitted psychometric functions (as before, assuming d′ ∝ Δr) to each of the individual datasets and calculated the distribution of the slopes of the functions; any listener who responded on the basis of the direct sound would give a negative slope, any listener who randomly guessed would give a zero slope, and any listener who responded on the basis of the direct-to-reverberant ratio would give a positive slope. The results are plotted as asterisks in Fig. 12; it can be seen that there are a substantial number of listeners who give negative slopes. Some of these slopes will have happened by chance, however; to estimate these, we simulated 10000 “chance” psychometric functions, in each of which the score for each of the four points was obtained from 36 trials of random guessing, and fitted psychometric functions to those. The simulated distribution is shown by the dashed line in each panel of Fig. 12. On the upper side of the distributions, there are always more listeners than expected from the simulation who gave positive slopes; this indicates that some listeners could do the task and responded on the basis of the direct-to-reverberant ratio. Only in the lower side of one distribution (2-m Closer; top-left panel) were there more listeners — about 5 out of 77 — than expected who gave negative slopes. That is, some 5% of listeners in this condition appear to have responded on the basis of the level of the reverberant sounds. The open circles in Fig 12 plot the results of the corresponding analysis of the Normal-level conditions; as expected, all the listeners showed positive slopes, indicating they were responding on the basis of overall level.
FIGURE 12.
Top left panel: Distribution of the slopes of the individual psychometric functions for the 2-m Closer task in the Normal-level condition (open circles) and in the Equalized-level conditions (asterisks). The dashed line plots the expected distribution given chance performance, found using a computer simulation. Other panels: corresponding results for the other conditions of the experiment. Note that the abscissa for the bottom panels is different from the abscissa for the top panels.
One of the principle objectives of the present experiment was to determine if there were any effects of hearing impairment on distance perception. With the Normal-level stimuli, we found poorer performance only for the 5-Further task. As this was a condition where the change in the reverberant field dominated, it suggests that hearing-impaired listeners may have a reduced capacity to discriminate distances using the relationship between the direct sound and the reverberant field. This interpretation is consistent with the data from the Equalized-level conditions, where performance of the hearing-impaired group was essentially at chance (but note that a substantial number of the non-impaired listeners also performed near chance in these conditions).6 It parallels the common experience that hearing-impaired listeners endure many problems in reverberant or noisy environments. It also suggests that listeners with sensorineural hearing loss rely primarily on changes in overall level as a cue to differences in distance. If so, then any signal processing and fitting features in hearing aids or cochlear implants which can compromise overall level — for example, aggressively-applied, fast-acting multi-channel wide-dynamic-range compression, or adaptive directional microphones — might carry penalties in distance perception. Such features are usually designed to offer advantages in simple speech intelligibility, but for some patients distance perception (and spatial listening in general) is an important contributor to their experience of hearing handicap: for them, any feature that changes overall level may actually be disadvantageous.
In a room the level of the direct sound reduces at 6 dB per doubling of distance while the level of the reverberant sound often reduces at a rate of the order of 1 dB. Thus it would be expected that distance perception would become more problematic for hearing-impaired listeners the further away the target was. The point at which the levels of the direct sound and reverberant field are equal — the critical distance — depends upon the size of the room and its acoustic properties. For our virtual room, the critical distance was 4 m (Fig. 5). Although the direct-to-reverberant ratios in our room were similar to those measured in a real classroom of approximately the same size (Nielsen, 1993, reported values at 1 and 5 m of 8.3 and −3.4 dB; ours were +8 and −1 dB), our room had a relatively short reverberation time for its size (Nielsen’s value was about 500 ms; ours was about 250 ms). Longer reverberation times would reduce the critical distance, and so extend the range of difficult distances for hearing-impaired listeners.
The second principle objective was to determine if the experimental measure of distance perception was related to the self-report data from the SSQ questionnaire. Although the experimental method was much more controlled and constrained than the topics included in the SSQ, the data do provide some support in the performance domain for those self-reports.7 For the Normal-level conditions, there was only one significant correlation; the 5-further task with the “expected distance” SSQ score. That the overall-level cue was weakest in the 5-further condition, and that the majority of correlations between the Equalized-level data and the SSQ scores were statistically significant, suggests that listeners’ subjective ratings of distance capability may be determined by their experience in environments dominated by direct-to-reverberant ratio rather than by overall level. There was little distinction between the “expected distance” and “expected location” summary measures, which was perhaps to be expected given the similarity in the questions. The correlations with the “dynamic distance” summary measure were, on average, the least. This may have been due our use of static sentences; a dynamic experiment, incorporating moving stimuli, may be required to reveal strong correlations with those SSQ items.
B. Distance simulation with a 24-loudspeaker array
The methods used in previous distance experiments have either presented stimuli from loudspeakers at differing distances in real rooms or outdoors (e.g., Nielsen, 1993; Ashmead et al., 1995), or from headphones using virtual-acoustic techniques (e.g., Bronkhorst and Houtgast, 1999; Zahorik, 2002a). We do not know of any published studies that have used a synthetic loudspeaker-based system similar to our RI-CLA system, while we know of only one study that has used the more-complex method of wave-field synthesis (Kerber et al., 2004). Our system differs from that in the emphasis on one point in space — wave-field synthesis (e.g., Berkhout et al., 1993) attempts to recreate an accurate sound field across a substantial portion of space — and in accepting the curvature of the wavefronts that results from the loudspeakers being quite close to the listener. The system is similar to the “Simulated Open Field Environment” developed by Hafter and Seeber (2004) and Seeber and Hafter (2005), which uses a rectangular array of 48 loudspeakers instead of a circular ring of 24. All the loudspeaker methods have the advantage that the listener only uses their own HRTFs: there are no complications with non-individualized HRTFs; nor are there any difficulties with the weak externalization of the percepts that can sometimes occur with headphone-presented virtual-acoustics. Experimental time need not be spent measuring individual HRTFs for each listener, nor are there complications if the experimental design requires the listener to use hearing aids or cochlear implants. Furthermore, the computational analysis can be extended to generate the acoustics of most environments, so allowing considerable generality in future studies.
Our own experiences of the RI-CLA system — and those of visitors to the laboratory — were that the sounds were indeed at distance, and certainly further than the loudspeakers of the array. We have collected some acoustic and perceptual data that supports these experiences.
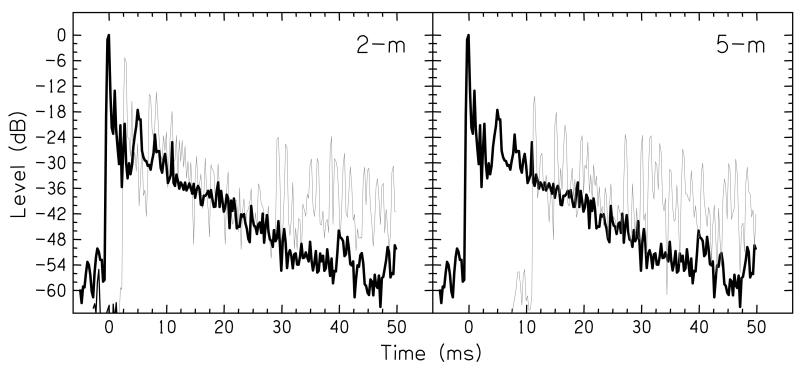
A set of acoustic measurements showed that the sounds actually found at the center of the loudspeaker array were, as required, dominated by the echoes calculated by the room-image method, but with the addition of reverberation from within the loudspeaker array and the experimental room. The solid line in both panels of Fig. 13 shows the instantaneous level (calculated via convolution with a 0.25-ms Hanning window) of the impulse response of the whole apparatus, measured by placing a single microphone at the center of the array, and recording the response to 10 clicks (to avoid the background noise in the room, the recordings were high-pass filtered from 200-12000 Hz). The largest pulse was the direct sound, followed by a set of individual reflections, of which the clearest was at 5.4 ms and which was due to the sound reflecting from the opposite side of the array to the source loudspeaker, and then followed by a decaying response, at a rate of approximately −0.75 dB per ms. The gray lines in each panel show the equivalent recordings for the 2-m virtual source (left panel) and the 5-m virtual source (right panel). Both of these contain substantially more reflections than the impulse room of the apparatus itself, and demonstrate the dependence of the level and delay of the direct sound on distance. The results show that the present method is suitable for recreating complex acoustic environments, despite the non-ideal acoustics of the loudspeaker array and the room
FIGURE 13.
The instantaneous level of the impulse response of the loudspeakers in the array, recorded in three conditions: 2-m virtual source (left panel, gray line); 5-m virtual source (right-panel, gray line), and a real source at 1-m (both panels, solid line). The recordings have been bandpass filtered between 200 and 12000 Hz to avoid the background noise in the room, and are the result of time-aligning the responses to 10 individual clicks and then averaging.
Additional perceptual data showed that, on average, the apparent distance of a spoken sentence was underestimated in comparison to the virtual distance the sentence was synthesized to be at; this result is consistent with the commonly-observed underestimation of the distance of a real source (see meta-analyses by Zahorik, 2002a, and Zahorik et al., 2005). During the initial, demonstration part of the experiment we asked listeners to report the apparent distance of a 5-m sentence: 81% of the listeners reported it as further than the actual loudspeakers, and 24% reported it as outside the experimental room. The listeners were also asked to estimate numerically the apparent distance of sources at 2, 5 and 8 m: the mean responses were 1.5, 3, and 4 m. Although our listeners had few visual markers with which to calibrate their numerical estimates of distance, and that the purpose of the demonstration was to provide structured practice and training to the listeners instead of formal experimental data, the data is suggestive that the RI-CLA system provided a good experience of auditory distance.
Nevertheless, there are some limitations in the present system, primarily due to the design and loudspeaker array and to the computer model used to calculate the acoustic environment of the room. First, we noticed occasional (7%) front/back errors in the demonstration phase of the experiment. Second, as the radius of the array is only 1 m, the wavefronts of the sounds will still be somewhat curved when they reach the listener. An application of the inverse-square law gives a reduction in intensity at the far ear compared to the near ear, of, at most, 1.8 dB, and so would be minor in comparison to the expected interaural level differences of up-to about 30 dB. Third, the apparent direction of the virtual source would tend towards the direction of one of the loudspeakers if the listener does not sit at the exact center of the array. If one sets as a criterion a difference between apparent and required angles of 10° — a reasonable value for a non-experienced hearing-impaired listener to notice a misalignment in azimuth — then a geometric calculation shows that for a virtual distance of 8 m, the listener must sit within ±20 cm of the center of the array. This size of this “sweet spot” is inversely dependent on the virtual distance; for a 2-m virtual source, it is ±40 cm. Finally, our implementation of Allen and Berkeley’s (1979) room-image procedure was deliberately restricted in its acoustic complexity, primarily in not using frequency-dependent absorption coefficients. It is clear that the final performance of any distance-synthesis system will be dependent upon the accuracy of the computational model; for instance, frequency-dependent effects were included by Bronkhorst (2000) in his calculation of the acoustics of a virtual room. We are presently exploring more complex algorithms.
C. Summary
The experimental results demonstrated that listeners with sensorineural hearing loss show deficits in the ability to use some of the cues — primarily the direct-to-reverberant ratio — that underpin distance perception, and the comparisons between the experimental data and the questionnaire responses suggests that hearing-impaired listeners may be thinking of environments dominated by direct-to-reverberant ratio when reporting their distance capabilities. Although the synthetic-distance paradigm used was simplified from the complexities and richness of everyday listening situations, the correspondence between performance on our constrained experimental task and a listener’s self-reported capability was encouraging. We plan on future studies that will address the challenges of making the environments more realistic while retaining experimental tractability, and expect to study the advantages and potential penalties of signal processing in hearing aids and cochlear implants.
ACKNOWLEDGEMENTS
This study was conducted while Julia Blaschke was an intern in the MRC Institute of Hearing Research, Glasgow, for which she was supported by a Leonardo da Vinci Scholarship from the European Union. The loudspeaker array was constructed by the Nottingham University Section of the MRC Institute of Hearing Research; the room-image program was developed by Dr. Joseph Desloge with support from a grant from the Air Force Office of Scientific Research held by Professor Barbara Shinn-Cunningham of Boston University. We thank the Associate Editor (Dr Armin Kohlrausch) and two anonymous reviewers for their incisive and informative comments during the review process, Trevor Agus and Dr. Gaetan Gilbert for comments on an earlier draft of this manuscript, David McShefferty for his help in making the acoustical measurements, and Ross Deas, Cheryl Glover, Pat Howell, and Helen Lawson for their assistance in collecting the experimental data. The Scottish Section of the IHR is co-funded by the Medical Research Council and the Chief Scientist’s Office of the Scottish Executive Health Department.
APPENDIX. Distance questions from the SSQ Questionnaire
The “Speech, Spatial, and Qualities of Hearing” Questionnaire was described by Gatehouse and Noble (2004) and Noble and Gatehouse (2004). Its 49 items include speech perception in noisy and/or dynamic environments, the direction and/or distance of sound sources, the clearness or naturalness of sounds, and the effort or concentration needed to listen or to distinguish sounds. Distance perception is a topic in seven of the 49 items. Items #15 and #16 refer to distance in general (“expected distance”), #8, #9, #12, and #13 to the distance of dynamic sounds (“dynamic distance”), and #17 to location in general (“expected location”):
#8. In the street, can you tell how far away someone is, from the sound of their voice or footsteps?
#9. Can you tell how far away a bus or truck is, from the sound?
#12. Can you tell from their voice or footsteps whether the person is coming towards you or going away?
#13. Can you tell from the sound whether a bus or truck is coming towards you or going away?
#15. Do the sounds of people or things you hear, but cannot see at first, turn out to be closer than expected?
#16. Do the sounds of people or things you hear, but cannot see at first, turn out to be further than expected?
#17. Do you have the impression of sounds being exactly where you would expect them to be?
Footnotes
For instance, the partial correlation of this speech-domain question with handicap was also 0.26: “You are talking with one other person in a quiet, carpeted lounge room. Can you follow what the other person is saying?”.
The rate-of-decay of 1 dB is for the combined level of the reverberation; each individual sound in the reverberation decays individually at 6 dB per doubling of distance.
The present method was our second attempt at a loudspeaker-based synthesis. We had previously tried a cross-talk-cancellation system, but we found fundamental limitations in its ability to reproduce accurately the ITD and ILD information underlying spatial perception. This work is described separately (Akeroyd et al., 2007).
We did not take any steps to prevent the listeners from seeing the loudspeaker array, because its design and placement in the room would have made it impractical to install any curtains or blinds. Our own experiences of valid distance percepts were obtained while being able to see the array.
Note that the whole loudspeaker array was rotated by 30° relative to the virtual room, and so the direct path was always presented from the 0° loudspeaker.
Curiously, the younger, normal-hearing listeners performed worse than the others in the 2-Closer task. We are at a loss to explain this.
Although the sizes of the correlations are modest, but they were not unusual in other studies that have compared performance tests to self-report data (e.g., Gatehouse, 1991).
PACS: 43.66Qp localization of sound sources
43.66Sr deafness, audiometry, ageing effects
43.55.Ka computer simulation of acoustics in enclosures
REFERENCES
- Akeroyd MA, Chambers J, Bullock D, Palmer AR, Summerfield Q, Nelson PA, Gatehouse S. The binaural performance of a cross-talk cancellation system with matched or mismatched setup and playback acoustics. J. Acoust. Soc. Am. 2007 doi: 10.1121/1.2404625. (in press; accepted Nov 8, 2006) [DOI] [PMC free article] [PubMed] [Google Scholar]
- Allen JB, Berkley DA. Image method for efficiently simulating small-room acoustics. J. Acoust. Soc. Am. 1979;65:943–950. [Google Scholar]
- Ashmead DH, Davis DL, Northington A. Contribution of listeners’ approaching motion to auditory distance perception. J. Exp. Psychol. Hum. Percept. Perform. 1995;21:239–256. doi: 10.1037//0096-1523.21.2.239. [DOI] [PubMed] [Google Scholar]
- Ashmead DH, LeRoy D, Odom RD. Perception of the relative distances of nearby sound sources. Percept. Psychophys. 1990;47:326–331. doi: 10.3758/bf03210871. [DOI] [PubMed] [Google Scholar]
- Bench J, Bamford J. Speech-hearing tests and the spoken language of hearing impaired children. Academic Press; London: 1979. [Google Scholar]
- Berkhout AJ, de Vries D, Vogel P. Acoustic control by wave field synthesis. J. Acoust. Soc. Am. 1993;93:2764–2778. [Google Scholar]
- Blauert J. Spatial Hearing, The Psychophysics of Human Sound Localization. MIT Press; Cambridge, MA: 1997. [Google Scholar]
- Bronkhorst AW, Houtgast T. Auditory distance perception in rooms. Nature. 1999;397:517–520. doi: 10.1038/17374. [DOI] [PubMed] [Google Scholar]
- Brungart DS, Durlach NI, Rabinowitz WM. Auditory localization of nearby sources. II. Localization of a broadband source. J. Acoust. Soc. Am. 1999;106:1956–1968. doi: 10.1121/1.427943. [DOI] [PubMed] [Google Scholar]
- Coleman P. An analysis of cues to auditory depth perception in free space. Psychol. Bull. 1963;60:302–315. doi: 10.1037/h0045716. [DOI] [PubMed] [Google Scholar]
- Culling JF, Hodder KI, Toh CY. Effects of reverberation on perceptual segregation of competing voices. J. Acoust. Soc. Am. 2003;114:2871–2876. doi: 10.1121/1.1616922. [DOI] [PubMed] [Google Scholar]
- Davies A. Hearing in Adults. Whurr; London: 1995. [Google Scholar]
- Gatehouse S. The role of non-auditory factors in measured and self-reported disability. Acta Otolaryngol Suppl. 1991;476:249–256. [PubMed] [Google Scholar]
- Gatehouse S, Noble W. The Speech, Spatial and Qualities of Hearing Scale (SSQ) Int. J. Audiol. 2004;43:85–99. doi: 10.1080/14992020400050014. [DOI] [PMC free article] [PubMed] [Google Scholar]
- Hafter E, Seeber B. The simulated open field environment for auditory localization research. Proceedings of the 18th Int. Congress on Acoustics, Vol. 5; Kyoto, Japan. 2004. pp. 3751–3754. [Google Scholar]
- Kerber S, Wittek H, Fastl H, Theile G. Experimental investigations into the distance perception of nearby sound sources: Real vs. WFS virtual nearby sources. Proceedings of the 7th Congrès Français d’Acoustique / 30th Deutsche Jahrestagung für Akustik (CFA/DAGA 04); Strasbourg, France. 2004. pp. 1041–1042. [Google Scholar]
- Kompis M, Dillier N. Simulating transfer functions in a reverberant room including source directivity and head-shadow effects. J. Acoust. Soc. Am. 1993;93:2779–2787. [Google Scholar]
- Litovsky RY, Colburn HS, Yost WA, Guzman SJ. The precedence effect. J. Acoust. Soc. Am. 1999;106:1633–1654. doi: 10.1121/1.427914. [DOI] [PubMed] [Google Scholar]
- MacLeod A, Summerfield Q. Quantifying the contribution of vision to speech perception in noise. Br. J. Audiol. 1987;21:131–141. doi: 10.3109/03005368709077786. [DOI] [PubMed] [Google Scholar]
- Nielsen SH. Auditory distance perception in different rooms. J. Audio. Eng. Soc. 1993;41:755–770. [Google Scholar]
- Noble W, Gatehouse S. Interaural asymmetry of hearing loss, Speech, Spatial and Qualities of Hearing Scale (SSQ) disabilities and handicap. Int. J. Audiol. 2004;43:100–114. doi: 10.1080/14992020400050015. [DOI] [PubMed] [Google Scholar]
- Peterson PM. Simulating the response of multiple microphones to a single acoustic source in a reverberant room. J. Acoust. Soc. Am. 1986;80:1527–1529. doi: 10.1121/1.394357. [DOI] [PubMed] [Google Scholar]
- Sabine WC. Collected papers on acoustics. Dover; New York: 1964. [Google Scholar]
- Schroeder MR. Integrated-impulse method measuring sound decay without using impulses. J. Acoust. Soc. Am. 1979;66:497–500. [Google Scholar]
- Seeber B, Hafter E. Redesign of the simulated open-field environment and its application in audiological research. Abstracts of the 28th Annual Midwinter Meeting, Assoc Res. Otolaryngol.2005. p. 339. [Google Scholar]
- Simpson WE, Stanton LD. Head movement does not facilitate perception of the distance of a source of sound. Am. J. Psychol. 1973;86:151–159. [PubMed] [Google Scholar]
- Strybel TZ, Perrott DR. Discrimination of relative distances in the auditory modality: The success and failure of the loudness discrimination hypothesis. J. Acoust. Soc. Am. 1984;76:318–320. doi: 10.1121/1.391064. [DOI] [PubMed] [Google Scholar]
- Wightman FL, Kistler DJ. Sound localization. In: Yost WA, Popper AN, Fay RR, editors. Human psychophysics. Springer-Verlag; New York: 1993. pp. 155–192. [Google Scholar]
- Wightman FL, Kistler DJ. Measurement and validation of human HRTFs for use in hearing research. Acta Acustica-Acustica. 2005;91:429–439. [Google Scholar]
- Zahorik P. Assessing auditory distance perception using virtual acoustics. J. Acoust. Soc. Am. 2002a;111:1832–1846. doi: 10.1121/1.1458027. [DOI] [PubMed] [Google Scholar]
- Zahorik P. Direct-to-reverberant energy ratio sensitivity. J. Acoust. Soc. Am. 2002b;112:2110–2117. doi: 10.1121/1.1506692. [DOI] [PubMed] [Google Scholar]
- Zahorik P, Brungart DS, Bronkhorst AW. Auditory distance perception in humans: a summary of past and present research. Acta Acustica-Acustica. 2005;91:409–420. [Google Scholar]
- Zurek PM. Auditory target detection in reverberation. J. Acoust. Soc. Am. 2004;115:1609–1620. doi: 10.1121/1.1650333. [DOI] [PubMed] [Google Scholar]


