

Abstract
The complex process of carcinogenesis begins with transformation of a single cell to favor aberrant traits such as loss of contact inhibition and unregulated proliferation – features found in every cancer. Despite cancer’s widespread prevalence, the early events that initiate cancer remain elusive, and without knowledge of these events cancer prevention is difficult. Here we show that exposure to As, Cr, Ni, or Vanadium (V) promotes changes in gene expression that occur in conjunction with aberrant growth. We exposed immortalized human bronchial epithelial cells to one of four metals/metalloid for four to eight weeks and selected transformed clonal populations based upon anchorage independent growth of single cells in soft agar. We detected a metal-specific footprint of cancer-related gene expression that was consistent across multiple transformed clones. These gene expression changes persisted in the absence of the progenitor metal for numerous cell divisions. Our results show that even a brief exposure to a carcinogenic metal may cause many changes in gene expression in the exposed cells, and that from these many changes, the specific change(s) that each metal causes that initiate cancer likely arise.
Introduction
Our study seeks to identify the early gene expression changes that occur in a human bronchial epithelial cell as it transforms into a cancer cell following chronic exposure to a carcinogenic metal compound. Gene expression studies seeking to understand cancer often analyze human tumor tissue, and while these studies may be useful in developing treatment options for cancer, they do not provide the information necessary to understand the etiology of cancer, which is necessary when seeking to prevent cancer. Tumors develop from single cells that have dysregulated gene expression patterns favoring their unregulated growth, but because the time between the initiating exposure or event and the development of a detectable tumor is often on the order of years, the tumor cell population is unlikely to resemble the original cell that initiated the tumor1. Because tumors are often comprised of a heterogeneous cell population that is not representative of the progenitor cell, it is nearly impossible to identify the early changes that initiated and promoted cancer based solely on tumor analysis2.
A number of metals including arsenic (As), chromium (Cr) and nickel (Ni) are known human carcinogens capable of transforming cells 3. Exposure to these metals occurs worldwide in occupational settings and through environmental pollution. Historically, exposure to these metals has been associated with the onset many cancers, including lung cancer – a highly lethal form of cancer 4. Our studies analyze the effects of three known carcinogens (As, Cr, and Ni) and one possible carcinogen (V) on gene expression in human bronchial epithelial cells via an accepted experimental method 5.
Results
To determine what transformative changes occurred and persisted as a result of exposure to carcinogenic metals, we exposed an immortalized human bronchial epithelial cell line (BEAS-2B) to equivalent and minimally cytotoxic doses of an aqueous solution of one of four different metals: As, Cr, Ni or V (Fig. 1). After a 30 to 60 day exposure, the metal was removed for the remainder of the experiment. A single-cell suspension of the metal-treated cell population was seeded into soft agar in order to assess their ability to proliferate in an anchorage independent manner, a key step in the transition of a normal cell into a cancer cell for fibroblasts and some epithelial cells. A small percentage of both metal-treated and control cells were able to grow in an anchorage independent condition, and these cells developed colonies in a dose-dependent manner (Cr6; data not shown for As, Ni and V) over a period of 3 to 4 weeks. Isolated colonies that arose from individual cells were removed from the agar and grown in monolayer for many cell divisions in the absence of metal exposure. While both control and metal clones were able to revert to monolayer growth, the metal-treated clones displayed a unique morphology as compared to the control clones, which retained a phenotype consistent with the parental cells that were never grown in agar (Fig. 2). Cells of the control clones were flat and generally resembled the parental BEAS-2B population. By contrast the metal/metalloid-transformed clones were rounder, more densely packed together and formed a cobblestone appearance. Additionally, when trypsinized, the transformed cells detached from the culture surface more easily than the control cells. Clones derived from metal-treated cells were able to form tumors in nude mice whereas the control clones did not grow as xenographs in nude mice 6.
Fig. 1. Experimental Summary.

Immortalized human bronchial epithelial (BEAS-2B) cells were either treated with one of four metals/metalloid or left untreated. After 30–60 days of chronic exposure, metals/metalloid were removed, cells were seeded as a single cell suspension into soft agar and allowed to grow for 3–4 weeks until isolated colonies were large enough to extract from the agar. Five to seven individual colonies were isolated from the agar and seeded separately in monolayer. After a sufficient number of cells grew in monolayer from each individual isolated clone (approximately 18 days, depending on colony size), the RNA was harvested and each clone was analyzed (without replicate) with Affymetrix gene expression array analysis. wk = weeks of exposure
Fig. 2. Monolayer Phenotype.
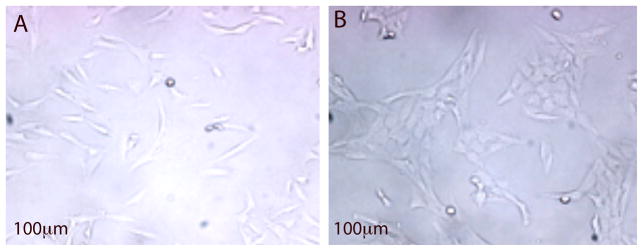
Figure 2A: Representative phenotype of control clones; Figure 2B: Representative Ni-transformed clone phenotype. Both clones were grown in monolayer under standard culture conditions. Cells of the control clones were flat and generally resembled the parental BEAS-2B population. By contrast the metal/metalloid-transformed clones were rounder, more densely packed together and formed a cobblestone appearance.
A total of 36 clones (25 metal-transformed clones [7 each for As and Ni, 6 for Cr and 5 for V], and 11 control clones) and 3 parental BEAS-2B cell populations (never seeded in agar) were examined for changes in the expression of over 28,000 well-annotated genes using Affymetrix 1.0 ST arrays. Gene expression array results were validated with quantitative PCR (qPCR) for Cr-transformed clones 6 and Ni-transformed clones (Supplementary Fig. 1a, b). Changes in all seven Ni-transformed clones were consistent (Supplementary Fig. 1c, d). The resulting gene expression changes represent long-term adaptations and selection, and are indicative of heritable changes that we hypothesize are due to alteration of the epigenetic programs that control gene expression.
Principle component analysis (Fig. 3) revealed that all 36 clones clustered based on their exposure. All control clones, despite having grown spontaneously in agar, clustered near the parental cell lines that were grown only in monolayer, suggesting that the cell culture process alone did not transform the cells. Metal-treated clones clustered apart from the control clones with each metal-transformed clone clustering close to clones that shared the same metal exposure. While Cr and V were more separated in their clustering, the As and Ni clones displayed a similar clustering pattern. When a PCA was conducted in the absence of the Cr and V data the As and Ni clones showed greater separation (Fig. 4),. A list of differentially expressed genes was generated using a one-way ANOVA with Benjamini-Hochberg corrected p-value of 0.0001, yielding a subset of 4,231 genes (Supplementary Table 1) that were significantly up-regulated or down-regulated in multiple clones for at least one of the four metals. Cluster analysis of this subset revealed that each of the 11 untreated control clones displayed a random pattern of gene expression changes and little overlap with the clones that originated from metal-exposed cells, while metal-transformed clones clustered based on their treatment group (Fig. 5).
Figure 3. Principal Components Analysis.

Three-dimensional representation of the principal components analysis of all 28 869 genes for 39 total Affymetrix gene expression arrays, consisting of: 25 metal-transformed clones (7 each for Arsenic [red triangle] and Nickel [blue square], 6 for Chromium [light blue rectangle] and 5 for Vanadium [orange diamond]), 11 control clones (gray circle), and 3 parental cell populations that were never grown in agar (dark gray oval). All control clones cluster near the parental cell lines, while each clone that was derived from a metal-treated cell clusters near clones that received the same treatment. The PCA scores were computed in GeneSpring version 11.5 from the eigenvalue decomposition of the covariance matrix of the data using the first 3 or more largest eigenvectors.
Figure 4. Principal Components Analysis for Arsenic and Nickel.

Subset of the data in Figure 3, excluding the metal-transfomed clones, control clones, and parental cell populations that were processed for Chromium and Vanadium treatments. This figure shows that nickel and arsenic display a distinct gene expression pattern.
Figure 5. Hierarchical Clustering Dendrogram.

This heatmap shows 4231 genes resulting from a one-way ANOVA with Benjamini-Hochberg Correction, p-value .0001, for all 36 clones (25 metal-transformed clones, 11 controls) and 3 parental cell populations. Genes that were increased in expression compared to their control clones are shown in red while under-expressed genes are depicted in blue. Dendrogram was created in GeneSpring version 11.5 by using a hierarchical clustering algorithm and Pearson-centered distance metric. Clones derived from metal-treated cells generally cluster together and untreated control clones cluster with the parental cell populations.
Pathway analysis with DAVID software revealed several disease and cancer-related pathways that were significantly changed by one or more metal exposures(Table II). DAVID analysis of each set of genes either up or down-regulated in each metal-transformed group of clones revealed that all metals show changes in genes either directly or indirectly related to the process of carcinogenesis (Tables 3,4). The complete list of genes used to generate the pathway and term information is provided in Supplementary Tables 2–5. In addition to the major disease and cancer-related pathways listed in Table 2, the genes changed in each metal were also tied to genes in other pathways that are important for normal cellular functions, These pathways are listed in Supplementary Tables 6–9 and include pathways related to biosynthesis (O-glycan and unsaturated fatty acids), metabolism (fructose/mannose, alanine/aspartate/glutamate, butanoate, and vitamin B6), cell signaling (PPAR, mTOR, ErbB, and calcium signaling), circadian rhythm, aldosterone-regulated sodium reabsorption, and the immune system.
Table 2.
Select Pathways Relevant to Human Disease
| Term | # Genes | p-value | Group |
|---|---|---|---|
| hsa04010:MAPK signaling pathway | 19 | 1.3E-02 | Cr-down |
| hsa04350:TGF-beta signaling pathway | 11 | 1.6E-03 | Cr-down |
| hsa04350:TGF-beta signaling pathway | 4 | 7.1E-02 | As-down |
| hsa04360:Axon guidance | 11 | 2.7E-02 | Cr-down |
| hsa04510:Focal adhesion | 21 | 6.4E-05 | Cr-down |
| hsa04510:Focal adhesion | 9 | 2.8E-02 | V-up |
| hsa04510:Focal adhesion | 8 | 7.3E-02 | Ni-down |
| hsa04512:ECM-receptor interaction | 13 | 7.7E-05 | Cr-down |
| hsa04512:ECM-receptor interaction | 6 | 1.8E-02 | V-up |
| hsa04512:ECM-receptor interaction | 6 | 1.9E-02 | Ni-down |
| hsa04810:Regulation of actin cytoskeleton | 18 | 3.3E-03 | Cr-down |
| hsa04910:Insulin signaling pathway | 6 | 1.2E-01 | Cr-up |
| hsa04940:Type I diabetes mellitus | 5 | 2.6E-02 | As-up |
| hsa05200:Pathways in cancer | 25 | 1.6E-03 | Cr-down |
| hsa05210:Colorectal cancer | 10 | 4.8E-03 | Cr-down |
| hsa05211:Renal cellcarcinoma | 9 | 4.7E-03 | Cr-down |
| hsa05212:Pancreatic cancer | 8 | 2.0E-02 | Cr-down |
| hsa05215:Prostate cancer | 8 | 5.5E-02 | Cr-down |
| hsa05220:Chronic myeloid leukemia | 7 | 6.8E-02 | Cr-down |
| hsa05221:Acute myeloid leukemia | 5 | 8.5E-02 | As-up |
| hsa05222:Small cell lung cancer | 8 | 4.3E-02 | Cr-down |
| hsa05222:Small cell lung cancer | 5 | 6.7E-02 | V-up |
| hsa05223:Non-small cell lung cancer | 5 | 7.3E-02 | As-up |
| hsa05223:Non-small cell lung cancer | 4 | 7.6E-02 | V-up |
| hsa05330:Allograft rejection | 4 | 7.1E-02 | As-up |
| hsa05332:Graft-versus-host disease | 5 | 2.0E-02 | As-up |
| hsa05410:Hypertrophic cardiomyopathy (HCM) | 12 | 3.0E-04 | Cr-down |
| hsa05412:Arrhythmogenic right ventricular cardiomyopathy (ARVC) | 9 | 7.3E-03 | Cr-down |
| hsa05414:Dilated cardiomyopathy | 11 | 2.3E-03 | Cr-down |
As/Ni, fold-change cut-off of 1.25; Cr/V, fold-change cut-off of 1.50.
Table 3.
Select GO Terms Associated with Up-Regulated Genes
| Category | Term | # Genes | p-value |
|---|---|---|---|
| Arsenic | |||
| GOTERM_MF_FAT | GO:0051059~NF-kappaB binding | 6 | 1.8E-03 |
| GOTERM_BP_FAT | GO:0048661~positive regulation of smooth muscle cell proliferation | 5 | 1.4E-02 |
| GOTERM_MF_FAT | GO:0004886~retinoid-X receptor activity | 3 | 3.0E-02 |
| GOTERM_MF_FAT | GO:0003712~transcription cofactor activity | 19 | 3.2E-02 |
| GOTERM_BP_FAT | GO:0006325~chromatin organization | 19 | 3.3E-02 |
| GOTERM_MF_FAT | GO:0003713~transcription coactivator activity | 13 | 3.4E-02 |
| GOTERM_BP_FAT | GO:0016568~chromatin modification | 15 | 3.9E-02 |
| GOTERM_BP_FAT | GO:0046328~regulation of JNK cascade | 6 | 4.7E-02 |
| Chromium | |||
| GOTERM_BP_FAT | GO:0006928~cell motion | 22 | 2.2E-03 |
| GOTERM_CC_FAT | GO:0030057~desmosome | 4 | 9.0E-03 |
| SP_PIR_KEYWORDS | keratin | 8 | 2.0E-02 |
| GOTERM_BP_FAT | GO:0007411~axon guidance | 7 | 3.3E-02 |
| GOTERM_BP_FAT | GO:0048870~cell motility | 13 | 4.2E-02 |
| GOTERM_BP_FAT | GO:0016477~cell migration | 12 | 4.5E-02 |
| Nickel | |||
| GOTERM_BP_FAT | GO:0048568~embryonic organ development | 10 | 5.4E-03 |
| GOTERM_BP_FAT | GO:0001525~angiogenesis | 9 | 7.2E-03 |
| GOTERM_BP_FAT | GO:0046328~regulation of JNK cascade | 6 | 7.9E-03 |
| GOTERM_BP_FAT | GO:0040017~positive regulation of locomotion | 7 | 1.1E-02 |
| GOTERM_BP_FAT | GO:0001666~response to hypoxia | 8 | 1.5E-02 |
| GOTERM_BP_FAT | GO:0043408~regulation of MAPKKK cascade | 7 | 1.8E-02 |
| GOTERM_BP_FAT | GO:0030335~positive regulation of cell migration | 6 | 2.8E-02 |
| GOTERM_BP_FAT | GO:0051092~positive regulation of NF-kappaB TF activity | 4 | 4.3E-02 |
| Vanadium | |||
| GOTERM_BP_FAT | GO:0007155~celladhesion | 26 | 3.0E-04 |
| GOTERM_BP_FAT | GO:0030521~androgen receptor signaling pathway | 5 | 3.0E-03 |
| GOTERM_BP_FAT | GO:0045597~positive regulation of cell differentiation | 11 | 5.4E-03 |
| GOTERM_CC_FAT | GO:0031012~extracellular matrix | 13 | 9.8E-03 |
| GOTERM_BP_FAT | GO:0006928~cell motion | 16 | 1.4E-02 |
| GOTERM_BP_FAT | GO:0016477~cell migration | 11 | 1.8E-02 |
| GOTERM_BP_FAT | GO:0008361~regulation of cell size | 9 | 2.3E-02 |
| GOTERM_CC_FAT | GO:0005925~focal adhesion | 6 | 2.4E-02 |
| GOTERM_CC_FAT | GO:0005924~cell-substrate adherens junction | 6 | 2.8E-02 |
Table 4.
Select GO Terms Associated with Down-Regulated Genes
| Category | Term | # Genes | p-value |
|---|---|---|---|
| Arsenic | |||
| GOTERM_MF_FAT | GO:0005024~transforming growth factor beta receptor activity | 3 | 2.9E-02 |
| GOTERM_BP_FAT | GO:0043525~positive regulation of neuron apoptosis | 3 | 3.8E-02 |
| GOTERM_BP_FAT | GO:0043123~positive regulation of I-kappaB kinase/NF-kappaB cascade | 5 | 4.8E-02 |
| GOTERM_BP_FAT | GO:0050680~negative regulation of epithelial cell proliferation | 3 | 4.8E-02 |
| Chromium | |||
| GOTERM_BP_FAT | GO:0051270~regulation of cell motion | 23 | 1.2E-06 |
| GOTERM_BP_FAT | GO:0007179~transforming growth factor beta receptor signaling pathway | 12 | 6.5E-06 |
| GOTERM_BP_FAT | GO:0001568~blood vessel development | 24 | 1.7E-05 |
| GOTERM_BP_FAT | GO:0030334~regulation of cell migration | 18 | 9.5E-05 |
| GOTERM_BP_FAT | GO:0008361~regulation of cell size | 19 | 3.5E-04 |
| SP_PIR_KEYWORDS | extracellular matrix | 18 | 3.2E-03 |
| GOTERM_BP_FAT | GO:0043405~regulation of MAP kinase activity | 13 | 3.8E-03 |
| GOTERM_BP_FAT | GO:0045785~positive regulation of cell adhesion | 8 | 4.9E-03 |
| GOTERM_BP_FAT | GO:0042981~regulation of apoptosis | 43 | 6.4E-03 |
| GOTERM_BP_FAT | GO:0048286~lung alveolus development | 5 | 6.7E-03 |
| GOTERM_BP_FAT | GO:0022407~regulation of cell-cell adhesion | 5 | 6.7E-03 |
| GOTERM_BP_FAT | GO:0001666~response to hypoxia | 12 | 8.0E-03 |
| KEGG_PATHWAY | hsa04010:MAPK signaling pathway | 19 | 1.3E-02 |
| KEGG_PATHWAY | hsa05212:Pancreatic cancer | 8 | 2.0E-02 |
| KEGG_PATHWAY | hsa05222:Small cell lung cancer | 8 | 4.3E-02 |
| Nickel | |||
| SP_PIR_KEYWORDS | extracellular matrix | 15 | 1.0E-04 |
| GOTERM_CC_FAT | GO:0031012~extracellular matrix | 19 | 2.0E-04 |
| GOTERM_CC_FAT | GO:0005604~basement membrane | 8 | 9.0E-04 |
| GOTERM_BP_FAT | GO:0045785~positive regulation of cell adhesion | 7 | 1.1E-03 |
| GOTERM_BP_FAT | GO:0007155~cell adhesion | 25 | 5.3E-03 |
| GOTERM_BP_FAT | GO:0051270~regulation of cell motion | 10 | 1.4E-02 |
| GOTERM_BP_FAT | GO:0030199~collagen fibril organization | 4 | 1.9E-02 |
| GOTERM_BP_FAT | GO:0030334~regulation of cell migration | 8 | 5.0E-02 |
| Vanadium | |||
| GOTERM_BP_FAT | GO:0045449~regulation of transcription | 53 | 1.1E-02 |
| GOTERM_MF_FAT | GO:0004629~phospholipase C activity | 4 | 1.2E-02 |
| GOTERM_BP_FAT | GO:0043627~response to estrogen stimulus | 6 | 2.2E-02 |
| GOTERM_BP_FAT | GO:0051092~positive regulation of NF-kappaB TF activity | 4 | 2.4E-02 |
| SP_PIR_KEYWORDS | transcription regulation | 41 | 2.7E-02 |
To determine if epigenetic modifications caused the gene expresson changes, we conducted an initial survey of select global histone modification marks. In most cases the changes between control and metal-transformed clones were not significant (H3 and H4 acetylation, gamma H2A.X, H3K36me3). However, H4K20me3 marks were significantly lower in the transformed nickel clones than in the control clones.(not shown)
Discussion
Few genes were consistently changed across all the metal treatments, reflecting the wide variety of mechanisms by which cancer begins. SATB homeobox 2 (SATB2) (Table I), a transcriptional modifier, was up-regulated in all four metal treatments. Were the metal exposure still occurring, a consistent change across all four treatments might indicate a generic stress response, however, since the analysis was performed many cell generations after cessation of the metal-treatment, we infer that metal exposure produces long-term up-regulation of this gene and constitutes an early step in metal-induced transformation. In support of this hypothesis, up-regulation of SATB2 has been associated with multiple types of cancer 7, is highly conserved across vertebrate species 8 and plays an integral role in regulating gene expression. SATB2 impacts transcriptional regulation by altering chromatin stucture, serving as a transcriptional activator of certain genes, and augmenting the activity of other transcriptional activators, including ΔNp63 9.
Table 1.
Select Cancer-Related Genes Differentially Expressed in Transformed Clones
| Transcript ID | As | Cr | Ni | V | Symbol | Gene Description |
|---|---|---|---|---|---|---|
| 8015769 | −2.08 | BRCA1 | breast cancer 1, early onset | |||
| 8051583 | −7.07 | −4.62 | −4.93 | 11.24 | CYP1B1 | cytochrome P450, family 1, subfamily B, polypeptide 1 |
| 8056222 | 6.50 | 2.49 | DPP4 | dipeptidyl-peptidase 4 | ||
| 8022692 | 8.15 | 34.96 | −51.06 | DSC3 | desmocollin 3 | |
| 8113433 | −8.29 | EFNA5 | ephrin-A5 | |||
| 7954090 | −2.07 | 2.68 | EMP1 | epithelial membrane protein 1 | ||
| 8122150 | −13.24 | 57.45 | EYA4 | eyes absent homolog 4 (Drosophila) | ||
| 8015685 | −1.90 | EZH1 | enhancer of zeste homolog 1 (Drosophila) | |||
| 8056257 | 3.50 | −3.93 | FAP | fibroblast activation protein, alpha | ||
| 8046906 | 7.74 | 6.01 | 11.27 | −10.18 | GULP1 | GULP, engulfment adaptor PTB domain containing 1 |
| 8084880 | 2.21 | HES1 | hairy and enhancer of split 1, (Drosophila) | |||
| 7956878 | 3.88 | −7.52 | IRAK3 | interleukin-1receptor-associated kinase 3 | ||
| 7943282 | 1.83 | KDM4D | lysine (K)-specific demethylase 4D | |||
| 8177232 | −4.58 | 5.11 | KDM5D | lysine (K)-specific demethylase 5D | ||
| 8160346 | −11.04 | PTPLAD2 | protein tyrosine phosphatase-like A domain containing 2 | |||
| 8058091 | 3.21 | 4.70 | 6.85 | 2.37 | SATB2 | SATB homeobox 2 |
| 8096675 | −1.82 | TET2 | tet oncogene family member 2 |
Metals clones vs. Control clones, t-test with fold-change cut-off ≤ 1.50, p-value 0.050.
Each of the four metal treatments resulted in unique and persistent changes in gene expression. We hypothesize that each metal specifically altered the epigenetic program of the exposed cell. Each metal is capable of interacting with biomolecules that may regulate the epigenetic program of the cell. Our lab has shown that Ni has the ability to inactivate dioxygenase enzymes by displacement of Fe in the catalytic site 10. Through this mechanism nickel inhibits the activity of histone demethylases such as lysine (K)-specific demethylase 4D/5D (KDM4D/5D) or the tet oncogene family member genes (TET) leading to increases in histone lysine methylation (H3K9me2, H3K4me3) and DNA hypermethylation 11, events which impact the level of gene transcription. The ability of all four metals to induce oxidative stress may deplete reduced ascorbate, which is required for normal function of these key modifiers of epigenetic regulation, as well as other members of the dioxygenase superfamily of enzymes. As3+ also interacts with vicinyl thiol groups which may affect multiple proteins and enzymes as well as causing chromosomal abnormalities. Vanadium can bind and interfere with tyrosine phosphatases that are key regulators of multiple signaling cascades 12.
The altered expression of genes regulating epigenetic mechanisms was reflected in gene expression analysis. V-transformed clones exhibited up-regulation of KDM5D, an enzyme responsible for de-methylating histone H3 at lysine 4 (H3K4) resulting in gene silencing. Conversely, EZH1 was down-regulated in these clones, an effect that would result in gene activation, as EZH1 is part of the Polycomb group complex that methylates H3K27, a repressive histone mark. Similarly, Cr-transformed clones exhibited down-regulation of TET2, KDM5D and KDM4D, all genes related to epigenetic regulation. While KDM5D was described previously, KDM4D demethylates H3K9me2/3, resulting in gene activation. TET2 is an oncogene that catalyzes the conversion of methylcytosine to 5-hydroxymethylcytosine, which will have multiple effects on DNA methylation and therefore on gene expression.
Many of the genes that were differentially expressed were related to cancer. Three of the most highly up-regulated genes in the As-transformed clones are cancer promoters including dipeptidyl-peptidase 4 (DPP4 or CD26) and fibroblast activation protein alpha (FAP). Both genes are membrane bound proteases that degrade the extracellular matrix (ECM) and are up-regulated in multiple cancers including pre-cancerous esophageal cells, and non small cell lung cancer 13. DPP4 is highly expressed in association with malignant mesothelioma and known to increase tumor cell invasion, metastasis, and proliferation 13d, 14. Rarely expressed in normal tissues, FAP is associated with 90% of epithelial tumors, where it has been shown to promote tumor growth when expressed by tumor associated fibroblasts 15. Known to act as an immune suppressor in epithelial tumors, FAP has been successfully targeted in multiple mouse cancer models, and chemotherapeutic drugs directed against FAP have reached phase II clinical trial level in humans 13c, 16. Consistent with the immunosuppression caused by FAP, interleukin receptor-associated kinase (IRAK3) 17, was also up regulated in As transformed clones. Increased expression of IRAK3 was correlated with poor survival in patients with lung adenocarcinoma tumors; mice without IRAK3 expression were found to be resistant to tumor formation 17b, 18. The increase in DPP4/CD26, FAP, and IRAK3 in the As-transformed clones is consistent with arsenic’s well-known role as a tumor promoter.
Despite the apparent similarities between As and Ni clones seen in clustering (Fig. 3), there remain several differences in their gene expression. Hairy Enhancer of Split (HES1) was up-regulated uniquely in Ni-transformed clones. This gene is associated with resistance to cell cycle arrest and is up-regulated in many cancers including non-small cell lung cancer 19. The most down-regulated gene unique to Ni-transformed cells was the relatively unstudied gene known as protein tyrosine phosphatase-like A domain containing 2 (PTPLAD2), closely related to phosphatases that are important in the regulation of signaling pathways that control cell growth, proliferation and transformation. This gene was found to be deleted in both glioblastomas and acute lymphoblastic leukemias in two separate studies 20, suggesting the possibility that it may function as a tumor suppressor. Ephrin-A5 (EFNA5) was also significantly down-regulated in Ni-transformed clones. EFNA5 is a key player in cell adhesion and migration that has been shown to be hypermethylated in non-Hodgkin’s lymphoma, suppressed by hypermethylation in acute lymphoblastic leukemia and down-regulated (but not methylated) in chondrosarcomas 21. A third down-regulated tumor suppressor gene is epithelial membrane protein 1 (EMP1) that has been associated with suppression of proliferation and metastasis. Expression of EMP1 is down-regulated in oral squamous cell carcinoma with increased lymph node metastasis, and its down-regulation is mediated by the polycomb repressor complex (EZH2) in Ewing Tumors 22. The change in expression for these genes is consistent with the development of cancer.
Comparison of Cr and V-transformed cells often revealed opposing changes in gene expression and supports the wide dysregulation of genes found across cancer types where the direction of the gene expression change can vary by type of cancer. For example, eye absent homolog 4 (EYA4), a tyrosine phosphatase that targets H2AX, was down-regulated in Cr-transformed clones but highly up-regulated in V-transformed clones. EYA4 is over-expressed in peripheral nerve sheath tumors and esophageal cancer, yet hypermethylated and therefore under-expressed in both lung adenocarcinomas and colon cancer 23. Since V is known to inhibit phosphatase activity, it is possible disruption of phosphatase activity limited the negative feedback response leading to up-regulation of EYA4. Another gene exhibiting opposing expression patterns is desmocollin 3 (DSC3), which encodes a protein critical for cell-to-cell junctions; it was up-regulated in Cr-transformed clones and down-regulated in V-transformed clones. Expression of this gene is dysregulated in various cancers as well, and its expression as protein is used as an immunohistological screening tool to identify different forms of lung cancer.
As discussed, V exhibited a clear ability to impact epigenetic related genes, but it also had other notable features. An important cancer-related DNA repair gene, BRCA1, was also down-regulated in V-transformed clones. Moreover, the V-exposed clones had a large subset of genes that changed in the opposite direction relative to the other treatment groups. Cytochrome P4501B1 (CYP1B1) displayed a strong up-regulation in V-transformed cells and similarly strong down-regulation by the other three metals, while engulfment adaptor PTB domain containing 1 (GULP1) exhibited the opposite pattern (Table 1). The distinct pattern of gene expression in the V-transformed clones reinforces the concept that each metal has a unique mechanism of action.
Experimental
Cell culture and metal exposure
Immortalized human bronchial epithelial cells (BEAS-2B) cells (ATCC) were cultured in Dulbecco’s Modified Eagle’s Medium (GIBCO) supplemented with 1% Penicillin/Streptomycin (10,000 units/mL Penicillin and 10,000 μg/mL Streptomycin) (GIBCO) and 10% Fetal Bovine Serum (Atlanta Biologicals) in a humidified atmosphere and 5% CO2 at 37°C. Before reaching 80% confluence, cells were passaged by rinsing with phosphate buffered saline (pH7.4) (−) MgCl2, (−) CaCl2, (GIBCO) and trypsinzined (0.05% Trypsin-EDTA, (GIBCO). Soluble sodium arsenite (2.0 μM NaAsO2) (Sigma), potassium chromate (0.50 μM K2CrO4) (Sigma), nickel (II) sulfate (250. μM NiSO4) (Alfa Aesar), or sodium meta-vanadate (10.0 μM NaVO3) (Sigma) were added to the media from a freshly prepared aqueous filter-sterilized solution. The media was changed every other day, and cells were split in the presence of metal every third day.
Growth in Soft Agar
After 30–60 days of metal/metalloid exposure, all cells were rinsed with PBS to remove metals/metalloid from the media, and then cells were seeded in DIFCO BACTO agar (Sigma) with a top layer of 0.35% agar and a bottom layer of 0.5% agar in accordance with standard protocols 24, with the exception that 5,000 cells were seeded in each well of a 6-well plate, with each metal group seeded in triplicate. Cells were allowed to grow for 3–4 weeks in soft agar (without metal exposure), until individual isolated colonies were large enough to collect from the agar. Five to seven transformed colonies and 6 control colonies were selected and grown out from single colonies in monolayer (without metal exposure) for an additional 3 weeks at which time RNA was collected for Affymetrix exon expression array.
mRNA Expression
Total RNA from each clone was extracted using Trizol (Invitrogen) according to the manufacturer’s protocol and purified using RNeasy Plus Micro Kit (Qiagen). The cDNA probes were synthesized using the WT Expression Kit for Affymetrix Whole Transcript Expression Arrays (Ambion), fragmented, labeled using Affymetrix Whole Transcript Terminal Labeling Kit (Affymetrix), and subjected to hybridization with GeneChip Human Gene 1.0 ST Array (Affymetrix) that contains 28,869 well annotated genes. Hybridization and scanning of the arrays was performed using standard procedures.
qPCR Validation
RNA was extracted from cells and purified using Trizol (invitrogen) and converted to cDNA with Superscript III First-Strand Synthesis System for RT-PCR (invitrogen). Quantitative real-time PCR was performed using Power SYBR green (Applied Biosystems) on a 7900HT system (Applied Biosystems). All PCR reactions were performed in triplicate. Primers sequences are listed in Supplementary Table 10. Relative gene expression level normalized to GAPDH was calculated with the Pffafl method 25. The results were presented as fold change relative to the level expressed in control clones.
Statistical Analysis
Raw Affymetrix values were pre-processed in R where they were normalized in batches using robust multichip average (RMA) 26 and batch normalized using an empirical Bayes approach. Microarray data analysis was performed using GeneSpring Multi-Omic Analysis version 11.5 (Agilent Technologies). All metal-transformed clone samples were base-lined to the median levels of their respective control samples. Principal components analysis (PCA) was used to visualize the gene expression pattern of all samples. Hierarchical cluster analysis using a Pearson centered distance metric with a centroid linkage rule was performed to cluster genes that met criteria for a one-way ANOVA (p-value ≤ 0.0001) with Benjamini-Hochberg correction for all 39 clones. A t-test volcano plot with a p-value of ≤ 0.05 and a fold-change cut-off of 1.50 was used to identify differentially expressed genes in individual metals as compared to their control clones. Functional annotation was analyzed with the Gene Ontology (GO) classification system using on-line DAVID software (http://david.abcc.ncifcrf.gov) 27.
Conclusion
In our study, differentially expressed genes were identified in multiple clones that had been derived from metal-treated cells as compared to control clones that went through the same growth process. The changes in gene expression were consistent across multiple clones several weeks after the metal exposure was removed. It is likely that these changes were induced by a persistent alteration of the epigenetic program of the cell specifically induced by the metal to which the cell was originally exposed. Each of the four metals has different properties in relation to biological systems, many of which may alter epigenetic regulation. Primarily found as either arsenite (As3+) or arsenate (As5+), metabolism of As is complex, as the body methylates inorganic As prior to excretion. As3+ interacts with vicinyl thiol groups, affecting multiple proteins and enzymes, while As5+ uncouples mitochondrial oxidative phosphorylation. While As exposure is known to produce chromosomal abnormalities, hexavalent chromium (Cr6+) is the only known mutagen of the four metals. Cr6+ exists as an oxyanion in biological systems, and it readily enters the cell via the sulfate and phosphate transporters where it concentrates in the liver, spleen, and kidney. The toxicity of Cr6+ likely occurs during the intracellular reduction of Cr6+ to the less harmful trivalent chromium (Cr3+) by ascorbic acid, glutathione or cysteine. Cr6+ is genotoxic, and its reduction results in Cr adducts on both DNA and protein. In biological systems, nickel is found as the cation Ni2+. In the blood Ni is conjugated to protein, including any histidine-containing proteins, albumin, α2-microglobulin, transferrin, nickelplasmin, and metallothionein. Ni has been shown to displace other essential metal cofactors, e.g. iron in dioxygenases and zinc in DNA-binding proteins, leading to epigenetic changes such as increases in histone lysine methylation (H3K9me2, H3K4me3) and DNA hypermethylation 11. Vanadium enters the cell as vanadate (V5+) and is reduced by glutathione to vanadyl (V4+). Both forms may bind and interfere with tyrosine phosphatases 12.
Because BEAS-2B cells are already immortalized with the SV40 virus, they have already met at least two requirements in the path to full transformation, having circumvented apoptosis via suppression of the p53 pathway and avoided senescence by maintenance of telomeres 28. The fact that the gene expression of three separately prepared BEAS-2B cell populations clustered near the 11 control clones suggests to us that the changes observed by exposure to one of the four metals/metalloids are a direct result of exposure to that metal. Because the metals further increased the amount of anchorage independent growth, we postulate that the changes induced by the metal have promoted the process of transformation and pushed the cells further down the road to being full fledged tumorigenic cells.
Another important and interesting observation is that metal induced cell transformation can manifest itself through a variety of different gene expression changes. Which of these are the actual drivers or passengers of the carcinogenesis process is not known at this time. However, it is well known that cancer is not formed by one specific route, but rather by multiple different routes all leading to a similar disease state, and thus a number of different gene expression changes can lead to cell transformation and cancer. This may be due to the redundancy of enzymes and pathways that humans have to essentially accomplish the same task in the cell. While these critical enzymes and pathways are necessary for our survival, they may also be rich targets for carcinogenic alteration.. Each metal carcinogen interacts with the epigenetic program in different ways: Ni has the ability to inhibit histone demethylases or the TET oncogenes by displacement of Fe in the catalytic site that inactivates these enzymes, and V5+, Cr6+ or As3+‘s ability to induce oxidative stress that could deplete reduced ascorbate, which is required for normal function of these enzymes, as well as other members of the dioxygenase superfamily of enzymes.
Since each metal provides a different complement of gene expression changes, the genes changed in this study are suggestive of biomarkers that can identify early exposure to particular metals. The results of our study also demonstrate how cancer can arise through different and complex gene expression changes. These changes can also yield information on the etiology of the cancer.
Supplementary Material
Acknowledgments
Funding
This work was supported by the National Institutes of Environmental Health Sciences (ES000260, ES010344, ES014454, ES005512); the National Cancer Institute (CA16087); the National Center for Research Resources (RR029893). The funders had no role in study design, data collection and analysis, decision to publish, or preparation of the manuscript.
Footnotes
Supplementary Figure 1 and Supplementary Tables 1–10 can be found online. Microarray data is MIAME compliant and the raw data has been deposited in the NCBI Gene Expression Omnibus (GEO) and assigned series accession number GSE36684.
Conflict of Interest Statement: None declared.
References
- 1.(a) Gerlinger M, Rowan AJ, Horswell S, Larkin J, Endesfelder D, Gronroos E, Martinez P, Matthews N, Stewart A, Tarpey P, Varela I, Phillimore B, Begum S, McDonald NQ, Butler A, Jones D, Raine K, Latimer C, Santos CR, Nohadani M, Eklund AC, Spencer-Dene B, Clark G, Pickering L, Stamp G, Gore M, Szallasi Z, Downward J, Futreal PA, Swanton C. Intratumor heterogeneity and branched evolution revealed by multiregion sequencing. N Engl J Med. 2012;366:883–92. doi: 10.1056/NEJMoa1113205. [DOI] [PMC free article] [PubMed] [Google Scholar]; (b) Marusyk A, Almendro V, Polyak K. Intra-tumour heterogeneity: a looking glass for cancer? Nat Rev Cancer. 2012;12:323–34. doi: 10.1038/nrc3261 nrc3261. [pii] [DOI] [PubMed] [Google Scholar]
- 2.Stovold R, Blackhall F, Meredith S, Hou J, Dive C, White A. Biomarkers for small cell lung cancer: Neuroendocrine, epithelial and circulating tumour cells. Lung Cancer. 2012;76:263–8. doi: 10.1016/j.lungcan.2011.11.015. S0169-5002(11)00589-7 [pii] [DOI] [PubMed] [Google Scholar]
- 3.(a) Costa M. Carcinogenic metals. Sci Prog. 1998;81(Pt 4):329–39. [PubMed] [Google Scholar]; (b) Galanis A, Karapetsas A, Sandaltzopoulos R. Metal-induced carcinogenesis, oxidative stress and hypoxia signalling. Mutat Res. 2009;674:31–5. doi: 10.1016/j.mrgentox.2008.10.008. S1383-5718(08)00305-7 [pii] [DOI] [PubMed] [Google Scholar]; (c) Wild P, Bourgkard E, Paris C. Lung cancer and exposure to metals: the epidemiological evidence. Methods Mol Biol. 2009;472:139–67. doi: 10.1007/978-1-60327-492-0_6. [DOI] [PubMed] [Google Scholar]; (d) Martinez VD, Vucic EA, Becker-Santos DD, Gil L, Lam WL. Arsenic exposure and the induction of human cancers. J Toxicol. 2011;2011:431287. doi: 10.1155/2011/431287. [DOI] [PMC free article] [PubMed] [Google Scholar]
- 4.(a) Siegel R, Naishadham D, Jemal A. Cancer statistics, 2012. CA Cancer J Clin. 2012;62:10–29. doi: 10.3322/caac.20138. [DOI] [PubMed] [Google Scholar]; (b) Urbano AM, Rodrigues CFD, Alpoim MC. Hexavalent chromium exposure, genomic instability and lung cancer. Gene Ther Mol Biol. 2008;12B:219–238. [Google Scholar]
- 5.Fisher PB, Dorsch-Hasler K, Weinstein IB, Ginsberg HS. Interactions between initiating chemical carcinogens, tumor promoters, and adenovirus in cell transformation. Teratog Carcinog Mutagen. 1980;1:245–57. doi: 10.1002/tcm.1770010302. [DOI] [PubMed] [Google Scholar]
- 6.Sun H, Clancy HA, Kluz T, Zavadil J, Costa M. Comparison of Gene Expression Profiles in Chromate Transformed BEAS-2B Cells. PLoS One. 2011;6 doi: 10.1371/journal.pone.0017982. ARTN e17982. [DOI] [PMC free article] [PubMed] [Google Scholar]
- 7.(a) Chung J, Lau J, Cheng LS, Grant RI, Robinson F, Ketela T, Reis PP, Roche O, Kamel-Reid S, Moffat J, Ohh M, Perez-Ordonez B, Kaplan DR, Irwin MS. SATB2 augments ΔNp63α in head and neck squamous cell carcinoma. EMBO Rep. 2010;11:777–83. doi: 10.1038/embor.2010.125. embor2010125 [pii] [DOI] [PMC free article] [PubMed] [Google Scholar]; (b) Patani N, Jiang W, Mansel R, Newbold R, Mokbel K. The mRNA expression of SATB1 and SATB2 in human breast cancer. Cancer Cell Int. 2009;9:18. doi: 10.1186/1475-2867-9-18. 1475-2867-9-18 [pii] [DOI] [PMC free article] [PubMed] [Google Scholar]; (c) Magnusson K, de Wit M, Brennan DJ, Johnson LB, McGee SF, Lundberg E, Naicker K, Klinger R, Kampf C, Asplund A, Wester K, Gry M, Bjartell A, Gallagher WM, Rexhepaj E, Kilpinen S, Kallioniemi OP, Belt E, Goos J, Meijer G, Birgisson H, Glimelius B, Borrebaeck CA, Navani S, Uhlén M, O’Connor DP, Jirström K, Pontén F. SATB2 in combination with cytokeratin 20 identifies over 95% of all colorectal carcinomas. Am J Surg Pathol. 2011;35:937–48. doi: 10.1097/PAS.0b013e31821c3dae. 00000478-201107000-00001 [pii] [DOI] [PubMed] [Google Scholar]
- 8.(a) FitzPatrick DR, Carr IM, McLaren L, Leek JP, Wightman P, Williamson K, Gautier P, McGill N, Hayward C, Firth H, Markham AF, Fantes JA, Bonthron DT. Identification of SATB2 as the cleft palate gene on 2q32–q33. Hum Mol Genet. 2003;12:2491–501. doi: 10.1093/hmg/ddg248. ddg248 [pii] [DOI] [PubMed] [Google Scholar]; (b) Sheehan-Rooney K, Pálinkášová B, Eberhart JK, Dixon MJ. A cross-species analysis of Satb2 expression suggests deep conservation across vertebrate lineages. Dev Dyn. 2010;239:3481–91. doi: 10.1002/dvdy.22483. [DOI] [PMC free article] [PubMed] [Google Scholar]
- 9.Dobreva G, Chahrour M, Dautzenberg M, Chirivella L, Kanzler B, Fariñas I, Karsenty G, Grosschedl R. SATB2 is a multifunctional determinant of craniofacial patterning and osteoblast differentiation. Cell. 2006;125:971–86. doi: 10.1016/j.cell.2006.05.012. S0092-8674(06)00578-2 [pii] [DOI] [PubMed] [Google Scholar]
- 10.Chen H, Giri NC, Zhang R, Yamane K, Zhang Y, Maroney M, Costa M. Nickel ions inhibit histone demethylase JMJD1A and DNA repair enzyme ABH2 by replacing the ferrous iron in the catalytic centers. J Biol Chem. 2010;285:7374–83. doi: 10.1074/jbc.M109.058503. M109.058503 [pii] [DOI] [PMC free article] [PubMed] [Google Scholar]
- 11.(a) Arita A, Costa M. Epigenetics in metal carcinogenesis: nickel, arsenic, chromium and cadmium. Metallomics. 2009;1:222–8. doi: 10.1039/b903049b. [DOI] [PMC free article] [PubMed] [Google Scholar]; (b) Chen H, Costa M. Iron-and 2-oxoglutarate-dependent dioxygenases: an emerging group of molecular targets for nickel toxicity and carcinogenicity. Biometals. 2009;22:191–6. doi: 10.1007/s10534-008-9190-3. [DOI] [PMC free article] [PubMed] [Google Scholar]
- 12.Beyersmann D, Hartwig A. Carcinogenic metal compounds: recent insight into molecular and cellular mechanisms. Arch Toxicol. 2008;82:493–512. doi: 10.1007/s00204-008-0313-y. [DOI] [PubMed] [Google Scholar]
- 13.(a) Nancarrow DJ, Clouston AD, Smithers BM, Gotley DC, Drew PA, Watson DI, Tyagi S, Hayward NK, Whiteman DC. Whole genome expression array profiling highlights differences in mucosal defense genes in Barrett’s esophagus and esophageal adenocarcinoma. PLoS One. 2011;6:e22513. doi: 10.1371/journal.pone.0022513. PONE-D-11-05378 [pii] [DOI] [PMC free article] [PubMed] [Google Scholar]; (b) Chen WT, Kelly T. Seprase complexes in cellular invasiveness. Cancer Metastasis Rev. 2003;22:259–69. doi: 10.1023/a:1023055600919. [DOI] [PubMed] [Google Scholar]; (c) Eager RM, Cunningham CC, Senzer N, Richards DA, Raju RN, Jones B, Uprichard M, Nemunaitis J. Phase II trial of talabostat and docetaxel in advanced non-small cell lung cancer. Clin Oncol (R Coll Radiol) 2009;21:464–72. doi: 10.1016/j.clon.2009.04.007. S0936-6555(09)00143-5 [pii] [DOI] [PubMed] [Google Scholar]; (d) Ghani FI, Yamazaki H, Iwata S, Okamoto T, Aoe K, Okabe K, Mimura Y, Fujimoto N, Kishimoto T, Yamada T, Xu CW, Morimoto C. Identification of cancer stem cell markers in human malignant mesothelioma cells. Biochem Biophys Res Commun. 2011;404:735–42. doi: 10.1016/j.bbrc.2010.12.054. S0006-291X(10)02292-8 [pii] [DOI] [PubMed] [Google Scholar]
- 14.Dimitrova M, Ivanov I, Todorova R, Stefanova N, Moskova-Doumanova V, Topouzova-Hristova T, Saynova V, Stephanova E. Comparison of the activity levels and localization of dipeptidyl peptidase IV in normal and tumor human lung cells. Tissue Cell. 2011 doi: 10.1016/j.tice.2011.11.003. S0040-8166(11)00130-3 [pii] [DOI] [PubMed] [Google Scholar]
- 15.Santos AM, Jung J, Aziz N, Kissil JL, Pure E. Targeting fibroblast activation protein inhibits tumor stromagenesis and growth in mice. J Clin Invest. 2009;119:3613–25. doi: 10.1172/JCI38988 38988. [pii] [DOI] [PMC free article] [PubMed] [Google Scholar]
- 16.(a) Wen Y, Wang CT, Ma TT, Li ZY, Zhou LN, Mu B, Leng F, Shi HS, Li YO, Wei YQ. Immunotherapy targeting fibroblast activation protein inhibits tumor growth and increases survival in a murine colon cancer model. Cancer Sci. 2010;101:2325–32. doi: 10.1111/j.1349-7006.2010.01695.x. CAS1695 [pii] [DOI] [PMC free article] [PubMed] [Google Scholar]; (b) Lee J, Fassnacht M, Nair S, Boczkowski D, Gilboa E. Tumor immunotherapy targeting fibroblast activation protein, a product expressed in tumor-associated fibroblasts. Cancer Res. 2005;65:11156–63. doi: 10.1158/0008-5472.CAN-05-2805. 65/23/11156 [pii] [DOI] [PubMed] [Google Scholar]; (c) Kraman M, Bambrough PJ, Arnold JN, Roberts EW, Magiera L, Jones JO, Gopinathan A, Tuveson DA, Fearon DT. Suppression of antitumor immunity by stromal cells expressing fibroblast activation protein-alpha. Science. 2010;330:827–30. doi: 10.1126/science.1195300. 330/6005/827 [pii] [DOI] [PubMed] [Google Scholar]
- 17.(a) del Fresno C, Otero K, Gomez-Garcia L, Gonzalez-Leon MC, Soler-Ranger L, Fuentes-Prior P, Escoll P, Baos R, Caveda L, Garcia F, Arnalich F, Lopez-Collazo E. Tumor cells deactivate human monocytes by up-regulating IL-1 receptor associated kinase-M expression via CD44 and TLR4. J Immunol. 2005;174:3032–40. doi: 10.4049/jimmunol.174.5.3032. 174/5/3032 [pii] [DOI] [PubMed] [Google Scholar]; (b) Standiford TJ, Kuick R, Bhan U, Chen J, Newstead M, Keshamouni VG. TGF-beta-induced IRAK-M expression in tumor-associated macrophages regulates lung tumor growth. Oncogene. 2011;30:2475–84. doi: 10.1038/onc.2010.619. onc2010619 [pii] [DOI] [PMC free article] [PubMed] [Google Scholar]
- 18.Xie Q, Gan L, Wang J, Wilson I, Li L. Loss of the innate immunity negative regulator IRAK-M leads to enhanced host immune defense against tumor growth. Mol Immunol. 2007;44:3453–61. doi: 10.1016/j.molimm.2007.03.018. S0161-5890(07)00133-2 [pii] [DOI] [PMC free article] [PubMed] [Google Scholar]
- 19.Sang L, Coller HA, Roberts JM. Control of the reversibility of cellular quiescence by the transcriptional repressor HES1. Science. 2008;321:1095–100. doi: 10.1126/science.1155998. 321/5892/1095 [pii] [DOI] [PMC free article] [PubMed] [Google Scholar]
- 20.(a) Nord H, Hartmann C, Andersson R, Menzel U, Pfeifer S, Piotrowski A, Bogdan A, Kloc W, Sandgren J, Olofsson T, Hesselager G, Blomquist E, Komorowski J, von Deimling A, Bruder CE, Dumanski JP, Diaz de Stahl T. Characterization of novel and complex genomic aberrations in glioblastoma using a 32K BAC array. Neuro Oncol. 2009;11:803–18. doi: 10.1215/15228517-2009-013. 15228517-2009-013 [pii] [DOI] [PMC free article] [PubMed] [Google Scholar]; (b) Usvasalo A, Ninomiya S, Raty R, Hollmen J, Saarinen-Pihkala UM, Elonen E, Knuutila S. Focal 9p instability in hematologic neoplasias revealed by comparative genomic hybridization and single-nucleotide polymorphism microarray analyses. Genes Chromosomes Cancer. 2010;49:309–18. doi: 10.1002/gcc.20741. [DOI] [PubMed] [Google Scholar]
- 21.(a) Kalinski T, Ropke A, Sel S, Kouznetsova I, Ropke M, Roessner A. Down-regulation of ephrin-A5, a gene product of normal cartilage, in chondrosarcoma. Hum Pathol. 2009;40:1679–85. doi: 10.1016/j.humpath.2009.03.024. S0046-8177(09)00169-5 [pii] [DOI] [PubMed] [Google Scholar]; (b) Kuang SQ, Tong WG, Yang H, Lin W, Lee MK, Fang ZH, Wei Y, Jelinek J, Issa JP, Garcia-Manero G. Genome-wide identification of aberrantly methylated promoter associated CpG islands in acute lymphocytic leukemia. Leukemia. 2008;22:1529–38. doi: 10.1038/leu.2008.130. leu2008130 [pii] [DOI] [PubMed] [Google Scholar]; (c) Shi H, Guo J, Duff DJ, Rahmatpanah F, Chitima-Matsiga R, Al-Kuhlani M, Taylor KH, Sjahputera O, Andreski M, Wooldridge JE, Caldwell CW. Discovery of novel epigenetic markers in non-Hodgkin’s lymphoma. Carcinogenesis. 2007;28:60–70. doi: 10.1093/carcin/bgl092. bgl092 [pii] [DOI] [PubMed] [Google Scholar]
- 22.(a) Richter GH, Plehm S, Fasan A, Rossler S, Unland R, Bennani-Baiti IM, Hotfilder M, Lowel D, von Luettichau I, Mossbrugger I, Quintanilla-Martinez L, Kovar H, Staege MS, Muller-Tidow C, Burdach S. EZH2 is a mediator of EWS/FLI1 driven tumor growth and metastasis blocking endothelial and neuro-ectodermal differentiation. Proc Natl Acad Sci U S A. 2009;106:5324–9. doi: 10.1073/pnas.0810759106. 0810759106 [pii] [DOI] [PMC free article] [PubMed] [Google Scholar]; (b) Zhang J, Cao W, Xu Q, Chen WT. The expression of EMP1 is downregulated in oral squamous cellcarcinoma and possibly associated with tumour metastasis. J Clin Pathol. 2011;64:25–9. doi: 10.1136/jcp.2010.082404. jcp.2010.082404 [pii] [DOI] [PubMed] [Google Scholar]
- 23.(a) Miller SJ, Lan ZD, Hardiman A, Wu J, Kordich JJ, Patmore DM, Hegde RS, Cripe TP, Cancelas JA, Collins MH, Ratner N. Inhibition of Eyes Absent Homolog 4 expression induces malignant peripheral nerve sheath tumor necrosis. Oncogene. 2010;29:368–79. doi: 10.1038/onc.2009.360. onc2009360 [pii] [DOI] [PMC free article] [PubMed] [Google Scholar]; (b) Li Y, Chen LL, Nie CJ, Zeng TT, Liu HB, Mao XY, Qin YR, Zhu YH, Fu L, Guan XY. Downregulation of RBMS3 Is Associated with Poor Prognosis in Esophageal Squamous Cell Carcinoma. Cancer Research. 2011;71:6106–6115. doi: 10.1158/0008-5472.Can-10-4291. [DOI] [PubMed] [Google Scholar]; (c) Selamat SA, Galler JS, Joshi AD, Fyfe MN, Campan M, Siegmund KD, Kerr KM, Laird-Offringa IA. DNA Methylation Changes in Atypical Adenomatous Hyperplasia, Adenocarcinoma In Situ, and Lung Adenocarcinoma. PLoS One. 2011;6 doi: 10.1371/journal.pone.0021443. [DOI] [PMC free article] [PubMed] [Google Scholar]; (d) Kim YH, Lee HC, Kim SY, Yeom YI, Ryu KJ, Min BH, Kim DH, Son HJ, Rhee PL, Kim JJ, Rhee JC, Kim HC, Chun HK, Grady WM, Kim YS. Epigenomic analysis of aberrantly methylated genes in colorectal cancer identifies genes commonly affected by epigenetic alterations. Ann Surg Oncol. 2011;18:2338–47. doi: 10.1245/s10434-011-1573-y. [DOI] [PMC free article] [PubMed] [Google Scholar]
- 24.Sato JD, Kan M. Media for Culture of Mammalian Cells Unit 1.2. Current Protocols in Cell Biology. 1998 doi: 10.1002/0471143030.cb0102s00. Core Publication. 1.2.7. [DOI] [PubMed] [Google Scholar]
- 25.Pfaffl MW. A new mathematical model for relative quantification in real-time RT-PCR. Nucleic Acids Res. 2001;29:e45. doi: 10.1093/nar/29.9.e45. [DOI] [PMC free article] [PubMed] [Google Scholar]
- 26.Bolstad BM, Irizarry RA, Astrand M, Speed TP. A comparison of normalization methods for high density oligonucleotide array data based on variance and bias. Bioinformatics. 2003;19:185–93. doi: 10.1093/bioinformatics/19.2.185. [DOI] [PubMed] [Google Scholar]
- 27.Huang DW, Sherman BT, Lempicki RA. Systematic and integrative analysis of large gene lists using DAVID bioinformatics resources. Nat Protoc. 2009;4:44–57. doi: 10.1038/nprot.2008.211. [DOI] [PubMed] [Google Scholar]
- 28.(a) Boehm JS, Hahn WC. Immortalized cells as experimental models to study cancer. Cytotechnology. 2004;45:47–59. doi: 10.1007/s10616-004-5125-1. [DOI] [PMC free article] [PubMed] [Google Scholar]; (b) Lehman TA, Modali R, Boukamp P, Stanek J, Bennett WP, Welsh JA, Metcalf RA, Stampfer MR, Fusenig N, Rogan EM, et al. p53 mutations in human immortalized epithelial cell lines. Carcinogenesis. 1993;14:833–9. doi: 10.1093/carcin/14.5.833. [DOI] [PubMed] [Google Scholar]
Associated Data
This section collects any data citations, data availability statements, or supplementary materials included in this article.