

Abstract
Objective
To advance methods for the estimation of hospital performance based upon mortality ratios.
Design
Observational study estimating trust performance in a year derived according to comparative standards from a 3-year period, accounting for patient-level case-mix and overdispersion (unexplained variability).
Participants
23 363 630 admissions to the English National Health Service (NHS) by NHS Trust.
Main outcome measures
Number of SDs (QUality and Outcomes Research Unit Measure, QUORUM banding) and comparative odds of hospital mortality difference from mean performance by trust compared for 2010/2011, 2008/2009 and 2009/2010, accounting for patient-level case-mix.
Results
The model was highly predictive of mortality (C statistic=0.93), and well calibrated by risk stratum. There was substantial overdispersion. No trusts were more than 3 SDs above the mean, and only one trust was more than 2 SDs above the mean for 2010/2011.
Conclusions
QUORUM is highly predictive of patient mortality in hospital or up to 30 days after admission. However, like the Summary Hospital Mortality Indicator (SHMI), QUORUM is subjected to considerable remaining legitimate but unexplained variation. It is unlikely that measures like QUORUM and SHMI will be useful beyond identifying a very small number of trusts as potential outliers.
Keywords: Public Health, Education & Training (See Medical Education & Training), Epidemiology
Article summary.
Article focus
The Summary Hospital Mortality Indicator (SHMI) aims to identify poorly performing hospital trusts but is limited through unexplained variability between trusts.
We aimed to develop a more efficient model with additional explanatory variables using more sophisticated statistical techniques to assess trust performance (QUality and Outcomes Research Unit Measure, QUORUM).
We assessed the performance of QUORUM and compared QUORUM with SHMI.
Key messages
QUORUM is well calibrated and strongly predicts patient mortality.
Nonetheless, QUORUM is subject to considerable unexplained variation at the trust level and neither QUORUM nor SHMI convincingly identify poorly performing trusts.
The National Health Service should investigate the usefulness of collecting more detailed clinically relevant data such as prescriptions, observations and assessments to enable improvement of the evaluation of quality of care and outcomes
Strengths and limitations of this study
QUORUM has a very high predictive value for deaths.
QUORUM, like SHMI, cannot convincingly identify poorly performing hospitals.
Mortality at an aggregate is not a suitable surrogate measure of quality.
Introduction
Methods for assessing quality of care of hospitals in the National Health Service (NHS) have been a topic of debate for many years. There has been considerable focus on mortality as a surrogate marker of the quality of care that hospitals deliver. There have been attempts to predict appropriate levels of mortality and identify hospitals that are exceeding such limits. In the UK this has involved using data derived from Hospital Episode Statistics (HES). The Hospital Standardised Mortality Ratio (HSMR)1 was used as an indicator of hospital assessment in the English NHS for several years. This measure calculated the ratio of the number of observed deaths and the number of deaths expected on the basis of a risk adjustment algorithm for each Acute Trust in England, using basic statistical methods developed in the 1980s.
The HSMR received considerable criticism, specifically about the application of death rates as a measure of overall quality of care,2 the inconsistency of its findings3 4 and the fact that the HSMR had been subject to little empirical evaluation.5 Furthermore, HSMR methodology included only 78% of all inhospital deaths, did not consider all patients’ comorbidities and did not take into account postdischarge outcomes and readmissions so that in many circumstances one patient death could be counted multiple times. This methodology was criticised as it lended itself to ‘gaming’ and more importantly there was dissatisfaction that HSMR was used commercially to judge NHS Hospitals’ performance. As a result, the NHS Medical Director recently convened a group of interested parties to develop a methodology to create a new national death statistic based on HSMR.6 This measure is known as the Summary Hospital Mortality Indicator (SHMI).7
The methods used to derive the SHMI are based upon those used for the HSMR. In order to derive the ratio of the observed-to-expected deaths, the SHMI method estimates the expected number of deaths by fitting a logistic regression model using data from each non-specialist acute NHS Trust in England, grouped by diagnostic group (using the Clinical Classification Software, CCS categories)8 and adjusted for patient age, sex, Charlson comorbidity score9 and for mode of admission (elective vs emergency). The expected number of deaths is calculated as a sum of the probability of death for all trusts based on the risk stratification algorithm and compared with the observed number of deaths for each trust. Any excess in observed versus expected deaths is taken as a marker to suggest a more in depth investigation of the hospitals quality of care delivery.
In its first iteration, the SHMI provided two different statistical indicators (PO and OD banding) to identify hospitals with performance warranting further investigation. The PO banding, based on Poisson distribution, inappropriately indicated too many trusts to be performing outside the expected range because the statistical methods did not account for the substantial unexplained variation in the statistical model, a phenomenon known as overdispersion.
Overdispersion in the SHMI is caused at least partly by inadequate case-mix adjustment where the characteristics not included in the statistical model exert an important influence on the outcome. It is well known that social deprivation affects outcome10 and we may expect that trusts with patients experiencing below average deprivation will, everything else being equal, have better outcomes than those facing higher than average deprivation. Other factors such as ethnicity, previous urgent and complex hospital admissions, comorbidities not included in the Charlson index and the time of the year when admission occurs may also be associated with the risk of death among patients admitted to hospital.11 The SHMI also does not take into account all the care information known about patients who are admitted to hospital. For example only information in the patients’ current episode of care when admitted to hospital is considered. Patients’ previous admissions and their complexity are not included, thus underestimating the risk profile. It is also subject to significant bias due to differing recording practices from hospital to hospital in the NHS, which because it is confounded with true performance (both offer competing and plausible reasons for apparently ‘poor’ performance) presents a particular challenge for the development of a standardised measure.
PO banding was abandoned in 2012, although still reported in the SHMI output, and replaced by OD banding. OD banding is based upon an approximate random effects model and makes a reasonable attempt to overcome the limitations of the error structure of the SHMI,12 albeit acting indirectly. OD banding achieves a substantial adjustment for overdispersion, and the resulting measure does not find evidence of variation between trusts at the conventional 3 SD level, thus identifying no trusts that would be conventionally considered outliers based on mortality. The NHS Information Centre uses OD banding between 2 but less than 3 SDs to define trusts with death rate which is ‘higher than expected’. However, using the threshold of less than 3 SDs will mean results reflect the natural variation (legitimate diversity caused by the play of chance) and these trusts would usually be understood to be performing within normal limits.
The aim of this study was to develop a measure of hospital mortality, QUality and Outcomes Research Unit Measure (QUORUM), which attempts to address some of the methodological limitations of the SHMI, specifically the potential inadequacies of case-mix adjustment and absence of directly estimated error structure and estimates of model uncertainty. In this manuscript we describe the development of the QUORUM measure and compare it with the SHMI. First, we develop a single statistical model of hospital mortality including a more complete set of explanatory variables to stratify risk associated with each admission, defined a priori, estimating directly the impact of hospital trust on outcome. Second, we apply robust methods to describe uncertainty associated with the estimate of performance of each trust in order to identify potential outliers (those trusts which warrant further investigation). Third we compare the output of our models with the SHMI.
Methods
We developed a generalised linear model to estimate the relationship between hospital trust and patient outcome, accounting for patient case-mix, the QUORUM model. It includes diagnostic category and hospital trust as explanatory variables and, unlike the SHMI, considers all data on outcome in a single statistical model. Models were developed based upon a prespecified statistical analysis plan.
We accessed patient data for the financial years 2005/2006 to 2010/2011 and used the most recent 3 years that is, 2008/2009 to 2010/2011 (number of hospital spells n=25 414 697) to build the QUORUM model, estimating the death rate for each trust compared with the 3 year mean value (using the ‘param=effect’ option in SAS to define the factor comparison with the overall mean of the trust-year effects). We used the 3-year data set because of substantial and unexplained reduction in reported mortality over the 3-year period, which could not plausibly be due only to differences in actual death rates. In addition, using a 3-year period to estimate the trust level effects increases substantially the number of events and thus stability of the model. In supportive analyses we analysed data from the years 2007/2008 to 2009/2010 and 2006/2007 to 2008/2009, the two previous 3-year periods. In each of these (the main analysis and the two supportive analyses) we fitted the model to the full 3 year dataset, but examined the results at the level of the trust for the most recent year in each case. This approach mirrors that taken for the SHMI. The University Hospitals Birmingham NHS Foundation Trust (UHB) institutional review board approved the study.
Datasets were constructed using a 64-bit MS SQL server 2005 on a Dell PowerEdge R610 64-bit, 64 GB, 2x Intel (R) Xeon(R) 5550@2.67 GHz, 2660 MHz 4Core(s), 8 logical server. Principal analyses were conducted using the 64-bit version of SAS (SAS Institute, Cary, North Carolina, USA, V.9.2), on a Dell PowerEdge R610 64-bit, 64 GB, 2x Intel (R) Xeon(R) 5550@2.67 GHz, 2660 MHz 4Core(s), 8 logical server.
In line with the SHMI, we defined the response variable to be mortality in hospital or up to 30 days postdischarge, unless admitted to another acute provider, and applied the analysis to the basic data structure described for SHMI.7 Mortality data were obtained from the Office of National Statistics. We fitted a generalised linear model with a logit link and binomial error, with an additive residual random effect to account for overdispersion. Explanatory variables for case-mix adjustment were selected a priori by the study group considering existing knowledge on items, and interactions, likely to be associated with mortality in admissions to the NHS, and based upon our previous experience.11 We included the independent explanatory variables: age, seasonality (count of days from the beginning of the 3-year data period), deprivation score (Index of Multiple Deprivation, IMD),13 total number of previous emergency admissions, total number of previous complex admissions, Charlson comorbidity score,9 sex, ethnicity, admission method, admission source, diagnostic group (based on aggregated CCS category),8 trust–year (identifying the patients admitted to each trust over each of the three included years), and the interaction terms age×deprivation score, age×admission source.
Missing categorical data were addressed in the model through the inclusion of an additional level for missing values. Missing continuous values were not imputed and observations with missing continuous data were not included in the analyses.
Age was centred by subtracting the median value. Non-linear variable seasonality was fitted using an 8 knot restricted cubic spline.14 Total number of previous urgent or complex admissions were included using loge(x + 1), Charlson score was transformed using loge(x+2). All non-linear transformations were identified on the basis of substantive improvement (≥4) in Akaike's Information Criterion (AIC)15 from loge transformation and then a restricted cubic spline sequentially, with only seasonality requiring a restricted cubic spline using this prespecified rubric. Overdispersion was included in the estimates of trust performance using the random effects method described in the appendix. Included explanatory variables for both the QUORUM and SHMI models are described in box 1.
Box 1. Explanatory Variables Included in SHMI and QUORUM Models.
SHMI
| Item | Coding |
|---|---|
| Age | In 5 year bands |
| Sex | Male, Female or Unknown |
| Charlson comorbidity score | Categorised into 3 groups |
| Admission method | Elective, acute or unknown |
QUORUM Model
| Item | Coding |
|---|---|
| Age | Continuous, centred on median age |
| Seasonality | Restricted cubic spline with 8 knots fitted to count of day from 1/7/2008 |
| Sex | Male, Female or Unknown |
| Index of Multiple Deprivation | Untransformed continuous score |
| Number of previous emergency admissions | transformed using loge(x+1) |
| Number of previous complex admissions | transformed using loge(x+1) |
| Charlson comorbidity score | transformed using loge(x+2) |
| Ethnicity | Categorised into Asian or Asian British, Black or Black British, Mixed, White, unknown, or other ethnic group |
| Admission method | Elective, acute or unknown |
| Admission source | Birth, home, transfer or unknown |
| Diagnostic group | CCS categories grouped into categories numbers as detailed in [Clinical Indicators Team 2011] |
| Trust year | Categorised into trust and year |
| Age*deprivation score | |
| Age*admission source |
Box 2. Outcome Measures Describing Hospital Related Mortality.
| PO Band | 3 standard deviations (3SD) from the target, corresponding to a 99.8% control limit derived from an exact Poisson distribution, abandoned in 2012 but still reported7 |
| OD Band | 2 standard deviations (2SD) from the target, corresponding to a 95% control limit derived from a random effects model applying a 10% trim from the top and bottom of all providers7 |
| Q Band | Number of standard errors from mean, accounting for overdispersion at the trust level, derived from QUORUM Model |
In order to identify trusts with worse than average performance according to the QUORUM model we calculated the number of SEs departure from the overall case-mix adjusted trust average for each trust having accounted for overdispersion (Q band). We compared the Q band with OD banding calculated for SHMI.
The SHMI accounts indirectly for overdispersion derived from a random effects model, and applies a 10% trim from the best and worst performing trusts in an attempt to separate ‘normal’ variation from ‘extreme’ variation and thus avoid the situation where outlier trusts which should properly be considered as belonging to a different distribution contribute to the calculation of the SDs used for banding. However, truncating the distribution of trust performance in this way will provide SDs (and thus bandings) which are too small and risks (wrongly) identifying trusts as outliers. The appropriate course of action in these circumstances is to inflate the SD and thus bandings by an amount which represents what the SD would have been for the whole population of trusts if the top and bottom 10% trimmed observations followed the normal distribution described by 80% of trusts included. The choice of level of trim is somewhat arbitrary, although it should be derived from the expected number of extreme cases. Our advisory group believed ±5% to be more appropriate given the expected number of poorly performing trusts. We also considered it inappropriate to base the bandings only on the included trusts, and thus reflated the SEs as described above.12
Results
Of the 25 414 697 patient episodes in the 2008/2009 to 2010/2011 admissions dataset 23 363 630 had complete information (8.1% missing). There were 822 805 deaths in hospital or within 30 days of discharge. For the year 2010/2011, the median trust mean Charlson index was 1.22 (range 1.15–1.29). Similarly, the median trust mean age was 44 (range 33–63). The median trust IMD was 22.74 (range 9.16–43.65). The median number of previous complex admissions per trust was 0.04 (range 0.02–0.12), and the median number of previous emergency admissions per trust was 0.66 (range 0.47–0.90). The trust with the lowest crude death rate was Chelsea and Westminster Hospital NHS Foundation Trust, with 11.6 deaths per 1000 admissions, while the trust with the highest crude death rate was Trafford Healthcare NHS Trust with 54.8 deaths/1000 admissions. The characteristics of the included trusts for the year 2010/2011 and their SHMI scores and bands are described in online supplementary table S1.
The 10 patient cohorts, defined by the CCS categories with the highest count of deaths collectively accounted for 44% of deaths, and were: septicaemia (except in labour) (2.6%); shock (2.6%); cancer of bronchus, lung (3.3%); acute myocardial infarction (2.7%); congestive heart failure, non-hypertensive (3.8%); acute cerebrovascular disease (6.9%); pneumonia (except that caused by tuberculosis or sexually transmitted disease) (13.1%); acute bronchitis (2.5%); chronic obstructive pulmonary disease and bronchiectasis (3.3%); urinary tract infections (3.2%) and fracture of neck of femur (hip) (2.5%).
Age, seasonality, deprivation score (IMD), total number of emergency admissions, total number of complex admissions, sex, ethnicity, admission method, admission source, diagnostic group (CCS category), trust–year and the interaction terms age ( *deprivation score, age ( *admission source were all highly statistically significant predictors of death within 30 days of admission to hospital or within 30 days of discharge albeit with interesting differences in the statistical strength of individual items (see table 1). In table 2, we present the observed versus expected number of deaths for the QUORUM model by risk strata which demonstrates a high level of prediction of the model across the range of risk strata. In online supplementary table S4 we present Q banding for each of 146 trusts with available data for the financial year 2010/2011 (where the model was built on the 3-year period 2008/2009 to 2010/2011), and for the two prior 3-year periods. The C statistic for QUORUM is 0.93 for the 2008/2009 to 2010/2011 time period.
Table 1.
QUORUM Model
| Effect | DF | χ2* |
|---|---|---|
| Age† | 1 | 622.0 |
| Seasonality‡ | 7 | 1207.8 |
| Index of multiple deprivation (IMD) | 1 | 757.5 |
| Number of previous emergency admissions§ | 1 | 307.3 |
| Number of previous complex admissions§ | 1 | 8585.5 |
| Charlson score¶ | 1 | 111796.0 |
| Sex | 2 | 231.9 |
| Ethnicity | 5 | 4226.8 |
| Admission method | 2 | 88638.7 |
| Admission source | 3 | 3348.6 |
| Clinical Classification Category | 139 | 605564.0 |
| Trust–year | 441 | 11072.6 |
| Age×IMD | 1 | 714.8 |
| Age×admission source | 3 | 2261.8 |
*All p<0.0001.
†Centred on median.
‡8 knot restricted cubic spline.
§loge(x+1).
¶loge(x+2).
DF, degrees of freedom.
Table 2.
Partition into tenths of observed versus expected deaths
| Group | Total | Observed | Expected |
|---|---|---|---|
| 1 | 2294980 | 108 | 74.63 |
| 2 | 2336156 | 162 | 171.87 |
| 3 | 2338189 | 746 | 1139.86 |
| 4 | 2335659 | 1522 | 2645.24 |
| 5 | 2336384 | 3497 | 5266.39 |
| 6 | 2336445 | 8123 | 10842.63 |
| 7 | 2336394 | 20523 | 24778.44 |
| 8 | 2336395 | 57770 | 58772 |
| 9 | 2336357 | 157250 | 143658.7 |
| 10 | 2376671 | 573104 | 575444.3 |
The QUORUM values (eg, see online supplementary table S4 QUORUM OR values×100) for each trust differ quite substantially from the SHMI (see online supplementary table S1), with a median ratio of ORs difference of 2.1%, range −12.5% to 34.1%, differences which may be attributable to the additional explanatory variables included in the model and the differing model structures.
However, in spite of the added predictive variables, overdispersion (unexplained variation) remains a major feature, with the overdispersion corrected SE for the QUORUM model being on average 3.7 times the size of the uncorrected value (ie, the value not accounting for overdispersion).
No trusts were identified to be at least 3 QUORUM SEs (Q band) above the mean (see supplementary table S4), and only one trust was more than 2 SEs above the mean (Q band). In both of the previous 3-year periods analysed, only one trust (Basildon and Thurrock University Hospitals NHS Foundation Trust) was more than 3 SEs above the mean in overall mortality.
When we addressed the potential effect of outlier trusts on the width of the SEs of the model and thus the size of the Q band categories) through trimming excess mortality trusts at ±5%, and inflating the resulting SEs to allow for truncation of the normal distribution we found no qualitatively important difference in the number of trusts identified as outliers.
Discussion
We have developed a new measure (QUORUM), which directly estimates the performance of hospital trusts using all-cause mortality (in hospital or within 30 days of hospital discharge), from individual patient data, as an alternative to the recently proposed SHMI. QUORUM undertakes a more complete adjustment for case-mix and avoids several of the pitfalls encountered by the SHMI. Our model is accurate and has a good calibration for different strata of risk. Direct comparison with SHMI was not possible due to differences in construction of this model. There are myriad potential modelling strategies, but QUORUM was developed from a prespecified statistical analysis plan developed by the multidisciplinary research team in order to avoid bias. Despite its accuracy, QUORUM does not identify hospitals with mortality outliers when using the conventional 3 SDs from the mean as a threshold. It is possible that once a robust case-mix adjustment is applied, such as the one used by QUORUM, there is little variation in hospital outcomes and the old HSMR methodology showed differences amplified by insufficient risk adjustment and inadequate handling of overdispersion (unexplained variation). However, we might reasonably expect to see some variation in outcomes in an organisation such as the UK NHS properly attributable to the performance of NHS Trusts, and if this is the case our findings question whether an approach using this methodology may be used to assess overall hospital quality of care.
Assessing hospital performance with a single surrogate of mortality has several limitations. A surrogate measure may be a composite of areas where an institution has poor performance and areas where the performance is excellent. The surrogate computation could show the institution performing within accepted limits, while masking clinical areas of poor performance. It may be more appropriate to focus on specific indicators of performance in important areas, such as that promoted by the NHS Quality Outcomes Framework,16 and not attempt an overall metric for performance in all clinical areas.
Furthermore, using overall hospital statistics does not provide information on the quality of the individual services, a measure possibly of more interest to patients, healthcare commissioners and regulators as findings relating to specific services may be more amenable to remedial action. Furthermore, while early mortality is an important outcome measure, modern healthcare systems should measure the effectiveness and complications of the health interventions that they provide. Finally, the outcomes of the provision of care in Acute Trusts should be put in the context of the out-of hospital primary and secondary care services and markers for whole pathways of care would be of considerable interest.
When first developed, the HSMR represented the limit of what was achievable computationally at that time.1 The approach of fitting separate models for each diagnostic category and estimating the effects of hospital trusts was a practical solution to this circumstance. However, this approach has a range of substantive limitations as we discussed previously. Progress in computational power has enabled these significant limitations to be addressed making possible direct estimation of the effects of hospital trusts and the appropriate estimation of uncertainty and thus identification of outliers.
The simple statistical model fitted for the SHMI, which includes only age, clinical group, type of admission method and comorbidity index, does not account for many potentially important determinants of patient outcome. Variation in these measures is thus attributed to the trust contributing to the observed variation in scores between trusts and the unexplained differences (overdispersion). Thus, in the SHMI, the trust facing the lowest social deprivation, Frimley Park Hospital NHS Foundation Trust with an average IMD13 score for patients admitted during the 3 years 2008/2009 to 2010/2011 of 9.2 is implicitly judged by the same standards as the trust with the most deprived caseload, the Royal Liverpool and Broadgreen University Hospitals NHS Trust with an average IMD score of 43.7 for patients admitted in the same time period.
The OD banding calculated for the SHMI represents a serious attempt to overcome the limitations of the modelling approach to provide a valid estimate of uncertainty and thus appropriate identification of outliers. However, it is hampered by the inadequate case-mix adjustment included in SHMI, and the trimming of the SE distribution without reflation according to normal distribution which leads to SEs which are too small. Including a more coherent model structure and additional case-mix adjustment in the QUORUM, while achieving a very high C statistic (0.93), did not result in the identification of outlier NHS Trusts. There was, however, substantial overdispersion in this model at the trust level. We believe that the additive random effects model that we included in QUORUM represents a methodological advance on the SHMI, incorporating the unexplained variability at the trust level in the SEs in a manner somewhat analogous to that used by random effects meta-analysis. However, this advance is also the key to the major limitation of the QUORUM approach. When unexplained, extra binomial, between trust variability is appropriately accounted for since there are no remaining differences between trusts for the outcome. In other words, QUORUM is overwhelmed by variability that it simply cannot explain.
We observed a substantial change in mortality among patients who had been admitted to hospital over the periods included in our study. In the 3 years from 2007/2008 to 2010/2011 we observed a 9% reduction in all-cause mortality among patients who had been admitted to hospital, a difference of a magnitude which cannot wholly be explained by improvements in patient care. We are aware that during this period some trusts have made changes to patient pathways and to the way data are acquired. In particular, where trusts moved activity for emergency ambulatory care from inpatient to outpatient activity this will have led to reduction in apparent mortality among outpatients as deaths occurring in emergency ambulatory care will not now be included in our analyses. Such changes may have a substantial effect upon reported death rates regardless of any actual changes in patient outcome. Clearly, changes like these can mask the true relationship between trusts and outcome, particularly where they occur at different time periods, and there is no guarantee that one will be aware of all such effects in a complex dataset such as HES. This possibility goes some way to explaining the residual variation in our current model, while any future ‘hidden’ differences of a similar nature will result in additional overdispersion, adding uncertainty to the effects of trust and making true differences yet more difficult to identify.
Both SHMI and the QUORUM measures have evolved the development of mortality measures by measuring outcomes within a hospital and within the community. This method of linking data at the patient level allows the indicator to have more of a robust overview and is not reliant on a single type of data submitted by hospitals for payment purposes. In order to improve the accuracy of calculation of quality of care in hospitals and associated outcomes for patients, much greater variety and depth of data are required to be collected in a formal, standardised way, by all sections of care provision. This should be made uniformly available for use and assessment. Types of relevant data include electronic prescription, laboratory test outputs, general practice record data and incidents linked to peripheral electronic health records. Linkage of these information sources will allow clinicians, researchers and service members a more refined view of inequality of outcomes. Furthermore, future research should focus on developing measures for the individual clinical services offered by the individual trusts and measures of whole care pathways for individual health economies.
Conclusion
We have developed QUORUM to estimate excess mortality at the trust level. QUORUM is highly predictive of patient mortality in hospital or up to 30 days after admission. QUORUM accounts directly for overdispersion (otherwise unexplained variation in patient outcome) and provides estimates of trust performance over a 3-year period. However, the overdispersion that remains after fitting our sophisticated statistical model is substantial and overwhelming. In the financial year 2010–2011 no trusts were found to be outliers at the conventional level of statistical significance, and in the previous two periods, only one trust was observed to be an outlier. Owing to legitimate but unexplained variation, it is unlikely that measures like QUORUM and SHMI will be useful beyond identifying a very small number of trusts as potential outliers for a period with values more than 3 SDs above the mean. Like the SHMI, our attempts to advance the methodology remain challenged by substantial overdispersion which, when accounted for in the mixed effects model, result in no trusts being identified as outliers in 2010/2011. There is no sound methodological basis for the use of values between 2 and 3 SDs of the overall mean as markers of poor performance. In our view future developments should concentrate upon driving healthcare providers to collect more clinically relevant data centrally, for example Scottish Early Warning System (SEWS) (early warning scores), and prescribing and the derivation of much more detailed linked patient datasets. This may then be used to explore quality within focused clinical areas rather than averaging across multifarious service provision.
Supplementary Material
Appendix: extra binomial variability
In binomial models the assumption of independence of each subject in the model can be violated, where subjects sharing common characteristics are clustered within hierarchical structures. Failing to account for this extra binomial variability, or overdispersion, will lead to SEs, which are too small and thus corresponding CIs that are too narrow. Quasi-likelihood methods, which inflate the SEs from the model by a scale factor, represent one possible solution. However, where there are unequal numbers of observations within a cluster across the stratum of interest, and the additional component of variance is most naturally regarded as additive rather than multiplicative, the adjustment they make is inappropriate. For such a situation the methods described by Williams17 should work well, and these have been implemented in SAS (SAS V.9.2, SAS Institute, Cary, North Carolina, USA) for data in events/trials format. We have extended this approach to enable the use of individual subject data in the large sample size situation, using the asymptotic distribution of differences in the deviance as the basis for estimation of overdispersion. (Here we are using the term ‘deviance’ in the common sense to mean −2 times the log likelihood ratio of the current model compared with the saturated model.) Specifically, we assessed the level of extra binomial variability or overdispersion in our model due to trust and year by examining the difference in the deviance for the full model and the model with trust–year omitted. If  is the deviance for the full model,
  is the deviance for the model with trust–year omitted, K is the number of levels for trust–year and W is the average overall trust–year combinations of the reciprocals of binomial variance (in other words, W is the average of the fixed-effects weights) then the overdispersion parameter
  is estimated by

There is a slight complication here in that the variance due to binomial sampling variation at the level of the trust and year is affected by the fact that the risks for individual patients vary. However, this variation—referred to below as γ—is easily estimated using the variance of the fitted values from the model, and an approximate adjustment is also simple:
Suppose R is the total number of events observed in N Bernoulli trials, where the average probability (overall N trials) of an event is π, but where the individual probabilities—{pi} say—vary over trials (due here to case-mix within provider) with variance γ. Then we have directly
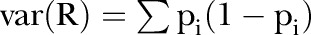
and also
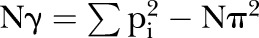
therefore
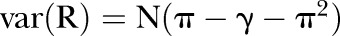
furthermore, (remembering that we are working on the logit scale, and approximating this through a Taylor expansion in R), the following holds:

so finally

The reciprocal of this gives the set of weights wi (where i indexes the set of trust–year combinations) and the mean of wi gives W in the first formula above.
Strictly speaking, a more accurate formula for estimating φ is given by replacing W with
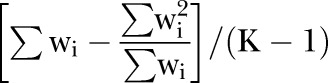
However, in practice, the difference is very small.
Finally, an adjusted SE for trust is obtained by calculating
 .
.
Footnotes
Contributors: NF contributed to statistical design and analysis, interpretation of the results, wrote the first draft of the paper and reviewed subsequent drafts of the paper. MR and JW contributed to statistical design and analysis, interpretation of the results and reviewed drafts of the paper. DR contributed to conceptualisation of the research question, data access and acquisition, design and interpretation of the results and reviewed drafts of the paper. SK and PS contributed to data access and acquisition, design and interpretation of the results and reviewed drafts of the paper. DP contributed to conceptualisation of the research question, design and interpretation of the results and reviewed drafts of the paper. NF is the guarantor.
Funding: This research received no specific grant from any funding agency in the public, commercial or not-for-profit sectors.
Competing interests: None.
Ethics approval: UHB review Board.
Provenance and peer review: Not commissioned; externally peer reviewed.
Data sharing statement: No additional data are available.
References
- 1.Jarman B, Gault S, Alves B, et al. Explaining differences in English hospital death rates using routinely collected data. BMJ 1999;318:1515–20 [DOI] [PMC free article] [PubMed] [Google Scholar]
- 2.Lilford R, Pronovost P. Using hospital mortality rates to judge hospital performance: a bad idea that just won't go away. BMJ 2010;340:c2016. [DOI] [PubMed] [Google Scholar]
- 3.Hawkes N. Hospital performance: patient coding and the ratings game. BMJ 2010;340:c2153. [DOI] [PubMed] [Google Scholar]
- 4.Shahian DM, Wolf RE, Iezzoni LI, et al. Variability in the measurement of hospital-wide mortality rates. N Engl J Med 2010;363:2530–9 [DOI] [PubMed] [Google Scholar]
- 5.Black N. Assessing the quality of hospitals: hospital standardised mortality ratios should be abandoned. BMJ 2010;340:c2066. [DOI] [PubMed] [Google Scholar]
- 6.Campbell MJ, Jacques RM, Fotheringham J, et al. Developing a summary hospital mortality index: retrospective analysis in English hospitals over five years. BMJ 2012;344:e1001. [DOI] [PMC free article] [PubMed] [Google Scholar]
- 7.Clinical Indicators Team Indicator specification: summary hospital level mortality indicator, The Information Centre for Health and Social Care London, UK: Department of Health, 2012 [Google Scholar]
- 8.Clinical Classifications Software for ICD-10 Data: 2003 Software and User's Guide. January 2003. Agency for Healthcare Research and Quality, Rockville, MD. http://www.ahrq.gov/data/hcup/icd10usrgd.htm (accessed 26 May 2010) [Google Scholar]
- 9.Charlson ME, Pompei P, Ales KL, et al. A new method of classifying prognostic comorbidity in longitudinal studies: development and validation. J Chronic Dis 1987;40:373–83 [DOI] [PubMed] [Google Scholar]
- 10.Pagano D, Freemantle N, Bridgewater B, et al. Social deprivation reduces the prognostic benefits of cardiac surgery: an analysis of 44,902 patients from 5 hospitals over 10 years: an observational study. BMJ 2009;338:b902. [DOI] [PMC free article] [PubMed] [Google Scholar]
- 11.Freemantle N, Richardson M, Wood J, et al. Weekend hospitalization and additional risk of death: an analysis of inpatient data. J R Soc Med 2012;105:74–84 [DOI] [PMC free article] [PubMed] [Google Scholar]
- 12.Spiegelhalter DJ. Funnel plots for comparing institutional performance. Stat Med 2005;24:1185–202 [DOI] [PubMed] [Google Scholar]
- 13.Noble M, Wright G, Dibben C, et al. Indices of deprivation 2004. Report to the Office of the Deputy Prime Minister London: Neighbourhood Renewal Unit, 2004 [Google Scholar]
- 14.Harrell FE, Lee KL, Mark DB. Multivariable prognostic models: issues in developing models, evaluating assumptions and adequacy, and measuring and reducing errors. Stat Med 1996;15:361–87 [DOI] [PubMed] [Google Scholar]
- 15.Akaike H. A new look at the statistical model identification. IEEE Trans Autom Control 1974;19:716–23 [Google Scholar]
- 16.Quality Outcomes Framework. Information Centre. http://www.ic.nhs.uk/statistics-and-data-collections/audits-and-performance/the-quality-and-outcomes-framework (accessed 9 Aug 2012) [Google Scholar]
- 17.Williams DA. Extra-binomial variation in logistic linear models. Appl Stat 1982;31:144–8 [Google Scholar]
Associated Data
This section collects any data citations, data availability statements, or supplementary materials included in this article.