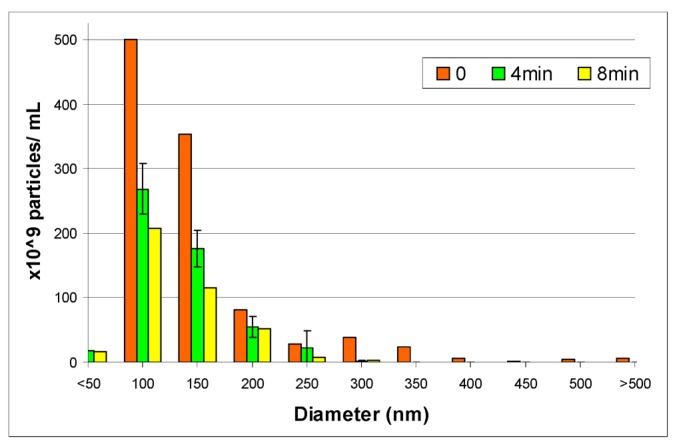
Figure 13.
Results from a Nanosight LM10-HS Study of Liposome Number and Size Distribution Under Applied Ultrasound: The sample corresponds to the liquid-disordered sample of Figure 12. Time refers to ultrasound (20 kHz, continuous wave) exposure time, where 0 denotes the initial distribution. The overall reduction in the size distribution, which indicates a loss of particles, is evidence of ultrasound-induced vesicle destruction and is consistent with mechanism (E) in Figure 10.

