

Abstract
The present study evaluated the potential clinicopathologic significance of elevated microsatellite alteration at selected tetra-nucleotide (EMAST) in non-small cell lung cancer (NSCLC). Sixty-five NSCLCs (19 squamous cell carcinomas, 39 adenocarcinomas, one adenosquamous cell carcinoma, and 6 large cell carcinomas) were examined for EMAST in the ten selected tetra-nucleotide markers. Traditional microsatellite instability (MSI) in the five mono- or di-nucleotide markers of the Bethesda panel was also examined, and compared with EMAST. The incidence of EMAST was higher than that of traditional MSI, as 64.6% (42/65) and 12.3% (8/65) tumors respectively exhibited EMAST and traditional MSI in at least one marker. EMAST and traditional MSI appear to occur independently, as no significant association in their incidence was found (Fisher’s exact test, P = 0.146). Subjects who exhibited EMAST in two or more markers had a significantly higher incidence of history of other malignant neoplasms (42.9% [9/21]), compared to those with less than two markers (16.3% [7/43] (Chi-square test, P = 0.021)). Taken together, impairment of molecular machinery for maintaining stable replication of the tetra-nucleotide-repeating regions, which would differ from machinery for mono- or di-nucleotide-repeating regions, may elevate susceptibility to NSCLCs and certain neoplastic diseases. Elucidation of the potential molecular mechanism of EMAST is expected to lead to a discovery of a novel genetic background determining susceptibility to NSCLC and other multiple neoplasms. This is the first report describing a clinicopathologic significance of EMAST in NSCLC.
Keywords: Non-small cell lung cancer, elevated microsatellite alteration at selected tetra-nucleotide, microsatellite instability, chromosomal instability, loss of heterozygosity, multiple malignant neoplasms
Introduction
Lung cancer is one of the most common causes of cancer-related death in the developed world [1,2]. Even among patients with early stage diseases, a substantial proportion die due to recurrent disease (the 5-year survival rate is 66.0–83.9% in stage IA and 53.0–66.3% in stage IB for non-small cell lung cancer [NSCLC]) [3-5]. Understanding the biological properties and molecular mechanism of NSCLCs is important for the development of a novel therapeutic strategy.
Genetic instability is one of the most essential properties of malignant neoplasm [7-12]. Two different types of genetic instability, microsatellite instability (MSI) and chromosomal instability (CSI), have been well investigated in a variety of malignant neoplasms [8-10,12-14]. While some types of malignancies preferentially exhibit the MSI phenotype, others preferentially exhibit the CSI phenotype [9-11]. For hereditary non-polyposis colorectal cancer (HNPCC), MSI due to germ line alterations of mismatch repair genes (i.e., hMLH1, hMSH2 and hMSH6) is an essential molecular basis of its development [10,11,14,15,32]. On the other hand, for NSCLC, CSI plays an important role in carcinogenesis, as homozygous/heterozygous deletions in certain chromosomal loci frequently occur [9,10,13,17-19]. Participation of MSI in carcinogenesis of the lung has been negatively interpreted based on the results from studies analyzing conventional mono- or di-nucleotide-repeating microsatellite regions (Bethesda panel) [20]. Interestingly, several studies of tetra-nucleotide-repeating microsatellite regions have demonstrated frequent MSI in NSCLC, and have proposed the term, “elevated microsatellite alteration at selected tetranucleotide (EMAST)” [21-23]. However, the participation of MSI in NSCLC remains controversial [13,16-26]. Moreover, these findings imply that the underlying mechanism maintaining replication stability of mono- or di-nucleotide-repeating regions is different from that of tetra-nucleotiderepeating regions [6,23]. The potential alterations in novel molecules other than known mismatch repair factors (i.e., hMLH1, hMSH2 and hMSH6) could be involved in the occurrence of EMAST and promote carcinogenesis of NSCLC. Similar to traditional MSI in mono- or di-nucleotide-repeating regions, EMAST in the unsettled tetra-nucleotiderepeating regions has been evaluated among individual studies [16,21-23,26-29]. A recent study proposed ten candidate regions as universal markers for assessment of EMAST [6]. To our knowledge, EMAST in NSCLC in these ten markers has yet to be investigated.
The present study examined 65 NSCLCs for EMAST in the ten markers and analyzed the potential associations between EMAST and a series of clinicopathologic parameters.
Materials and methods
Tumor samples
Sixty-five NSCLCs (19 squamous cell carcinomas [SQCs], 39 adenocarcinomas [ADCs], one adenosquamous cell carcinomas, 6 large cell carcinomas [LCCs]) without lymph node metastasis and preoperative chemotherapy or radiation therapy were investigated. Characteristics of patients are summarized in Table 1. All tumors were re-evaluated and diagnosed by board-certified pathologists according to UICC classification (7th edition) of tumors [30] and World Health Organization Classification of Tumours of the lung. The study plan was approved by the ethics committee of Yokohama City University Graduate School of Medicine. Inclusive informed consent for research use was obtained from all patients providing materials.
Table 1.
Essential information for cases of NSCLCs examined
| Sex | ||
| Male | 46 | |
| Female | 19 | |
| Age (year) | mean±SD (range) | 67±10 (40-82) |
| Smoking history | ||
| Smoker | 52 | |
| Non-smoker | 13 | |
| Brinkmann index | mean±SD (range) | 810 ± 943.2 (0-5000) |
| Medical history of malignant neoplasm | ||
| Present | 16 | |
| Absent | 48 | |
| Unknown | 1 | |
| Family history of malignant neoplasm | ||
| Present | 30 | |
| Absent | 29 | |
| Unknown | 6 | |
| Histological subtype | ||
| SQC | 19 | |
| ADC | 39 | |
| ASC | 1 | |
| LCC | 6 | |
| pT factor | ||
| pT1 | 37 | |
| pT2 | 26 | |
| pT3 | 2 | |
| Extent of operation | ||
| Lobectomy | 43 | |
| Segmentectomy | 12 | |
| Partial resection | 10 |
NSCLC, non-small cell lung cancer; SQC, Squamons cell lung carcinoma; ADC, Adenocarcinoma; ASC, Adenosquamous carcinoma; LCC, Large cell carcinoma.
Laser-capture micro-dissection of neoplastic cells and DNA extraction
Neoplastic cells were isolated from paraffinembedded tissue sections using a laser capture micro-dissection system (PALM MCB, Bernried, Germany). Paired reference DNA was extracted from non-tumoral lung tissue or the regional lymph nodes using the High Pure PCR Template Preparation Kit (Roche GmbH, Mannheim, Germany) according to the manufacturer’s instructions.
Analysis of alteration in selected microsatellite markers
The ten selected tetra-nucleotide-repeating markers proposed by the previous study (D8S321, D20S82, UT5037, D8S348, D2S443, D21S1436, D9S747, D9S303, D9S304, and MYCL1) [6] and the Bethesda panel (D5S346, BAT25, BAT26, D2S123, and D17S250) [15] were examined. Primers used and appropriate annealing temperatures are listed in Table 2. PCR products were separated by polyacrylamide gel electrophoresis and visualized by silver stain [8]. MSI was judged based on a shift in extra bands in the tumor sample, which was not found in non-tumoral samples (Figure 1A). Among the cases with different repeat lengths in the microsatellite regions (informative cases), loss or unequivocally lower signal in either of the two bands in the tumor sample was judged as loss of heterozygosity (LOH) (Figure 1A).
Table 2.
Information for microsatellite markers and PCR-primers used
| Marker | Chromosomal location | Primer sequence (5’-3’) | Annealing temperature (°C) | Size of PCR-product (bp) |
|---|---|---|---|---|
| Selected tetra-nucleotide makers | ||||
| D8S321 | Chromosome 8 | S:GATGAAAGAATGATAGATTACAG | 58 | Approx. 245 |
| A:ATCTTCTCATGCCATATCTGC | ||||
| D20S82 | 20p12.3 | S:GCCTTGATCACACCACTACA | 61 | 246-270 |
| A:GTGGTCACTAAAGTTTCTGCT | ||||
| UT5037 | Chromosome 8 | S:TTCCTGTGAACCATTAGGTCA | 60 | Approx. 145 |
| A:GGGAGACAGAGCAAGACTC | ||||
| D8S348 | 8q24.13-8q24.3 | S:ACCGACAGACTCTTGCCTCCAAA | 58 | Approx. 408 |
| A:TCACTCAGCTCCCATAACTTGGCAT | ||||
| D2S443 | 2p13.2-2p13.1 | S:GAGAGGGCAAGACTTGGAAG | 58 | Approx. 251 |
| A:ATGGAAGAGCGTTCTAAAACA | ||||
| D21S1436 | 21q21.1 | S:AGGAAAGAGAAAGAAAGGAAGG | 58 | Approx. 178 |
| A:TATATGATGAAAGTATATTGGGGG | ||||
| D9S747 | 9q32 | S:GCCATTATTGACTCTGGAAAAGAC | 56 | 182-202 |
| A:CAGGCTCTCAAAATATGAACAAAAT | ||||
| D9S303 | 9q21.32 | S:CAACAAAGCAAGATCCCTTC | 55 | Approx. 163 |
| A:TAGGTACTTGGAAACTCTTGGC | ||||
| D9S304 | 9q21 | S:GTGCACCTCTACACCCAGAC | 60 | Approx. 165 |
| A:TGTGCCCACACACATCTATC | ||||
| MYCL1 | 1p34.1 | S:TGGCGAGACTCCATCAAAG | 53 | 140-209 |
| A:CTTTTTAAGCTGCAACAATTTC | ||||
| Bethesda Panel markers | ||||
| D5S346 | 5q21-22 | S:ACTCACTCTAGTGATAAATCGGG | 55 | 96-122 |
| A:AGCAGATAAGACAGTATTACTAGTT | ||||
| BAT25 | 4q12 | S:TCGCCTCCAAGAATGTAAGT | 58 | Approx. 125 |
| A:TCTGCATTTTAACTATGGCTC | ||||
| BAT26 | 2p16 | S:TGACTACTTTTGACTTCAGCC | 58 | Approx. 125 |
| A:AACCATTCAACATTTTTAACCC | ||||
| D2S123 | 2p16 | S:AAACAGGATGCCTGCCTTTA | 60 | 197-227 |
| A:GGACTTTCCACCTATGGGAC | ||||
| D17S250 | 17q11.2-17q12 | S:GGAAGAATCAAATAGACAA | 52 | 151-169 |
| A:GCTGGCCATATATATATTTAAACC | ||||
| p53 loss of heterozygosity marker | ||||
| TP53alu | 17p.13.1 | S:TCGAGGAGGTTGCAGTAAGCGGA | 55 | Approx. 150 |
| A:AACAGCTCCTTTAATGGCAG | ||||
Approx., approxymetly.
Figure 1.
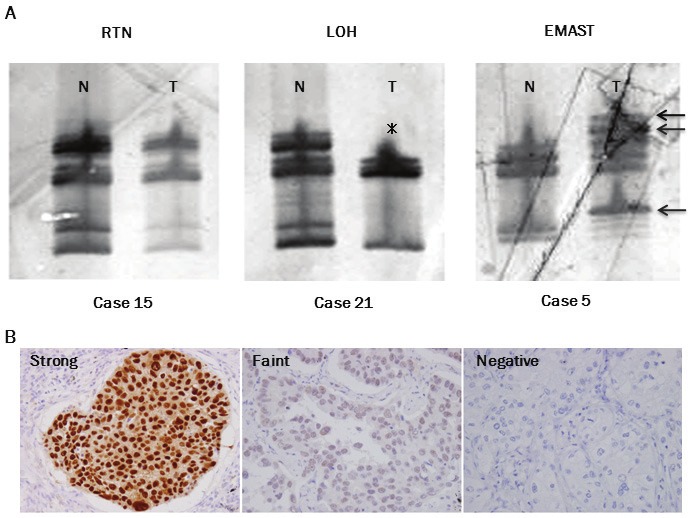
A. Representative results of alterations at a selected tetra-nucleotide repeating region (D9S303). PCR products were separated by polyacrylamide gel electrophoresis and visualized by silver stain. Case 5 (right panel) exhibits elevated microsatellite alternations at selected tetra-nucleotide (EMAST), as shifted bands (arrows) appear in the tumor sample (T) compared to non-tumor sample (N). Case 21 (center panel) exhibits loss of heterozygosity (LOH), as the slower migrating band (asterisk) of the two bands in the non-tumor sample (N) disappeared in the tumor sample (T). Case 15 (left panel) exhibits no alteration (RTN: retain) and serves as a reference. B. Representative results of immunohistochemistry for p53. Examples of strong (left panel), faint (center panel), and negative (right panel) expression are shown. Magnification: x400.
Analysis of LOH in p53 gene locus
The deletion of the p53 gene locus on chromosome 17p13.1 was also examined using a microsatellite marker (TP53alu) [33]. Primers used and appropriate annealing temperatures are listed in Table 2. LOH was judged in the same manner as described above.
Histopathology
The largest tumor sections were cut from formalin-fixed, paraffin-embedded tissue blocks. The sections were deparaffinized, rehydrated, and incubated with 3% hydrogen peroxide, followed by blocking of endogenous peroxidase activity and non-immunospecific protein binding with 5% goat serum. The sections were boiled in citrate buffer (0.01 M, pH 6.0) for 15 min to retrieve masked epitopes and then incubated with a primary antibody against p53 (DO7, Dako, Ely, UK), Ki-67 (MIB1, Dako), factor VIII-related antigen (F8/86, Dako), and D2-40 (D2-40, Becton Dickinson, San Joes, CA). Immunoreactivity was visualized using an Envision detection system (Dako), and the nuclei were counterstained with hematoxylin. Intensity of immunohistochemical signals of p53 protein was classified into negative (score 0), faint (score 1), and strong (score 2). Strong intensity was defined as an obviously intense signal in the nuclei (Figure 1B). Faint intensity was defined as unequivocally less signal, but not negative, in comparison to strong intensity (Figure 1B). The p53 expression level was calculated as a percentile of the averaged intensity level, as described elsewhere [34]. Values of less than or equal to the median value (1.13%) were classified as low expressers and values of more than 1.13% were classified as high expressers. Labeling index of MIB1 was calculated as the proportion of cells with positive nuclei by counting 500–1000 cancer cells. The Ki-67 labeling indices of ≤10% and >10% were classified as low and high levels, according to the results of our previous study [35]. Vascular and lymphatic invasion was evaluated by elastica van Gieson stain, D2-40 Stain and factor VIII-related antigen stain.
Statistical analysis
The possible associations between EMAST/LOH status and various clinicopathologic parameters were analyzed with Fisher’s exact test or Chi-square test. The post-operative disease-free span was defined as the period from the date of surgery to the date when the recurrence of disease was diagnosed. An observation was censored at the last follow-up if the patient was alive or had died of a cause other than lung cancer. The differences in overall survival rate and in disease-free survival rate were analyzed using log-rank test. P values less than 0.05 were considered significant. All statistical analyses were performed using SPSS software (SPSS for Windows Version 11.0 J; SPSS; Chicago, IL).
Results
Instability in selected tetra-nucleotide-repeats and Bethesda panel
Among the 65 tumors examined, 56 could be examined for alteration in all the microsatellite regions. The remaining 9 could not be examined, 7 in one marker (D2S443, D8S348, D9S303, or D21S1436) and 2 in two markers (D2S443 and D9S304, D8S348 and D9S304). EMAST in either of the ten tetra-nucleotide-repeating regions was found in 64.6% (42/65) of tumors (Figure 2A): 26 of 39 (66.7%) ADCs, 14 of 19 (73.7%) SQCs, and 2 of 6 (33.3%) LCCs. Among the ten regions, EMAST tended to preferentially occur at D8S321 (12/65, 18.5%), D2S443 (11/65, 16.9%), D9S303 (9/65, 13.8%), D9S304 (9/65, 13.8%), D20S82 (8/65, 12.3%), D21S1436 (8/65, 12.3%), and D8S348 (7/65, 10.8%) than at UT5037 (3/65, 4.6%), D9S747 (5/65, 7.7%), and MYCL1 (1/65, 1.5%) (Figure 3A).
Figure 2.
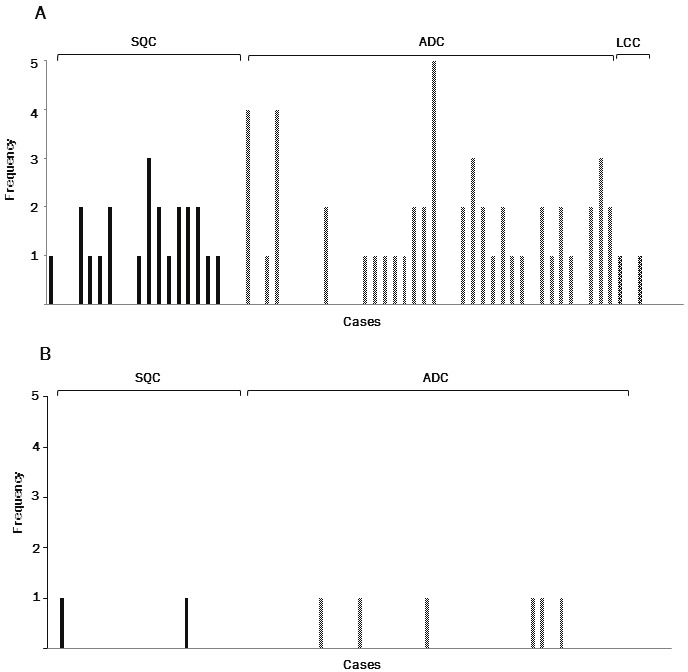
A. Frequency of EMAST (the number of regions where instability occurred among the ten selected tetranucleotide- repeating regions) in each case. B. Frequency of traditional microsatellite instability (MSI) (number of regions where instability occurred among the five regions of the Bethesda panel) in each case. SQC, squamous cell carcinoma; ADC, adenocarcinoma; LCC, large cell carcinoma.
Figure 3.
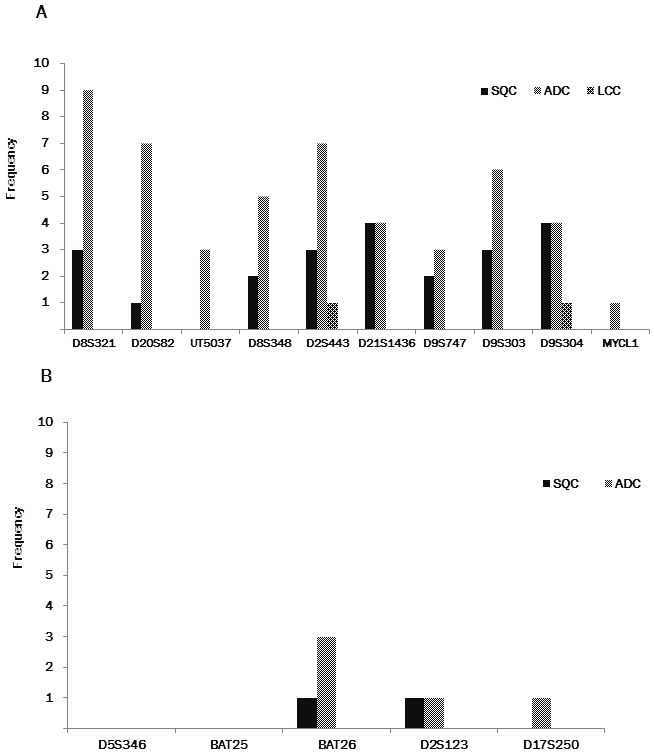
A. Frequency of EMAST (number of tumors exhibiting instability in tumors that could be examined) in each region. B. Frequency of MSI (number of tumors exhibiting instability in tumors that could be examined) in each region SQC, squamous cell carcinoma; ADC, adenocarcinoma; LCC, large cell carcinoma.
We also found that 12.3% (8/65) of tumors (6 of 39 [15.4%] ADCs, 2 of 19 [10.5%] SQCs) exhibited traditional MSI in either of the mono- or di-nucleotide-repeating regions of the Bethesda panel (Figure 2B). Traditional MSI was found at three markers, BAT 26 (4/65, 6.2%), D2S8123 (2/65, 3.1%) and D17S250 (1/65, 1.5%) (Figure 3B).
EMAST and traditional MSI appear to occur independently, as no significant association in their incidence was found (Fisher’s exact test, P = 0.146).
LOH in selected tetra-nucleotide-repeats and Bethesda panel
All the tumors examined were heterozygous in at least two markers among the ten tetra-nucleotide-repeating regions, and 58 (89.2%) were heterozygous in at least one marker of the Bethesda panel. LOH at the tetra-nucleotide-repeated regions was found in 41 of 65 (63.1%) tumors (25/39 [64.1%] ADCs, 11 of 19 [57.9%] SQCs, 4 of 6 [66.7%] LCCs and one adenosquamous cell carcinoma) (Figure 4A). LOH tended to preferentially occur at D8S348 (7/18, 38.9%), D21S1436 (10/28, 35.7%), MYCL1 (11/31, 35.5%), D9S304 (11/44, 25.0%), D9S303 (11/45, 24.4%), D20S82 (6/27, 22.2%), and D8S321 (7/32, 21.9%), than at D2S443 (5/11, 15.2%), D9S747 (5/59, 8.5%), and UT5037 (0/41, 0.0%) (Figure 5A).
Figure 4.
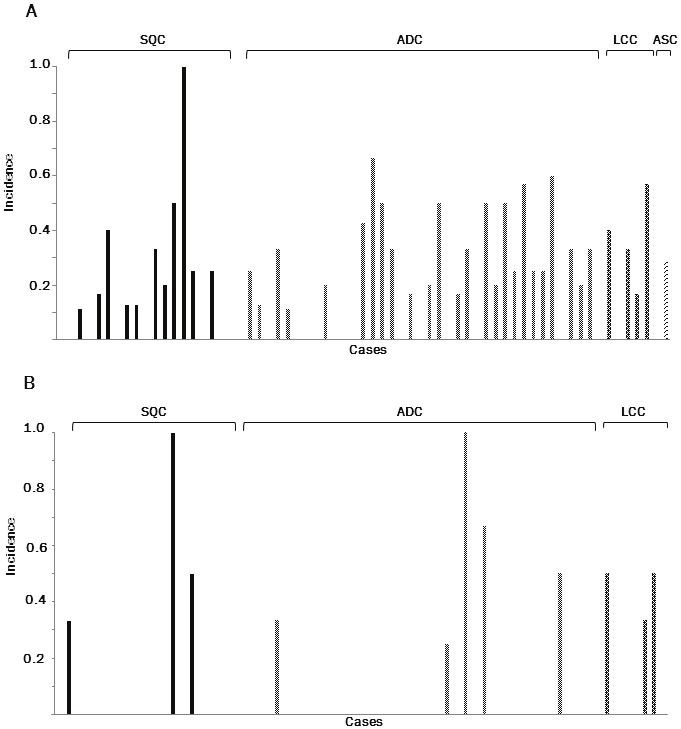
A. Incidence of loss of heterozygosity (LOH) in the selected tetra-nucleotide-repeating regions informative in each case. B. Incidence of LOH in the regions informative of the Bethesda panel in each case. SQC, squamous cell carcinoma; ADC, adenocarcinoma; LCC, large cell carcinoma.
Figure 5.
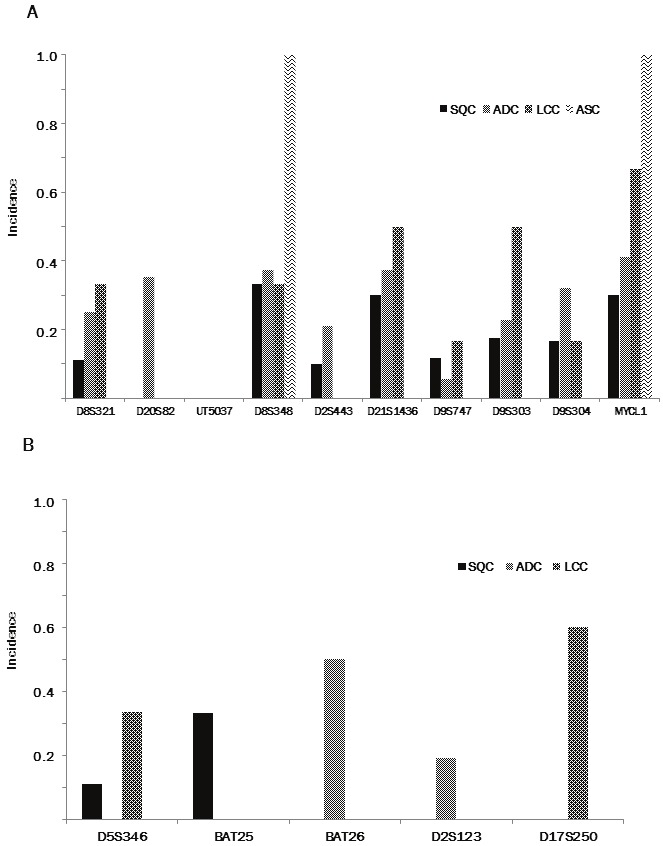
A. Incidence of tumors exhibiting LOH in the selected tetra-nucleotide-repeating regions informative in each region. B. Incidence of tumors exhibiting LOH in the regions informative of the Bethesda panel in each region. SQC, squamous cell carcinoma; ADC, adenocarcinoma; LCC, large cell carcinoma.
LOH at the mono- or di-nucleotide regions of the Bethesda panel was found in 11 of 58 (19.0%) tumors (3/19 [15.8%] squamous cell carcinomas, 5 of 39 [12.8%] adenocarcinomas and 3 of 6 [50%] large cell carcinomas) (Figure 4B). LOH tended to preferentially occur at BAT25 (2/17, 11.8%), BAT 26 (2/4, 50.0%), and D2S123 (4/38, 10.5%), than at D5S346 (2/27, 7.4%), and D17S250 (3/43, 7.0%) (Figure 5B).
Association between EMAST/MSI and clinicopathologic parameters
Tumors exhibiting EMAST in two or more of the tetra-nucleotide-repeating regions were defined as EMAST-high (22/65, 33.8%), and all other tumors were defined as EMAST-low (43/65, 66.2%), according to the previous studies [15,28]. The level of EMAST showed significant association with medical history of an overlap with other malignant neoplasms (Table 3). There were no significant correlations between the level of EMAST and other clinicopathologic parameters (i.e., sex, age, smoking history, family history of malignancies, histological subtype, pathological T factor (pT), vascular and lymphatic invasion, proliferative activity [Ki-67 index], LOH of p53 locus, and immunohistochemical expression of p53 protein) (Table 3).
Table 3.
Associaton between EMAST and clicopathologic subjects
| EMAST-low | EMAST-high | P value | |||
|---|---|---|---|---|---|
| Sex | 0.743 | ||||
| Male | (46) | 31 | 15 | ||
| Female | (19) | 12 | 7 | ||
| Age (year) | mean±SD | 67.4 ± 9.6 | 66.4 ± 11.1 | 0.713 | |
| Smoking history | 0.233 | ||||
| Smoker | (52) | 36 | 16 | ||
| Non-smoker | (13) | 7 | 6 | ||
| Brinkmann index | mean±SD | 928.7 ± 891.3 | 994.5 ± 1057.8 | 0.793* | |
| Medical history of malignant neoplasm | (64) | 0.021 | |||
| Present | (16) | 7 | 9 | ||
| Absent | (48) | 36 | 12 | ||
| Family history of malignant neoplasm | (59) | 0.926 | |||
| Present | (30) | 20 | 10 | ||
| Absent | (29) | 19 | 10 | ||
| Histological subtype | 0.905 | ||||
| SQC | (19) | 12 | 7 | ||
| ADC | (39) | 24 | 15 | ||
| ASC | (1) | 1 | 0 | ||
| LCC | (6) | 6 | 0 | ||
| pT factor | 0.621 | ||||
| pT1 | (37) | 25 | 12 | ||
| pT2 | (26) | 16 | 10 | ||
| pT3 | (2) | 2 | 0 | ||
| Vascular invasion | (65) | 0.161 | |||
| Present | (19) | 15 | 4 | ||
| Absent | (46) | 28 | 18 | ||
| Lymphatic invasion | (65) | 0.349 | |||
| Present | (14) | 11 | 3 | ||
| Absent | (51) | 32 | 19 | ||
| Proliferaitve activity# | (61) | 0.747 | |||
| Low (Ki67 index ≤ 10%) | (21) | 14 | 7 | ||
| High (Ki67 index > 10%) | (40) | 25 | 15 | ||
| Ki-67 index | mean±SD | 23.9% ± 19.8 | 27.2% ± 22.8 | 0.557* | |
| p53 immunohistochemical expression | (65) | ||||
| Low (p53 socre ≤ 1.13) | (33) | ||||
| High (p53 score > 1.13) | (32) | ||||
| p53 score | mean±SD | 20.5 ± 31.4 | 22.7 ± 28.9 | 0.784* | |
| p53 LOH | (35) | 0.213 | |||
| Present | (6) | 3 | 3 | ||
| Absent | (29) | 22 | 7 |
Statistical association was analyzed by Fisher’s exact test or chi-square test, and difference was analyzed by Student’s t test;
EMAST, elevated microsatellite alteration at selected tetra-nucleotide; SQC, squamous cell carcinoma; ADC, adenocarcinoma; ASC, Adenosquamous carcinoma; LCC, large cell carcinoma;
Four cases were not available for immonohistochemical examination due to too small tumors.
Tumors exhibiting traditional MSI in two or more regions of the Bethesda panel were defined as MSI-high (0/8, 0%), and all other tumors were defined as MSI-low (8/8, 100%). There were no significant correlations between the level of MSI and the clinicopathologic parameters examined (data not shown).
Association between LOH and clinicopathologic parameters
Tumors exhibiting LOH in two or more tetra-nucleotide-repeating regions were defined as LOH/selected tetra-nucleotide (ST)-high (20/65, 30.8%), and all other tumors were defined as LOH/ST-low (45/65, 69.2%). There were no significant correlations between the level of LOH/ST and the clinicopathologic parameters (Table 4).
Table 4.
Associaton between LOH at tetra-nucleotide markers and clicopathologic subjects
| LOH-low | LOH-high | P value | |||
|---|---|---|---|---|---|
| Sex | 0.928 | ||||
| Male | (46) | 32 | 14 | ||
| Female | (19) | 13 | 6 | ||
| Age (year) | mean±SD | 67.9 ± 10.5 | 65.0 ± 8.8 | 0.276* | |
| Smoking history | 0.622 | ||||
| Smoker | (52) | 36 | 16 | ||
| Non-smoker | (13) | 9 | 4 | ||
| Brinkmann index | mean±SD | 1000.1 ± 931.6 | 848.2 ± 981.8 | 0.548* | |
| Medical history of malignant neoplasm | (64) | 0.533 | |||
| Present | (16) | 12 | 4 | ||
| Absent | (48) | 32 | 16 | ||
| Family history of malignant neoplasm | (59) | 0.275 | |||
| Present | (30) | 20 | 10 | ||
| Absent | (29) | 23 | 6 | ||
| Histological subtype | 0.880 | ||||
| SQC | (19) | 14 | 5 | ||
| ADC | (39) | 28 | 11 | ||
| ASC | (1) | 0 | 1 | ||
| LCC | (6) | 3 | 3 | ||
| pT factor | 0.808 | ||||
| pT1 | (37) | 26 | 11 | ||
| pT2 | (26) | 19 | 7 | ||
| pT3 | (2) | 0 | 2 | ||
| Vascular invasion | (65) | 0.936 | |||
| Present | (19) | 13 | 6 | ||
| Absent | (46) | 31 | 15 | ||
| Lymphatic invasion | (65) | ||||
| Present | (14) | 8 | 6 | ||
| Absent | (51) | 36 | 15 | ||
| Proliferaitve activity# | (61) | ||||
| Low (Ki67 index ≤ 10%) | (21) | 15 | 6 | ||
| High (Ki67 index > 10%) | (40) | 28 | 12 | ||
| Ki-67 index | mean±SD | 26.0% ± 20.8 | 23.2% ± 21.2 | 0.627* | |
| p53 immunohistochemical expression | (65) | 0.857 | |||
| Low (p53 socre ≤ 1.13) | (33) | 22 | 11 | ||
| High (p53 score > 1.13) | (32) | 22 | 10 | ||
| p53 score | mean±SD | 23.9 ± 31.2 | 15.3 ± 28.1 | 0.295* | |
| p53 LOH | (35) | 0.329 | |||
| Present | (6) | 3 | 3 | ||
| Absent | (29) | 20 | 9 |
Statistical association was analyzed by Fisher’s exact test or chi-square test, and difference was analyzed by Student’s t test;
LOH, loss of heterozygosity; SQC, squamous cell carcinoma; ADC, adenocarcinoma; ASC, Adenosquamous carcinoma; LCC, large cell carcinoma;
Four cases were not available for immonohistochemical examination due to too small tumors.
Similarly, tumors exhibiting LOH in two or more regions of the Bethesda panel were defined as LOH/Bethesda panel (BP)-high (2/58, 3.4%), and all other tumors were defined as LOH/ BP-low (56/58, 96.6%). There were no significant correlations between the level of LOH/BP and the clinicopathologic parameters (data not shown).
Association between EMAST and clinical outcome
The EMAST-high group showed a poorer postoperative overall survival than the EMAST-low group (mean survival time was 1394 days for the EMAST-high group and 2396 days for the EMAST-low group; log-rank test, P = 0 .0018) (Figure 6A). Of the 22 patients with EMAST-high tumors, 12 died; 3 died of NSCLCs (the primary cause), 3 other malignant neoplasms (i.e., renal cell cancer, rectal cancer, bladder cancer), and 6 non-neoplastic diseases (i.e., acute myocardial infarction, cardiac failure, and pneumonia). Of the 43 patients with EMAST-low tumors, 10 died; 6 died of NSCLCs (the primary cause), 2 other malignant neoplasms (i.e., small cell lung cancer and malignant lymphoma), and 2 non-neoplastic diseases (i.e., cardiac failure and decrepitude).
Figure 6.
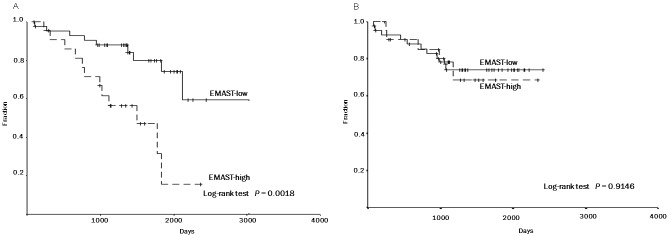
Association between EMAST and 5-year overall survival (A) and 5-year disease-free survival (B). Kaplan- Meier survival curves are shown. EMAST-high: tumors exhibiting EMAST in two or more of the tetra-nucleotiderepeating regions. EMAST-low: tumors exhibiting the EMAST in one or none of the regions. Five-year overall survival rates were 79.9% and 31.4% in EMAST-low and –high groups, respectively (Log-rank test, P = 0.0018) (A). Five-year disease-free survival rates were 73.9% and 68.5% in EMAST-low and –high groups, respectively (Log-rank test, P = 0.9146) (B).
There was no significant difference in the disease-free survival (mean survival time was 1844 days for the EMAST-high group and 1947 days for the EMAST-low group; log-rank test, P =0.9146) (Figure 6B), and no association between the level of EMAST and disease recurrence (recurrent rate, 5/22 in the EMAST-high group versus 11/43 in the EMAST-low group, Chi-square test, P = 0.962). Moreover, no significant associations were found between the level of LOH/ST, LOH/BP, or MSI and any of the clinicopathologic parameters examined (data not shown).
Discussion
The present study demonstrated that a considerable fraction of NSCLCs was unstable in the ten tetra-nucleotide-repeating regions and that the incidence of EMAST is unequivocally higher than that of traditional MSI. These findings are comparable to those of previous studies which showed an incidence of EMAST in NSCLC of 35-51% [21-23]. The incidence of EMAST differs among the types of malignant neoplasms, 5% in prostate cancer [6], 13% in ovarian cancer [29], 75% in skin cancer [27], and 43.9-45% in bladder cancer [27,28]. These findings suggest a potential molecular basis for the unique properties in different types of malignant neoplasms.
The most interesting finding of the present study is that patients with EMAST-high NSCLC were affected by additional malignant neoplasms including gastric cancer and renal cell cancer at a significantly higher incidence (42.9% [9/21] in the EMAST-high group versus 16.3% [7/43] in the EMAST-low group). For the 16 patients who were affected by multiple neoplasms, essential information of their clinicopathologic characteristics and alterations in the tetra-nucleotide-repeating markers are described in Table 5. Similarly, patients with HNPCC (Lynch syndrome) are also often affected by additional neoplasms, such as endometrial and gastric cancer [14,15,31,32]. HNPCC is an autosomal dominant disease with germ line mutations in the mismatch repair genes (i.e., hMSH2, hMLH1, and hMSH6) [10,11,14,15,32]. Defects in DNA mismatch repair due to mutations cause traditional MSI and manifest as frame-shift mutations in mono- or di-nucleotide-repeating regions [10,11,14,15,31,32]. Traditional MSI has been found in 85-95% of HNPCC (and in 10-15% of sporadic colorectal cancers, in which the mismatch repair genes are silenced by the acquired epigenetic modification) and is well accepted to be an important molecular basis for promoting carcinogenesis of certain types of malignant neoplasms [7-12]. On the other hand, EMAST, distinct from traditional MSI, is not associated with defects in mismatch repair [23,28]. Although the actual molecular mechanism of EMAST remains unclear, previous studies of some AAAG-type tetra-nucleotide repeating regions suggest that p53 alterations could be involved [22]. One recent study demonstrated an association between the heterogeneous nuclear expression of hMSH3 and EMAST in colorectal cancer cells, suggesting that an acquired hMSH3 alteration could be its molecular mechanism [36]. The present study investigated the involvement of p53 (LOH of p53 gene and its potential mutations evaluated by immunohistochemistry) in EMAST, but failed to obtain a result that supports previous findings [16,21-24,27]. The difference in the tetra-nucleotide repeating regions examined might be responsible for this discrepancy. Thus, establishment of universal markers to evaluate EMAST, like the Bethesda panel, is necessary to verify its clinicopathologic significance. Moreover, a comprehensive search for potential alterations of DNA replication/repair molecules like hMSH3 may lead to elucidation of the molecular mechanism of EMAST.
Table 5.
Essential clincopathologic information and EMAST among cases with multiple malignant neoplasms
| No | Sex | Age | Histology | EMAST level | alternation in the ten selected tetra-nucleotide-repeating regions | Overlapped neoplasms | Outcome | Cause of death | |||||||||
|---|---|---|---|---|---|---|---|---|---|---|---|---|---|---|---|---|---|
|
| |||||||||||||||||
| D8S321 | D20S82 | UT5037 | D8S348 | D2S443 | D21S1436 | D9S747 | D9S303 | D9S304 | MYCL1 | ||||||||
| 1 | M | 66 | SQC | H | - | Ins | - | - | - | - | - | Ins | - | - | GC+RCC | Dead | RCC |
| 2 | M | 68 | SQC | H | - | - | - | - | Ins | - | - | Ins | - | - | LC+RC | Dead | unknown |
| 3 | M | 79 | SQC | H | - | - | - | - | Ins | Ins | - | - | LOH | - | GC | Dead | AMI |
| 4 | M | 74 | ADC | H | - | Ins | - | - | Ins | - | - | - | - | - | PC | Dead | pneumonia |
| 5 | M | 60 | SQC | H | - | - | - | Ins | - | - | Ins | LOH | - | LOH | RC | Dead | RC |
| 6 | M | 58 | SQC | H | Ins | - | - | LOH | - | Ins | - | - | LOH | - | BC | Dead | BC |
| 7 | F | 77 | ADC | H | Ins | Ins | - | - | LOH | - | - | Ins | - | LOH | MSC | Alive | - |
| 8 | M | 53 | ADC | H | Ins | - | - | - | Ins | - | - | - | - | LOH | GC | Alive | - |
| 9 | M | 64 | ADC | H | Ins | Ins | - | - | - | - | - | - | - | LOH | GC | Alive | - |
| 10 | M | 82 | SQC | L | - | - | - | - | - | LOH | Ins | - | - | - | GC | Dead | NSCLC |
| 11 | F | 76 | ADC | L | - | - | - | - | - | - | - | - | - | - | UC | Alive | - |
| 12 | M | 55 | ADC | L | - | LOH | - | NA | - | Ins | - | - | - | LOH | ML | Dead | ML |
| 13 | M | 75 | ADC | L | - | - | - | - | - | - | - | - | LOH | - | SS | Alive | - |
| 14 | M | 78 | ADC | L | - | - | - | - | - | - | - | - | - | - | PC | Alive | - |
| 15 | M | 77 | SQC | L | LOH | - | - | NA | Ins | - | - | - | NA | - | SCLC | Dead | SCLC |
| 16 | M | 73 | SQC | L | - | - | - | - | - | - | - | - | - | - | GC | Alive | - |
EMAST, elevated alterations of selected tetra-nucleotide; SQC, squamous cell carcinoma; ADC, adenocarcinoma; M, male; F, female; H, high; L, low; Ins, instable; LOH, loss of heterozygosity; NA, Not available; -, no alteration; NSCLC, Non-small cell lung carcioma; SCLC, small cell lung carcinoma; GC, gastric cancer; RCC, renal cell cancer; LC, laryngeal cancer; RC, rectal cancer; UC, uteirne cancer; ML, malignant lymphoma; PC, prostate cancer; SS, synovial sarcoma; BC, bladder cancer; MSC, maxillary sinus cancer; AMI, acute myocardial infarction.
As for the clinical outcome, a pronounced difference in the overall survival was found between the EMAST high- and low-groups. However, no significant difference was found in the disease-free survival and the recurrent rate, or in histological grade and proliferating activity of neoplastic cells. Notably, 3 of 22 (13.6%) patients with EMAST-high tumor died of other malignant neoplasms, while 2 of 43 (4.7%) patients with EMAST-low tumor died of other neoplasms. These findings suggest that the poorer overall survival in the EMAST-high group might be due to a high susceptibility to malignant neoplasm, and EMAST itself does not promote the progression process of their carcinogenesis (that is, it does not promote the acquisition of highly malignant activity of neoplastic cells).
In conclusion, impairment of molecular machinery that maintains stable replication of the tetra-nucleotide-repeated regions may elevate susceptibility to NSCLCs and certain neoplastic diseases. Elucidation of the potential molecular mechanism of EMAST could lead to discovery of a novel genetic background determining susceptibility to NSCLCs and establishment of a novel disease susceptible for multiple neoplasms including NSCLCs.
Acknowledgements
This work was supported in part by Grants-in-Aid for Scientific Research from the Ministry of Education, Culture, Sports, Science and Technology of Japan (Tokyo, Japan; No. 24590242 to H. Oshiro and No. 23590428 to K. Okudela), and by a grant from Yokohama Medical Facility (Yokohama, Japan). We especially thank Mariko Maekawa (Division of Pathology, Yokohama City University Medical Center, Yokohama, Japan) for her assistance.
Declaration of Conflicts of interest
None declared.
References
- 1.Hoffman PC, Mauer AM, Vokes EE. Lung cancer. Lancet. 2000;335:479–85. doi: 10.1016/S0140-6736(00)82038-3. [DOI] [PubMed] [Google Scholar]
- 2.Spira A, Ettinger DS. Multidisciplinary Management of Lung Cancer. N Engl J Med. 2004;350:379–92. doi: 10.1056/NEJMra035536. [DOI] [PubMed] [Google Scholar]
- 3.Yang P, Allen MS, Aubry MC, Aubry MC, Wampfler JA, Marks RS, Edell ES, Thibodeau S, Adjei AA, Jett J, Deschamps C. Clinical features of 5,628 primary lung cancer patients: Experience at Mayo Clinic From 1997 to 2003. Chest. 2005;128:452–62. doi: 10.1378/chest.128.1.452. [DOI] [PubMed] [Google Scholar]
- 4.Ignatius Ou SH, Zell JA, Ziogas A, Anton-Culver H. Prognostic Factors for Survival of Stage I Nonsmall Cell Lung Cancer Patients: A Population-based Analysis of 19,702 Stage I Patients in the California Cancer Registry From 1989 to 2003. Cancer. 2007;110:1532–41. doi: 10.1002/cncr.22938. [DOI] [PubMed] [Google Scholar]
- 5.Asamura H, Goya T, Koshiishi Y, Sohara Y, Eguchi K, Mori M, Nakanishi Y, Tsuchiya R, Shimokata K, Inoue H, Nukiwa T, Miyaoka E Japanese Joint Committee of Lung Cancer Registry. A Japanese Lung Cancer Registry study: prognosis of 13,010 resected lung cancers. J Thorac Oncol. 2008;3:46–52. doi: 10.1097/JTO.0b013e31815e8577. [DOI] [PubMed] [Google Scholar]
- 6.Burger M, Denzinger S, Hammerschmied CG, Tannapfel A, Obermann EC, Wieland WF, Hartmann A, Stoehr R. Elevated microsatellite alternations at selected tetranucleotides (EMAST) and mismatch repair gene expression in prostate cancer. J Mol Med. 2006;84:833–41. doi: 10.1007/s00109-006-0074-0. [DOI] [PubMed] [Google Scholar]
- 7.Mao L, Lee DJ, Tockman MS, Erozan YS, Askin F, Sidransky D. Microsatellite alterations as clonal markers for the detection of human cancer. Proc Natl Acad Sci USA. 1994;91:9871–5. doi: 10.1073/pnas.91.21.9871. [DOI] [PMC free article] [PubMed] [Google Scholar]
- 8.Schlegel J, Bocker T, Zirngibl H, Hofstädter F, Rüschoff J. Detection of microsatellite instability in human colorectal carcinomas using a non-radioactive PCR-based screening technique. Virchows Arch. 1995;426:223–7. doi: 10.1007/BF00191358. [DOI] [PubMed] [Google Scholar]
- 9.Cheng KC, Loeb LA. Genomic instability and tumor progression: mechanistic considerations. Adv Cancer Res. 1993;60:121–56. doi: 10.1016/s0065-230x(08)60824-6. [DOI] [PubMed] [Google Scholar]
- 10.Lengauer C, Kinzler KW, Vogelstein B. Genetic instabilities in human cancers. Nature. 1998;396:643–9. doi: 10.1038/25292. [DOI] [PubMed] [Google Scholar]
- 11.Lothe RA. Microsatellite instability in human solid tumors. Mol Med Today. 1997;3:61–8. doi: 10.1016/S1357-4310(96)10055-1. [DOI] [PubMed] [Google Scholar]
- 12.Horii A, Han HJ, Shimada M, Yanagisawa A, Kato Y, Ohta H, Yasui W, Tahara E, Nakamura Y. Frequent replication errors at microsatellite loci in tumors of patients with multiple primary cancers. Cancer Res. 1994;54:3373–5. [PubMed] [Google Scholar]
- 13.Zhou X, Kemp BL, Khuri FR, Liu D, Lee JJ, Wu W, Hong WK, Mago L. Prognostic implication of microsatellite alternation profiles in early-stage non-small Cell lung Cancer. Clin Cancer Res. 2000;6:559–65. [PubMed] [Google Scholar]
- 14.Lynch HT, de la Chapelle A. Genetic susceptibility to non-polyposis colorectal cancer. J Med Genet. 1999;36:801–18. [PMC free article] [PubMed] [Google Scholar]
- 15.Umar A, Boland CR, Terdiman JP, Syngal S, de la Chapelle A, Rüschoff J, Fishel R, Lidor NM, Burgart LJ, Hamelin R, Hamilton SR, Hiatt RA, Jass J, Lindblom A, Lynch HT, Peltomaki P, Ramsey SD, Rodriguez-Bigas MA, Vasen HF, Hawk ET, Barrett JC, Freedman AN, Srivastava S. Revised Bethesda Guidelines for hereditary nonpolyposis colorectal cancer (Lynch Syndrome) and microsatellite instability. J Natl Cancer Inst. 2004;96:261–8. doi: 10.1093/jnci/djh034. [DOI] [PMC free article] [PubMed] [Google Scholar]
- 16.Fong KM, Zimmerman PV, Smith PJ. Microsatellite instability and other molecular abnormalities in non-small cell lung cancer. Cancer Res. 1995;55:28–30. [PubMed] [Google Scholar]
- 17.Ninomiya H, Nomura K, Satoh Y, Okumura S, Nakagawa K, Fujiwara M, Tsuchiya E, Ishikawa Y. Genetic instability in lung cancer: concurrent analysis of chromosomal, mini- and microsatellite instability and loss of heterozygosity. Br J Cancer. 2006;94:1485–91. doi: 10.1038/sj.bjc.6603121. [DOI] [PMC free article] [PubMed] [Google Scholar]
- 18.Pylkkänen L, Karjalainen A, Anttila S, Vainio H, Husgafvel-Pursiainen K. No evidence of microsatellite instability but frequent loss of heterozygosity in primary resected lung cancer. Environ Mol Mutagen. 1997;30:217–23. doi: 10.1002/(sici)1098-2280(1997)30:2<217::aid-em14>3.0.co;2-g. [DOI] [PubMed] [Google Scholar]
- 19.Sekido Y, Fong KM, Minna JD. Molecular Genetics of Lung Cancer. Annu Rev Med. 2003;54:73–87. doi: 10.1146/annurev.med.54.101601.152202. [DOI] [PubMed] [Google Scholar]
- 20.Schayek H, Krupsky M, Yaron P, Yellin A, Simansky DA, Friedman E. Genetic analyses of non-small cell lung cancer in Jewish Israeli patients. Isr Med Assoc J. 2006;8:159–63. [PubMed] [Google Scholar]
- 21.Woenckhaus M, Stoehr R, Dietmaier W, Wild PJ, Zieglmeier U, Foerster J, Merk J, Blaszyk H, Pfeifer M, Hofstaedter F, Hartmann A. Microsatellite insatability at chromosome 8p in non-small cell lung cancer is associated with lymphnode metastasis and squamous differentiation. Int J Oncol. 2003;23:1357–63. [PubMed] [Google Scholar]
- 22.Xu L, Chow J, Bonacum J, Eisenberger C, Ahrendt SA, Spafford M, Wu L, Lee SM, Piantadosi S, Tockman MS, Sidransky D, Jen J. Microsatellite instability at AAAG repeat sequence in respiratoty tract cancers. Int J Cancer. 2001;91:200–4. doi: 10.1002/1097-0215(200002)9999:9999<::aid-ijc1031>3.0.co;2-0. [DOI] [PubMed] [Google Scholar]
- 23.Ahrendt SA, Decker PA, Doffek K, Wang B, Xu L, Demeure MJ, Jen J, Sidransky D. Microsatellite instability at selected tetranucleotide repeats is associated with p53 mutations in non-small cell lung cancer. Cancer Res. 2000;60:2488–91. [PubMed] [Google Scholar]
- 24.Chang JW, Chen YC, Chen CY, Chen JT, Chen SK, Wang YC. Correlation of genetic insatiability with mismatch repair protein expression and p53 mutations in non-small cell lung cancer. Clin Cancer Res. 2000;6:1639–46. [PubMed] [Google Scholar]
- 25.Shridhar V, Siegfried J, Hunt J, del Mar Alonso M, Smith DI. Genetic instability of microsatellite sequence in many non-small cell lung carcinomas. Cancer Res. 1994;54:2084–7. [PubMed] [Google Scholar]
- 26.Miozzo M, Sozzi G, Musso K, Pilotti S, Incarbone M, Pastorino U, Pierotti MA. Microsatellite alterations in bronchial and sputum specimens of lung cancer patients. Cancer Res. 1996;56:2285–8. [PubMed] [Google Scholar]
- 27.Danaee H, Nelson HH, Karagas MR, Schned AR, Ashok TD, Hirao T, Perry AE, Kelsey KT. Microsatellite instability at tetranucleotide repeats in skin and bladder cancer. Oncogene. 2002;21:4894–9. doi: 10.1038/sj.onc.1205619. [DOI] [PubMed] [Google Scholar]
- 28.Catto JW, Azzouzi AR, Amira N, Rehman I, Feeley KM, Cross SS, Fromont G, Sibony M, Hamdy FC, Cussenot O, Meuth M. Distinct patterns of microsatellite instability are seen in tumours of the urinary tract. Oncogene. 2003;22:8699–706. doi: 10.1038/sj.onc.1206964. [DOI] [PubMed] [Google Scholar]
- 29.Singer G, Kallinowski T, Hartmann A, Dietmaier W, Wild PJ, Schraml P, Sauter G, Mihatsch MJ, Moch H. Different types of microsatellite instability in ovarian carcinoma. Int J Cancer. 2004;112:643–6. doi: 10.1002/ijc.20455. [DOI] [PubMed] [Google Scholar]
- 30.Goldstraw P, Groome P. In: TNM Classification of Malignant Tumors. 7th Edition. Sobin LH, Gospodarowicz MK, Wittekind C, editors. Oxford: Wiley-Blackwell; 2009. pp. 136–146. [Google Scholar]
- 31.Peltomäki P, Lothe RA, Aaltonen LA, Pylkkänen L, Nyström-Lahti M, Seruca R, David L, Holm R, Ryberg D, Haugen A, Brøgger A, Børresen AL, de la Chapelle A. Microsatellite instability is associated with tumors that characterize the hereditary non-polyposis colorectal carcinoma syndrome. Cancer Res. 1993;53:5853–5. [PubMed] [Google Scholar]
- 32.Rodriguez-Bigas MA, Boland CR, Hamilton SR, Henson DE, Jass JR, Khan PM, Lynch H, Perucho M, Smyrk T, Sobin L, Srivastava S. A National Cancer Institute Workshop on Hereditary Nonpolyposis Colorectal Cancer Syndrome: Meeting Highlights and Bethesda Guidelines. J Natl Cancer Inst. 1997;89:1758–62. doi: 10.1093/jnci/89.23.1758. [DOI] [PubMed] [Google Scholar]
- 33.Futreal PA, Barrett JC, Wieseman RW. An Alu polymorphism intragenic to the TP53 gene. Nucleic Acids Res. 1991;19:6977. doi: 10.1093/nar/19.24.6977. [DOI] [PMC free article] [PubMed] [Google Scholar]
- 34.Okudela K, Woo T, Mitsui H, Yazawa T, Shimoyamada H, Tajiri M, Ogawa N, Masuda M, Kitamura H. Morphometric profiling of lung cancers-its association with clinicopathologic, biologic, and molecular genetic features. Am J Surg Pathol. 2010;34:243–55. doi: 10.1097/PAS.0b013e3181c79a6f. [DOI] [PubMed] [Google Scholar]
- 35.Woo T, Okudela K, Yazawa T, Wada N, Ogawa N, Ishiwa N, Tajiri T, Rino Y, Kitamura H, Masuda M. Prognostic value of KRAS mutations and Ki-67 expression in stage I lung adenocarcinomas. Lung Cancer. 2009;65:355–62. doi: 10.1016/j.lungcan.2008.11.020. [DOI] [PubMed] [Google Scholar]
- 36.Lee SY, Chung H, Devaraj B, Iwaizumi M, Han HS, Hwang DY, Seong MK, Jung BH, Carethers JM. Microsatellite Alterations at Selected Tetranucleotide Repeats Are Associated with Morphologies of Colorectal Neoplasias. Gastroenterology. 2010;139:1519–25. doi: 10.1053/j.gastro.2010.08.001. [DOI] [PMC free article] [PubMed] [Google Scholar]