

Abstract
Background. The reasons for the unusual age-specific mortality patterns of the 1918–1919 influenza pandemic remain unknown. Here we characterize pandemic-related mortality by single year of age in a unique statewide Kentucky data set and explore breakpoints in the age curves.
Methods. Individual death certificates from Kentucky during 1911–1919 were abstracted by medically trained personnel. Pandemic-associated excess mortality rates were calculated by subtracting observed rates during pandemic months from rates in previous years, separately for each single year of age and by sex.
Results. The age profile of excess mortality risk in fall 1918 was characterized by a maximum among infants, a minimum at ages 9–10 years, a maximum at ages 24–26 years, and a second minimum at ages 56–59 years. The excess mortality risk in young adults had been greatly attenuated by winter 1919. The age breakpoints of mortality risk did not differ between males and females.
Conclusions. The observed mortality breakpoints in male and female cohorts born during 1859–1862, 1892–1894, and 1908–1909 did not coincide with known dates of historical pandemics. The atypical age mortality patterns of the 1918–1919 pandemic cannot be explained by military crowding, war-related factors, or prior immunity alone and likely result from a combination of unknown factors.
Keywords: pandemic, influenza, mortality, age patterns, gender, immunity, military
The 1918–1919 pandemic of influenza A virus subtype H1N1 infection is one of the most dramatic infectious disease events of the 20th century, with an estimated 20–100 million deaths worldwide [1, 2]. Signature features of this pandemic included at least 2 successive “waves” of mortality within a year in most locales [3], increased severity of influenza-related infections [4] associated with increased frequency of bacterial coinfections [5–7], and perhaps most puzzling, elevated mortality risk among young adults, who are not a traditional risk group for severe outcomes [4, 8–13]. Morbidity surveys suggest that young adults did not experience particularly high influenza attack rates in 1918–1919, relative to those of children [14]. Despite recent renewed interest in historical and experimental studies of the 1918–1919 pandemic virus [15–18], the reasons for the unusual epidemiological features of this pandemic remain unclear [19–22].
Analysis of mortality archives from 1918–1919 has shown that elevated mortality risk among young adults was geographically widespread and included Europe [4, 8, 13], North and South America [9–12], and Asia [23, 24]. By contrast, epidemiological patterns in older populations differed geographically, with decreased mortality among people aged >45 years in the United States and Europe [4, 9, 13] but not in Mexico, Colombia, or remote islands [10, 11, 25]. Evidence from several countries indicates that the mortality peak in young adults disappeared by about 1921, if not earlier [4, 9, 26].
Mortality statistics available from the 1918–1919 pandemic period are typically aggregated by 5- or 10-year age groups [4, 9–14, 23, 24], precluding highly detailed examination of the age distribution of deaths. Furthermore, estimates of pandemic mortality rates can be biased by war-related factors, including military deaths and troop movements, and by differences in diagnostic completeness and accuracy. Detailed data on the age-specific risk of pandemic-related death, especially among women, who were less directly affected by war conditions, are useful to examine possible mechanisms behind the atypical severity of the 1918–1919 pandemic. Here we analyze a unique database of individual death certificates from Kentucky in the years surrounding the pandemic, to explore detailed patterns of influenza-related mortality rates by age, sex, and military status.
METHODS
Historical Individual Death Records, Kentucky
To obtain detailed data on the age and temporal dynamics of the pandemic, all individual death certificates from Kentucky during 1911–1919 were abstracted and entered into a relational database by medically trained personnel (Supplementary Materials). Camp Zachary Taylor was the major military training camp in Kentucky, with a census fluctuating between 23 700 and 57 300 troops in 1918 [27]. We compiled daily, weekly, and monthly time series by cause of death, military status, sex, and single year of age and examined 3 outcomes traditionally linked with influenza: pneumonia and influenza deaths, respiratory deaths, and total deaths [4, 9, 10].
Historical Population Data, Kentucky
To obtain the annual Kentucky population by age, we used linear interpolation of population estimates available from the 1910 and 1920 censuses (Supplementary Materials) [28, 29].
Excess Mortality Approach
To obtain an overall estimate of the mortality burden of the 1918–1919 pandemic in Kentucky by means of an approach that would be comparable to that of previous studies, and to explore the timing of the pandemic, we fitted cyclical Serfling regression models to daily all-cause deaths that occurred during 1911–1919 [4, 9]. These linear regression models included temporal trends and harmonic terms for seasonality and represented a theoretical baseline for mortality in the absence of influenza activity [30]. The influenza-associated excess all-cause mortality rate was estimated as the observed value minus the model-predicted baseline value during 1918–1919, the period of influenza activity (Supplementary Materials).
In addition to the Serfling models, we used a modified “model-free” approach [2, 23] to derive influenza-related excess mortality rates by single year of age, sex, mortality outcome, and military status. In this approach, excess mortality was calculated as the difference between mortality during the months of 1918–1919 when the pandemic occurred and mortality during similar months in 1913–1914, the baseline period. Past research on the 1918–1919 pandemic suggests that this approach compares favorably with traditional Serfling seasonal models [23].
Of particular interest were breakpoints in the age curve of pandemic-related excess mortality rates, which were identified on the basis of the first derivative of spline functions (Supplementary Materials).
RESULTS
General Pandemic Patterns, 1918–1919, Kentucky
We compiled information on 310 363 deaths occurring in Kentucky between 1 January 1911 and 31 December 1919. Primary and contributing causes of deaths were recorded for 143 898 deaths occurring in 1913–1914 and 1918–1919. Here, for simplicity, we concentrated on the total number of primary and contributing causes of death. Respiratory causes were listed in 37% of death certificates in 1918, a much higher proportion than in the baseline years of 1913–1914 (18.1%–19.1%; P < .0001). The proportion of deaths attributed to respiratory conditions remained elevated in 1919, relative to baseline (P < .001).
Serfling seasonal regression applied to daily all-cause deaths identified 2 periods with elevated mortality, fall 1918 and winter 1919, which corresponded with pandemic influenza activity (Figure 1). A sustained rise in all-cause mortality exceeding baseline levels for >2 consecutive days was observed during 1 October–20 December 1918 and 3 January–20 March 1919. Overall, the seasonal regression approach attributed 13 027 all-cause excess deaths (95% confidence interval [CI], 12 657–13 397) to the 1918–1919 pandemic in Kentucky, corresponding to an excess death rate of 0.54% (95% CI, .52%–.55%) of the total population.
Figure 1.
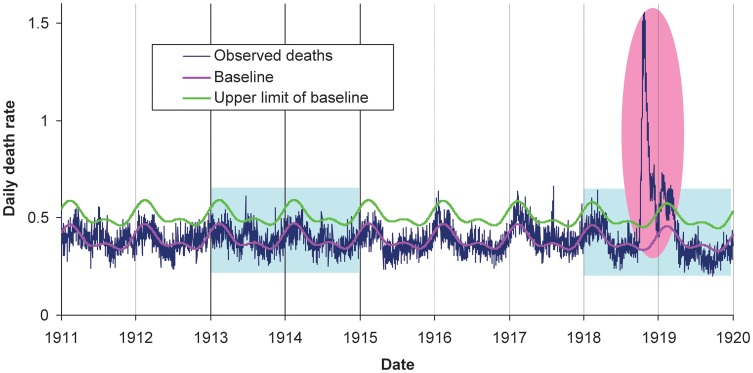
Daily time series of all-cause death rate in Kentucky, 1911–1919, showing observed death rates (blue line), baseline death rate predicted by seasonal regression (pink line), and upper limit of the 95% confidence interval on the predicted baseline (green line). Light blue shaded areas represent years for which cause-specific deaths were coded and digitized. The pink shaded area represents the main influenza pandemic period, September 1918–March 1919.
Pandemic Excess Mortality Rates, by Year of Age and Sex
Next, we calculated pandemic excess mortality rates by single year of age, to explore potential age breakpoints in mortality risk. Given the influenza activity periods previously defined (Figure 1), we considered October–December 1918 and January–March 1919 as pandemic periods, and we used October–December and January–March of 1913–1914 as baselines for excess mortality calculations. Age-specific excess mortality estimates from all causes, respiratory causes, and pneumonia and influenza were highly correlated (Spearman ρ = 0.95; P < .0001). Below, we concentrate on age patterns in excess respiratory deaths and provide results for the other outcomes, as relevant. We also provide estimates of excess mortality rates for broad age groups in Table 1, for comparison with previous studies.
Table 1.
Estimates of Excess Mortality Rates Attributable to Pandemic Influenza, by Time of Pandemic Wave, Age, and Cause of Death, Kentucky, October–December 1918 and January–March 1919
| Time, Cause of Death | Excess Death Rates per 100 000, by Age |
||||||
|---|---|---|---|---|---|---|---|
| 0–4 y | 5–18 y | 19–24 y | 25–49 y | 50–64 y | ≥65 y | Overall | |
| Fall 1918 | |||||||
| Pneumonia and influenza | 728.6 | 260.9 | 705.4 | 517.8 | 124.8 | 176.2 | 429.3 |
| Respiratory conditions | 687.1 | 244.4 | 687.0 | 506.1 | 109.5 | 145.4 | 410.3 |
| All causes | 682.4 | 254.4 | 696.8 | 516.3 | 68.7 | 90.2 | 413.4 |
| Winter 1919 | |||||||
| Pneumonia and influenza | 321.7 | 103 | 196.2 | 203.0 | 97.2 | 19.1 | 167.6 |
| Respiratory conditions | 260.2 | 95.2 | 186.3 | 196.2 | 86.6 | −2.0 | 152.4 |
| All causes | 131.9 | 85.9 | 146.3 | 159.7 | 54.3 | −65.2 | 115.7 |
Crude rates of mortality due to respiratory conditions displayed a “W” shape in fall 1918, peaking in infants, young adults, and seniors (Figure 2A). We subtracted baseline mortality in prepandemic years to obtain influenza-attributable excess mortality in fall 1918 (Figure 2B). The highest rates of influenza-related excess mortality were found in infants <1 year old. Three breakpoints were identified in the age-specific mortality curve: a minimum, at age 9.7 years (1908 birth cohort), with a rate of 15 deaths per 10 000; a maximum, at age 25.6 years (1892 birth cohort), with a rate of 80 deaths per 10 000; and a second minimum, at age 57.8 years (1860 birth cohort), with a rate of 7 deaths per 10 000. Similar age breakpoints were identified in excess pneumonia and influenza mortality rates and all-cause mortality rates (age range across outcomes, 9.3–9.9 years, 25.5–25.6 years, 57.8–58.7 years; Figure 3). Excess mortality rates in individuals >58 years old remained low, although estimates were more variable. One additional extremum was identified in pneumonia and influenza mortality among individuals aged 70 years (1848 birth cohort; Figure 3), potentially because of low pneumonia- and influenza-associated death counts among older individuals.
Figure 2.
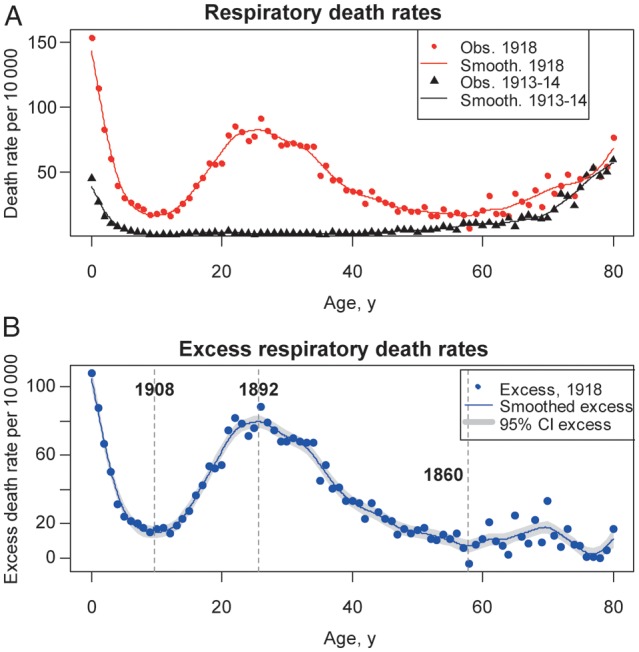
Age-specific respiratory mortality in Kentucky in the fall 1918 pandemic wave and in baseline periods. A, Observed respiratory death rates, by single year of age, during October–December 1918 (red dots) and during the baseline months of October–December 1913–1914 (black triangles). Solid lines represent smoothing splines. B, Age-specific excess respiratory death rates, calculated as observed (1918) minus baseline (1913–1914). The blue dots represent excess death rates estimates; the blue solid line is a smoothing spline of the estimated excess rates, and the grey-shaded areas are 95% confidence intervals (CIs) on the splines. Vertical grey bars mark the age breakpoints (ie, extrema) and associated birth years identified in the mortality age risk.
Figure 3.
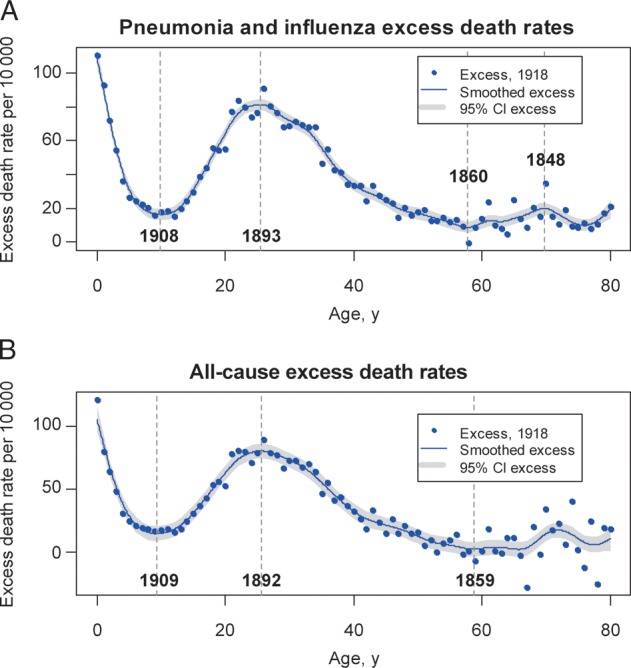
Age-specific excess mortality rates from pneumonia and influenza and from all causes in the fall 1918 pandemic wave, Kentucky. Excess death rates are calculated as observed death rates during October–December 1918 minus baseline death rates during October–December 1913–1914, by single year of age, as in Figure 2. The blue dots represent excess death rates, the blue solid line is a smoothing spline of the excess death rates, and the grey-shaded areas are 95% confidence intervals (CIs) on the splines. Vertical grey bars mark the age breakpoints (ie, extrema) and associated birth years identified in the mortality age risk.
There was no sex-related difference in baseline rates of mortality due to respiratory conditions during the prepandemic years of 1913–1914 (data not shown). However, excess mortality rates were 20%–80% higher among young adult males aged 15–50 years, compared with females aged 15–50 years, during the fall 1918 pandemic wave, while sex-specific differences were reversed in other age groups. Most importantly, despite sex-related differences in estimates of excess mortality rates, the age breakpoints for mortality did not differ between males and females (absolute differences < 1 year; Figure 4). Sex-related patterns were similar for excess pneumonia and influenza deaths and all-cause deaths.
Figure 4.

Age- and sex-related differences in excess respiratory mortality during the October–December 1918 pandemic wave in Kentucky. Dots represent excess death rates, lines are smoothing splines of the excess rates, and grey-shaded areas are 95% confidence intervals (CIs). Vertical grey bars mark the age breakpoints (ie, extrema) and associated birth years identified in the mortality age curves. A, Female-specific excess respiratory death rates by single year of age during fall 1918. B, Male-specific excess respiratory death rates during fall 1918. Blue dots represent estimates based on the entire mortality database, whereas red dots represent estimates after exclusion of deaths among Kentucky male military personnel who were not Kentucky residents. Similar curves excluding military populations are presented in Supplementary Figure 2.
Our main analysis included deaths among all soldiers in Kentucky, about one-third of whom were residents of another state (Supplementary Materials), which may partly account for the increased mortality risk among young adult males. A sensitivity analysis that excluded deaths among soldiers who were residents of another state revealed a lower age-related peak of death among young adult males, compared with young adult females (Figure 4), with an age-related breakpoint at 32 years (1885 birth cohort), rather than 26 years (1892 birth cohort).
The late winter pandemic wave in March–April 1919 had 2–4-fold lower excess impact than the fall 1918 wave with regard to respiratory mortality among individuals aged <50 years, with a much attenuated mortality peak among young adults (Figure 5A). Excess mortality rates among older individuals during winter 1919 were similar to or less than those during fall 1918, with some negative estimates for ages of >70 years. A minimum in the age-related risk profile was found at the age of 9.8 years in winter 1919, in line with the fall 1918 wave, while the other extrema differed by 2–4 years between the 2 waves. Overall, the mortality risk profile was more uniform across age groups in winter 1919 than in fall 1918, and that was true of both sexes (Figure 5B).
Figure 5.

Comparison of age- and sex-specific excess respiratory mortality rates associated with the fall 1918 and winter 1919 pandemic waves in Kentucky. Dots represent excess respiratory death rates, solid lines are smoothing splines of the excess respiratory death rates, and grey-shaded areas represent 95% confidence intervals (CIs). A, Comparison of age patterns in fall 1918 (red) and winter 1919 (black) pandemic waves (October–December 1918 vs January–March 1919). B, Sex-specific differences during the winter 1919 pandemic wave (blue, males; red, females).
Comparison of Military and Civilian Populations
To explore pandemic patterns in military populations, we stratified male deaths during 1918 by military status. A rise in all-cause and respiratory mortality was observed on 29 September 1918 in Camp Taylor, predating the rise in civilian mortality by 1 week (Supplementary Figure 1). Mortality at Camp Taylor returned to baseline levels by late October 1918, representing a shorter period of pandemic activity than that among civilians. Military deaths represented 31.8% of the 3744 respiratory deaths occurring in Kentucky during October–December 1918 among men aged 18–35 years. Exclusion of deaths among military personnel revealed that excess mortality rates among civilian males were less than or equal to those among females aged 18–32 years, and the trend reversed among individuals aged >32 years (Supplementary Figure 2).
DISCUSSION
To our knowledge, this is the first study to describe the age profile and discontinuities in mortality risk associated with the 1918–1919 pandemic by single year of age. Our results are based on a detailed database of individual death certificates representing a population of 2.42 million individuals in Kentucky. Kentucky experienced 2 waves of pandemic activity, in fall 1918 and winter 1919, with a total population mortality impact of approximately 0.54%, consistent with estimates reported in other locations [4, 9, 10]. The most lethal pandemic wave, in fall 1918, was associated with a complex age profile of excess mortality rates, including maxima among infants <1 years and young adults aged 24–26 years (1892–1894 birth cohorts) and minima at ages 9–10 years (1908–1909 birth cohorts) and 56–59 years (1859–1862 birth cohorts). The age breakpoints of mortality risk were similar in men and women. Furthermore, excess mortality rates in young adults greatly decreased in winter 1919.
The age profile of the 1918–1919 pandemic mortality risk in Kentucky is in agreement with previous studies relying on broader age groups in populations from the Americas, Europe, and Asia [4, 9, 10, 12–14]. While many hypotheses have been put forward to explain the patterns of increased risk in young adults and the (relatively) decreased risk among older individuals in this pandemic, none have been conclusive. Below, we discuss these hypotheses in the context of our findings and those of previous studies.
A commonly cited hypothesis to explain the drop in influenza-related excess mortality rates among older adults is “antigenic recycling” [31], whereby prior exposure to antigenically related influenza viruses confers relative protection against mortality [9, 20]. This mechanism would entail lower rates of 1918–1919 pandemic–associated morbidity and mortality among older adults, relative to their experience with pre-1918 influenza viruses. Although detailed morbidity rates by single year of age and season are lacking, Kentucky mortality data are consistent with prior immunity to the 1918–1919 pandemic virus in age cohorts born before 1892–1894. The global pandemic virus of the 1830s, the possibly related transregional virus of 1847, and their descendants may have conferred protection against the 1918 pandemic virus [8]. Accordingly, prior influenza exposure in the mid-to-late 19th century may have protected older Kentucky adults against severe 1918–1919 pandemic–associated mortality. In contrast, individuals living in more remote areas in the 19th century may have escaped these pandemic strains and, consequently, may have experienced high excess mortality rates during the 1918 pandemic [10, 11, 25]. Thus, geographical differences in adult mortality rates linked to historical influenza virus circulation patterns tend to favor the antigenic recycling hypothesis. Further rationale for this hypothesis comes from a related mortality-sparing phenomenon that was observed in the 1957, 1968, and 2009 pandemics and associated with the presence of neutralizing antibodies in older individuals [32–35].
Although the antigenic recycling hypothesis is an attractive explanation of the low 1918–1919 pandemic excess mortality rates among older adults, it is a less parsimonious explanation for younger individuals. Distinct mortality profiles in different regions of the world [4, 9, 10, 12, 13] point to the contribution of distinct factors leading to increased risk among young adults and to protection among seniors. Moreover, the rapid attenuation of the excess mortality risk among young adults by winter 1919 in Kentucky and Scandinavia [4, 26] and by subsequent seasons in New York City [9] and Poland [8] is consistent with a short time scale suggestive of the loss of a pool of high-risk individuals, rather than long-lasting prior immunity.
Another hypothesis stipulates that young adults were prone to an immunopathogenic reaction following infection with 1918 influenza A virus subtype H1N1 [8]. Experimental animal models of 1918 influenza virus infection and observational studies of patients infected with influenza A virus subtype H5N1 have supported the role of an immunopathogenic host response to explain severe disease [17, 18, 36]. A related hypothesis involves increased risk of bacterial superinfection due to aberrant immune responses mediated by CD8+ T cells, potentially more frequent in young adults whose first influenza exposure was to the 1889 pandemic virus [37, 38]. Although detailed analyses of age-specific excess mortality and morbidity patterns are lacking for the 1889 pandemic and subsequent waves in 1891 and 1892, high pandemic attack rates were reported among all age groups. In addition, influenza-specific death rates were highest among seniors—a marked departure from the age signature of the 1918 pandemic [39, 40].
The age breakpoints for mortality identified in our data correspond to birth cohorts of 1859–1862, 1892–1894, and 1908–1909, and our sensitivity analysis that excluded non-Kentucky military personnel points to the cohort born in 1885. While 1885 and 1892 could correspond to the period surrounding the 1889 pandemic, there is no evidence to support unusual influenza events in the other years. Our results for younger persons do not readily support hypotheses involving the positive or negative effects of prior immunity from exposure to past pandemic viruses, including antigen recycling or immunopathological reactions. However, without better knowledge of the subtypes and cross-reacting epitopes of viruses circulating before 1918, it is not possible to rule immunity effects in or out.
A competing hypothesis stipulates that puberty could increase the risk of severe influenza-related outcomes [41]. The rise in influenza-related mortality starting at ages 9–10 years in the Kentucky data is not inconsistent with this; however, there is a gradual rise between ages 9–10 and 24–26 years, rather than a sharp elevation around the age when puberty occurs. In addition, we observed little difference in the age breakpoints of mortality risk between boys and girls (<0.3 years), as would be expected if physiologic changes of puberty were involved.
Another hypothesis involves an uncharacterized synergistic relationship between the 1918–1919 virus and coinfecting bacteria [6, 7, 42]. Most 1918–1919 pandemic deaths resulted from secondary bacterial pneumonias [6, 43]. Mortality among 1918–1919 influenza patients was most strongly associated with an increased incidence of pneumonia caused by common bacterial pneumopathogens (especially pneumococci, streptococci, and staphylococci), rather than with an increased severity of pneumonia, especially among individuals aged 20–40 years [14, 38]. In the Kentucky data, the rise in mortality risk between ages 9 and 26 years was steeper than the decrease between ages 26 and 50 years. It is interesting to contrast this profile with historical observations on the age-specific illness and case-fatality rates. Fall 1918 surveys indicate that influenza illness rates remained relatively constant between ages 10 and 30 years, at 31%–37%, and dropped sharply at older ages [14]. The steep rise in the excess mortality risk among Kentucky teenagers and young adults is most consistent with a rise in the severity of influenza-related infections due to the increased risk of pneumonia, in agreement with these surveys [14]. In contrast, the slower decline in mortality risk past the age of 26 years could be explained in part by declining influenza rates among middle-aged adults, as is typical of other pandemics [44].
Sex-based variations associated with the 1918–1919 influenza pandemic are confusing [45], with inconsistent sex-based ratios in illnesses and deaths [14]. Assessment of male-specific pandemic death rates are complicated by high mortality in crowded military camps and troop movements, which tend to bias estimates of population sizes and death numbers. Accordingly, our sensitivity analysis excluding military deaths among non-Kentucky residents points to a lower death rate among young adult males and a peak risk later in life, compared with the main analysis. However, we believe that this analysis underestimates the death rates among males because it does not include deaths occurring among Kentucky residents who were training out of state or were involved in combat. Consistent with other military settings, the population of Camp Taylor had a much higher death rate than the rest of Kentucky, at approximately 1.8%–1.9% (Supplementary Materials). Increased risk in the military population could be due to increased influenza transmission, increased risk of bacterial coinfection in crowded conditions, or both factors. The consistency of the peak mortality risk at ages 24–26 years in the full analysis of men and women, however, suggests that factors other than military crowding contributed to the age-based risk profile in Kentucky and other civilian settings [14].
Several locations in the United States and Europe reported outbreaks of respiratory disease during February–August 1918 that have been speculated to be associated with early pandemic virus activity [4, 9, 10, 46]. We identified a 2–3-fold elevation over baseline in mortality due to respiratory conditions among young Kentucky adults in April 1918 (data not shown and Supplementary Figure 3). However, the low overall number of deaths and the lack of long-term historical records available for comparison precluded association of this spring outbreak to specific respiratory pathogens.
The atypically young age distribution of influenza-related deaths in the recent 2009 pandemic of influenza A virus subtype H1N1 infection was more reminiscent of the 1918–1919 pandemic than of later pandemics [35, 47–49]. Comparison of the age-based mortality risk profiles of the 2 pandemics, however, reveals substantial differences, most notably a peak among adults aged 50–64 years in 2009 (Supplementary Materials and Figure 6). These differences lend further support to biological hypotheses that are unique to the 1918 virus and its historical context. Further comparisons of age-based mortality profiles across pandemics putatively associated with antigenic recycling would be interesting but would require mortality data stratified by individual year of birth.
Figure 6.

Comparison of the age patterns of influenza-related deaths during the fall 1918 pandemic in Kentucky and the 2009 pandemic in the United States. Mortality rates for the 2009 pandemic (red curve) are based on reports of laboratory-confirmed deaths in US states during August 2009–March 2010 [49]. Mortality rates for the 1918 pandemic (blue curve) are based on excess respiratory deaths in Kentucky, subtracting observed death rates during October–December 1918 from observed death rates during the same months of baseline years 1913–1914.
Several caveats are worth noting in our study. Kentucky had a relatively large population in 1918 (2.4 million), which is appropriate for estimation of mortality associated with severe events such as the 1918–1919 pandemic. However, it is harder to quantify the impact of more moderate epidemics, such as the spring 1918 outbreak of respiratory disease Despite our relatively crude approach to estimating excess mortality, which used information from 1913–1914 as a baseline, we focused on the specific months of 1918–1919 when pandemic activity was most intense, limiting the potential for overestimation. Furthermore, a sensitivity analysis with a traditional seasonal Serfling approach yielded very similar excess mortality estimates. Additionally, our excess mortality estimates for Kentucky are highly consistent with those reported for other locations [2, 4, 9, 10, 23]. It should also be noted that age-specific excess mortality rates reflect both age-specific incidence and age-specific case-fatality rates, neither of which are known for Kentucky. This may be problematic in comparing the 1918–1919 pandemic with the background period of 1913–1914, because age-specific morbidity and potentially case-fatality data could differ in seasonal outbreaks because of residual population immunity.
Perhaps the most serious caveat in our analysis relates to the unknown number of soldiers from out of state who were training at Camp Taylor and the unknown number of soldiers from Kentucky who were training elsewhere or were involved in combat during the pandemic. Thus, our estimates of excess mortality rates among young adult males should be considered approximations of the true death patterns, with the main analysis relying on the entire mortality database providing an upper bound for mortality and the sensitivity analyses limited to Kentucky residents and civilians providing lower bounds. Most importantly, our estimates among females are unaffected by war-related displacements and likely reflect the most reliable profile of pandemic mortality risk by age so far. Finally, our analysis is exclusively limited to mortality data and does not allow quantification of influenza-associated morbidity patterns, which would be useful to evaluate mechanisms involving prior immunity, contact patterns, and underlying risk factors.
In conclusion, the data from Kentucky allow a more precise characterization of the age-specific mortality risk associated with the 1918–1919 pandemic than has been provided by other data sets. We identified a steep increase in influenza-related mortality rates between ages 9–10 and 24–26 years, which were 2–3 times more pronounced in fall 1918 than in winter 1919. Age breakpoints in mortality risks were similar among men and women but did not strictly correspond to known dates of past pandemic events. Increased risk of influenza-related death in young adult men could be explained in part by bacterial colonization epidemics in military camps [6, 38, 43], but the risk profile for women suggests that factors other than crowding in military camps were at play. Additional studies of this type in other locations could shed light on putative geographical variations in risk, while further experimental and clinical studies will help assess age- and sex-based variations in influenza immune responses [50].
Supplementary Data
Supplementary materials are available at The Journal of Infectious Diseases online (http://jid.oxfordjournals.org/). Supplementary materials consist of data provided by the author that are published to benefit the reader. The posted materials are not copyedited. The contents of all supplementary data are the sole responsibility of the authors. Questions or messages regarding errors should be addressed to the author.
Notes
Acknowledgments. We thank Marc Lipsitch and Jessica Hartman Jacobs, Harvard School of Public Health, for helpful discussions of the spline approach to identify breakpoints in mortality profile.
Financial support. This work was supported by the Fogarty International Center (in-house research program); the National Institute for Allergy and Infectious Diseases, National Institutes of Health (intramural research program); the International Influenza Unit, Office of Global Affairs, US Department of Health and Human Services (to the Fogarty International Center); and the Armed Forces Institute of Pathology (to J. K. T.).
Potential conflicts of interest. All authors: No reported conflicts.
All authors have submitted the ICMJE Form for Disclosure of Potential Conflicts of Interest. Conflicts that the editors consider relevant to the content of the manuscript have been disclosed.
References
- 1.Johnson NP, Mueller J. Updating the accounts: global mortality of the 1918–20 “Spanish” influenza epidemic. Bull Hist Med. 2002;76:105–15. doi: 10.1353/bhm.2002.0022. [DOI] [PubMed] [Google Scholar]
- 2.Murray CJ, Lopez AD, Chin B, Feehan D, Hill KH. Estimation of potential global pandemic influenza mortality on the basis of vital registry data from the 1918–20 pandemic: a quantitative analysis. Lancet. 2006;368:2211–8. doi: 10.1016/S0140-6736(06)69895-4. [DOI] [PubMed] [Google Scholar]
- 3.Miller MA, Viboud C, Balinska M, Simonsen L. The signature features of influenza pandemics—implications for policy. N Engl J Med. 2009;360:2595–8. doi: 10.1056/NEJMp0903906. [DOI] [PubMed] [Google Scholar]
- 4.Andreasen V, Viboud C, Simonsen L. Epidemiologic characterization of the 1918 influenza pandemic summer wave in Copenhagen: implications for pandemic control strategies. J Infect Dis. 2008;197:270–8. doi: 10.1086/524065. [DOI] [PMC free article] [PubMed] [Google Scholar]
- 5.Jordan EO. Epidemic influenza. Chicago: American Medical Association; 1927. [Google Scholar]
- 6.Morens DM, Taubenberger JK, Fauci AS. Predominant role of bacterial pneumonia as a cause of death in pandemic influenza: implications for pandemic influenza preparedness. J Infect Dis. 2008;198:962–70. doi: 10.1086/591708. [DOI] [PMC free article] [PubMed] [Google Scholar]
- 7.Brundage JF, Shanks GD. Deaths from bacterial pneumonia during 1918–19 influenza pandemic. Emerg Infect Dis. 2008;14:1193–9. doi: 10.3201/eid1408.071313. [DOI] [PMC free article] [PubMed] [Google Scholar]
- 8.Morens DM, Fauci AS. The 1918 influenza pandemic: insights for the 21st century. J Infect Dis. 2007;195:1018–28. doi: 10.1086/511989. [DOI] [PubMed] [Google Scholar]
- 9.Olson DR, Simonsen L, Edelson PJ, Morse SS. Epidemiological evidence of an early wave of the 1918 influenza pandemic in New York City. Proc Natl Acad Sci U S A. 2005;102:11059–63. doi: 10.1073/pnas.0408290102. [DOI] [PMC free article] [PubMed] [Google Scholar]
- 10.Chowell G, Viboud C, Simonsen L, Miller MA, Acuna-Soto R. Mortality patterns associated with the 1918 influenza pandemic in Mexico: evidence for a spring herald wave and lack of preexisting immunity in older populations. J Infect Dis. 2010;202:567–75. doi: 10.1086/654897. [DOI] [PMC free article] [PubMed] [Google Scholar]
- 11.Chowell G, Viboud C, Simonsen L, et al. The 1918–19 influenza pandemic in Boyaca, Colombia. Emerg Infect Dis. 2012;18:48–56. doi: 10.3201/eid1801.101969. [DOI] [PMC free article] [PubMed] [Google Scholar]
- 12.Chowell G, Viboud C, Simonsen L, et al. The 1918–1920 influenza pandemic in Peru. Vaccine. 2011;29:B21–6. doi: 10.1016/j.vaccine.2011.02.048. [DOI] [PMC free article] [PubMed] [Google Scholar]
- 13.Erkoreka A. The Spanish influenza pandemic in occidental Europe (1918–1920) and victim age. Influenza Other Respi Viruses. 2010;4:81–9. doi: 10.1111/j.1750-2659.2009.00125.x. [DOI] [PMC free article] [PubMed] [Google Scholar]
- 14.Collins S. Age and sex incidence of influenza and pneumonia morbidity and mortality in the epidemic of 1928–9 with comparative data for the epidemic of 1918–19. Pub Health Rep. 1931;46:1909–37. [Google Scholar]
- 15.Taubenberger JK, Reid AH, Lourens RM, Wang R, Jin G, Fanning TG. Characterization of the 1918 influenza virus polymerase genes. Nature. 2005;437:889–93. doi: 10.1038/nature04230. [DOI] [PubMed] [Google Scholar]
- 16.Tumpey TM, Basler CF, Aguilar PV, et al. Characterization of the reconstructed 1918 Spanish influenza pandemic virus. Science. 2005;310:77–80. doi: 10.1126/science.1119392. [DOI] [PubMed] [Google Scholar]
- 17.Kash JC, Tumpey TM, Proll SC, et al. Genomic analysis of increased host immune and cell death responses induced by 1918 influenza virus. Nature. 2006;443:578–81. doi: 10.1038/nature05181. [DOI] [PMC free article] [PubMed] [Google Scholar]
- 18.Kobasa D, Jones SM, Shinya K, et al. Aberrant innate immune response in lethal infection of macaques with the 1918 influenza virus. Nature. 2007;445:319–23. doi: 10.1038/nature05495. [DOI] [PubMed] [Google Scholar]
- 19.Monsalvo AC, Batalle JP, Lopez MF, et al. Severe pandemic 2009 H1N1 influenza disease due to pathogenic immune complexes. Nat Med. 2011;17:195–9. doi: 10.1038/nm.2262. [DOI] [PMC free article] [PubMed] [Google Scholar]
- 20.Palese P. Influenza: old and new threats. Nat Med. 2004;10(12 Suppl):S82–7. doi: 10.1038/nm1141. [DOI] [PubMed] [Google Scholar]
- 21.Taubenberger JK, Kash JC. Insights on influenza pathogenesis from the grave. Virus Res. 2011;162:2–7. doi: 10.1016/j.virusres.2011.09.003. [DOI] [PMC free article] [PubMed] [Google Scholar]
- 22.Watanabe T, Kawaoka Y. Pathogenesis of the 1918 pandemic influenza virus. PLoS Pathog. 2011;7:e1001218. doi: 10.1371/journal.ppat.1001218. [DOI] [PMC free article] [PubMed] [Google Scholar]
- 23.Richard SA, Sugaya N, Simonsen L, Miller MA, Viboud C. A comparative study of the 1918–1920 influenza pandemic in Japan, USA and UK: mortality impact and implications for pandemic planning. Epidemiol Infect. 2009;137:1062–72. doi: 10.1017/S0950268809002088. [DOI] [PMC free article] [PubMed] [Google Scholar]
- 24.Lee VJ, Wong CS, Tambyah PA, Cutter J, Chen MI, Goh KT. Twentieth century influenza pandemics in Singapore. Ann Acad Med Singapore. 2008;37:470–6. [PubMed] [Google Scholar]
- 25.Mamelund SE. Geography may explain adult mortality from the 1918–20 influenza pandemic. Epidemics. 2011;3:46–60. doi: 10.1016/j.epidem.2011.02.001. [DOI] [PubMed] [Google Scholar]
- 26.Saglanmak N, Andreasen V, Simonsen L, Mølbak K, Miller MA, Viboud C. Gradual changes in the age distribution of excess deaths in the years following the 1918 influenza pandemic in Copenhagen: using epidemiological evidence to detect antigenic drift. Vaccine. 2011;29:B42–8. doi: 10.1016/j.vaccine.2011.02.065. [DOI] [PMC free article] [PubMed] [Google Scholar]
- 27.US Department of War. MW Ireland, ed. Annual reports of the Secretary of War. Vol. 1. Pt. 2 (Report of the Surgeon General). Washington, DC: Secretary of War. 1919. Table 265. In: 1947. [Google Scholar]
- 28.Department of Commerce, Bureau of the Census. Washington, DC: US Government Printing Offices; 1913. Thirteenth census of the United States. Volume I. Population 1910. [Google Scholar]
- 29.Department of Commerce, Bureau of the Census. Washington, DC: US Government Printing Offices; 1922. Fourteenth census of the United States. Volume III. Population 1920. [Google Scholar]
- 30.Serfling R. Methods for current statistical analysis of excess pneumonia-influenza deaths. Public Health Rep. 1963;78:494–506. [PMC free article] [PubMed] [Google Scholar]
- 31.Francis T. Influenza: the newe acquayantance. Ann Intern Med. 1953;39:203–21. doi: 10.7326/0003-4819-39-2-203. [DOI] [PubMed] [Google Scholar]
- 32.Hancock K, Veguilla V, Lu X, et al. Cross-reactive antibody responses to the 2009 pandemic H1N1 influenza virus. N Engl J Med. 2009;361:1945–52. doi: 10.1056/NEJMoa0906453. [DOI] [PubMed] [Google Scholar]
- 33.Masurel N, Marine WM. Recycling of Asian and Hong Kong influenza A virus hemagglutinins in man. Am J Epidemiol. 1973;97:44–9. doi: 10.1093/oxfordjournals.aje.a121483. [DOI] [PubMed] [Google Scholar]
- 34.Simonsen L, Reichert TA, Miller MA. The virtues of antigenic sin: consequences of pandemic recycling on influenza-associated mortality. Yoshihiro Kawaoka, ed. Options for the Control of Influenza V. International Congress Series 1263; Elsevier: Amsterdam; 2003. pp. 791–4. [Google Scholar]
- 35.Chowell G, Bertozzi SM, Colchero MA, et al. Severe respiratory disease concurrent with the circulation of H1N1 influenza. N Engl J Med. 2009;367:674–9. doi: 10.1056/NEJMoa0904023. [DOI] [PubMed] [Google Scholar]
- 36.de Jong MD, Simmons CP, Thanh TT, et al. Fatal outcome of human influenza A (H5N1) is associated with high viral load and hypercytokinemia. Nat Med. 2006;12:1203–7. doi: 10.1038/nm1477. [DOI] [PMC free article] [PubMed] [Google Scholar]
- 37.Shanks GD, Brundage JF. Pathogenic responses among young adults during the 1918 influenza pandemic. Emerg Infect Dis. 2012;18:201–7. doi: 10.3201/eid1802.102042. [DOI] [PMC free article] [PubMed] [Google Scholar]
- 38.Morens DM, Taubenberger JK. 1918 influenza, a puzzle with missing pieces. Emerg Infect Dis. 2012;18:332–5. doi: 10.3201/eid1802.111409. [DOI] [PMC free article] [PubMed] [Google Scholar]
- 39.Patterson KD. Pandemic influenza 1700–1900. Totowa NJ: Rowman & Littlefield; 1986. [Google Scholar]
- 40.Valtat S, Cori A, Carrat F, Valleron AJ. Age distribution of cases and deaths during the 1889 influenza pandemic. Vaccine. 2011;29(Suppl 2):B6–10. doi: 10.1016/j.vaccine.2011.02.050. [DOI] [PubMed] [Google Scholar]
- 41.Ahmed R, Oldstone MB, Palese P. Protective immunity and susceptibility to infectious diseases: lessons from the 1918 influenza pandemic. Nat Immunol. 2007;8:1188–93. doi: 10.1038/ni1530. [DOI] [PMC free article] [PubMed] [Google Scholar]
- 42.Brundage JF. Interactions between influenza and bacterial respiratory pathogens: implications for pandemic preparedness. Lancet Infect Dis. 2006;6:303–12. doi: 10.1016/S1473-3099(06)70466-2. [DOI] [PMC free article] [PubMed] [Google Scholar]
- 43.Sheng ZM, Chertow DS, Ambroggio X, et al. Autopsy series of 68 cases dying before and during the 1918 influenza pandemic peak. Proc Natl Acad Sci U S A. 2011;108:16416–21. doi: 10.1073/pnas.1111179108. [DOI] [PMC free article] [PubMed] [Google Scholar]
- 44.Dunn FL. Epidemiologic studies of pandemic influenza in a Louisiana Parish. Am J Hyg. 1959;70:351–71. doi: 10.1093/oxfordjournals.aje.a120083. [DOI] [PubMed] [Google Scholar]
- 45.Noymer A, Garenne M. The 1918 influenza epidemic's effects on sex differentials in mortality in the United States. Popul Dev Rev. 2000;26:565–81. doi: 10.1111/j.1728-4457.2000.00565.x. [DOI] [PMC free article] [PubMed] [Google Scholar]
- 46.Barry JM, Viboud C, Simonsen L. Cross-protection between successive waves of the 1918–1919 influenza pandemic: epidemiological evidence from US Army camps and from Britain. J Infect Dis. 2008;198:1427–34. doi: 10.1086/592454. [DOI] [PMC free article] [PubMed] [Google Scholar]
- 47.Fowlkes AL, Arguin P, Biggerstaff MS, et al. Epidemiology of 2009 pandemic influenza A (H1N1) deaths in the United States, April-July 2009. Clin Infect Dis. 2011;52(Suppl 1):S60–8. doi: 10.1093/cid/ciq022. [DOI] [PubMed] [Google Scholar]
- 48.Viboud C, Miller M, Olson D, Osterholm M, Simonsen L. Preliminary estimates of mortality and years of life lost associated with the 2009 A/H1N1 pandemic in the US and comparison with past influenza seasons. PLoS Curr. 2010:RRN1153. doi: 10.1371/currents.RRN1153. [DOI] [PMC free article] [PubMed] [Google Scholar]
- 49.Jhung MA, Davidson H, McIntyre A, et al. Preliminary results of 2009 pandemic influenza surveillance in the United States using the Aggregate Hospitalization and Death Reporting Activity. Influenza Other Respi Viruses. 2011;5:321–7. doi: 10.1111/j.1750-2659.2011.00230.x. [DOI] [PMC free article] [PubMed] [Google Scholar]
- 50.Klein SL, Passaretti C, Anker M, Olukoya P, Pekosz A. The impact of sex, gender and pregnancy on 2009 H1N1 disease. Biol Sex Differ. 2010;1:5. doi: 10.1186/2042-6410-1-5. [DOI] [PMC free article] [PubMed] [Google Scholar]
Associated Data
This section collects any data citations, data availability statements, or supplementary materials included in this article.