

Abstract
An anticorrelated interaction between the dorsal attention and the default-mode networks has been observed, although how these 2 networks establish such relationship remains elusive. Behavioral studies have reported the emergence of attention and default network–related functions and a preliminary competing relationship between them at early infancy. This study attempted to test the hypothesis—resting-state functional magnetic resonance imaging will demonstrate not only improved network synchronization of the dorsal attention and the default networks, respectively, during the first 2 years of life but also an anticorrelated network interaction pattern between the 2 networks at 1 year which will be further enhanced at 2 years old. Our results demonstrate that both networks start from an isolated region in neonates but evolve to highly synchronized networks at 1 year old. Paralleling the individual network maturation process, the anticorrelated behaviors are absent at birth but become apparent at 1 year and are further enhanced during the second year of life. Our studies elucidate not only the individual maturation process of the dorsal attention and default networks but also offer evidence that the maturation of the individual networks may be needed prior exhibiting the adult-like interaction patterns between the 2 networks.
Keywords: anticorrelation, brain development, fMRI, functional connectivity, resting state
Introduction
Recent resting-state functional magnetic resonance imaging (rs-fMRI) studies (Biswal et al. 1995; Fox et al. 2005; Vincent et al. 2008) have revealed an interesting anticorrelated behavior between the default-mode network (Shulman et al. 1997; Raichle et al. 2001) and the dorsal attention network (Corbetta and Shulman 2002) in adults. This observed opposing relationship appears consistent with their contrasting neural functions. The default network is commonly accepted as the neural network that underlies internal and self-related thinking process (Buckner et al. 2008), while the dorsal attention network governs external and attention-demanding cognitive functions (Corbetta and Shulman 2002). This opposing pattern likely reflects an important feature of brain's network interaction (Uddin et al. 2008) that is essential for normal brain functioning. Specifically, the existence of such anticorrelation during resting has been postulated as “a recurring switch between an introspective versus an extrospecively oriented state-of-mind” (Fransson 2005). Consistently, we and others have reported the importance of this anticorrelation during the switching of contrasting task domains (Spreng et al. 2010; Gao and Lin 2012). Moreover, Kelly et al. (2008) reported that the strength of this anticorrelation is directly correlated with task performance. Together, these findings strongly support the organizational and behavioral significance of this network-level competing relationship. However, it is unclear how this relationship is established during the course of brain development.
With an independent component analysis approach, we have previously demonstrated the temporal maturation processes of the default network in normal children during the first 2 years of life (Gao et al. 2009). Our results suggest that the default network topology at 1 year of age resembles an adult-like organization, consistent with the concurrent emergence of the corresponding cognitive functions (Amsterdam 1972; Fivush and Hamond 1990). Although imaging studies elucidating dorsal attention network maturation are lacking, early emergence of dorsal attention–related behaviors such as sustained attention (Haith 1980) and selective attention (Haith et al. 1988; Rothbart and Posner 2001) during the first year of life has been reported. More importantly, early sign of the competing relationship between external and internal cognitive processes appears also present behaviorally; both Harman et al. (1997) and Rothbart and Posner (2001) have reported that caregivers could soothe crying babies by reorienting them to novel stimuli after 3 months of age (e.g., a toy). However, as soon as the stimuli are removed, infants' distress returns. Coupling this behavioral evidence with our previous studies of the development of the default network (Gao et al. 2009), we hypothesize that 1) rs-fMRI will demonstrate improved network synchronization within both the dorsal attention and the default networks during the first 2 years of life and 2) a negative (anticorrelated) network interaction pattern between the 2 networks will not be present at birth but become apparent at 1 year and be further enhanced at 2 years of age. In addition, we hypothesize that the extent of this anticorrelation at different ages parallels their within-network maturation process. These hypotheses, if proven, should significantly enhance our understanding of early brain functional development, not only at the individual network level, but also at network interaction level.
Materials and Methods
Subject and Image Acquisition
The subjects in this study were part of a large study of brain development in normal and high-risk children (Gilmore et al. 2007; Gao et al. 2011; Gilmore et al. 2011). Informed consent was obtained from the parents of all participants, and the experimental protocols were approved by the Institutional Review Committee, University of North Carolina at Chapel Hill. We retrospectively identified 147 normal subjects who met the inclusion and exclusion criteria (more details in Supplementary Participants section) as well as passed the screening of image quality for minimal motion-related artifacts. The participants include 51 neonates (27 M, 23 ± 12 days [standard deviation {SD}]); 50 1 year old (27 M, 13 ± 1 months) and 46 2 years old (28 M, 24 ± 1 months). All images were acquired using a 3-T head-only MR scanner (Allegra, Siemens Medical Systems, Erlangen, Germany). A 3D magnetization prepared rapid gradient echo (MP-RAGE) sequence was used to provide anatomical images to coregister all images among subjects. The imaging parameters were as follows: repetition time (TR) = 1820 ms, echo time (TE) = 4.38 ms, inversion time = 1100 ms, 144 slices, and voxel size = 1 × 1 ×1 mm3. For the rs-fMRI, a -weighted EPI sequence was used to acquire images. The imaging parameters were as follows: TR = 2 s, TE = 32 ms, 33 slices, and voxel size =4 × 4 × 4 mm3. This sequence was repeated 150 times so as to providing time-series images.
Preprocessing
The preprocessing steps included exclusion of voxels outside of the brain using FSL (FMRIB, Oxford University, UK), time shifting, motion correction, linear trend removal, low-pass filtering (<0.08 Hz), and spatial smoothing (6-mm full-width at half-maximum Gaussian kernel). Nuisance signals from ventricles, white matter, and global signal were regressed out using linear regression (Fox et al. 2005). The first 10 time points of the rs-fMRI data were excluded to allow magnetization reaching an equilibrium condition. Subsequently, rs-fMRI data of the first available time point from each subject were coregistered to the corresponding T1-weighted MP-RAGE structural images using rigid-body alignment. To register images within each age group, longitudinal T1 images from a subject not included in this study and scanned at 3 week, 1 year, and 2 years old were selected as templates for the corresponding age groups, and an intensity-based HAMMER nonlinear registration (Shen and Davatzikos 2002) was performed to wrap each individual subject's T1 images to its age-matched template space. The transformation fields from this step were then applied to the rs-fMRI data to bring them to the template space. Registration between templates of each age group (from the longitudinal data set) and the Montreal Neurological Institute (MNI) space was also performed using 4D HAMMER registration. The transformation field obtained from this step was used to warp regions of interest (ROIs) defined in MNI coordinate, as described below, to each age group's template space.
Functional Connectivity Map and ROI-Based Analysis
Spherical seed regions (with a radius of 8 mm) of the posterior cingulate cortex (PCC) (MNI coordinate: 1, −55, 17) and the left intraparietal sulcus (IPS) (−27, −52, 57) in the MNI template space were chosen for the default and dorsal attention networks (Fox et al. 2005), respectively, which were then warped back to each group's template space to serve as age-specific ROIs. The average time series were calculated from each seed region for each individual subject and correlated with all voxels in the whole brain to define the functional connectivity map of each network. The correlation values were Fisher-Z transformed. Two-tailed t-test was subsequently performed for each voxel at the group level to determine whether it is significantly different from zero (P < 0.05 after false discovery rate [FDR] correction; Benjamini and Yekutieli 2001, cluster size > 10 voxels). To further determine whether the choice of seed regions may introduce biases in the construction of network topology, functional connectivity maps obtained using other seed regions were also obtained (medial prefrontal cortex, MPFC [0, 51, −7] for the default network and right IPS [24, −56, 55] as well as bilateral middle temporal, MT [−45, −69, −2; 50, −69, −3] for the dorsal attention network).
After constructing the functional connectivity maps, an ROI-based functional connectivity analysis was further performed to quantitatively examine the multivariate relationship among the functional regions of the 2 networks. Specifically, the functional connectivity maps of both the dorsal attention and the default networks were warped to the MNI space based on the transformation fields obtained from the 4D registration step as outlined above. Subsequently, for each positively correlated region in the 2 networks, a sphere (8 mm radius) centered at the local peak was defined in the MNI space and warped back to each individual groups' template space to serve as an ROI. These steps were needed so as to reducing biases resulting from 1) the different brain sizes of the 3 age groups and 2) the volume differences of the connected regions among the age groups since neonates tend to have large and diffusive connected regions when compared with 1 year and 2 years old (Gao et al. 2009). The defined ROIs for each age group (3 in neonates—2/1 for dorsal attention/default, 15 in 1 year old—6/9 for dorsal attention/default, and 13 in 2 years old—4/9 for dorsal attention/default) are labeled in Figure 1.
Figure 1.

Functional connectivity maps for the default and dorsal attention networks in neonates (a), 1 year old (b), and 2 years old (c), respectively. The right column shows the composite maps of the spatial relationship between the default and dorsal attention networks. The brain regions of the default network are shown in green, dorsal attention in yellow, and the overlapped regions in red, respectively. The color bar represents the correlation values of images shown in the left and middle columns.
Trajectories of Connection Strength
Through the developmental processes, the brain functional topologies are most likely dissimilar in different age groups, making it difficult to compare the individual connections across different age groups. In order to quantitatively evaluate the growth trajectories of each connection within the 2 networks, with the exception of the bilateral anterior prefrontal cortex (APFC) regions in 1 year olds' dorsal attention network, the missing ROIs in neonates were warped from those in 1 year old. The exclusion of the APFC for this analysis is justified since it is absent in 2 years old and is not typically included in adult dorsal attention network (Fox et al. 2005; Vincent et al. 2008). The ROIs defined in 2 years old are highly consistent with those in 1 year old and were used for this group for the growth trajectory analysis.
After defining the ROIs, the mean time course was again extracted from each ROI and correlated with each other to construct a correlation matrix for each subject. After Fisher's z-transform and averaging across all subjects, group mean matrices were obtained for each age group. Subsequently, nonparametric rank-sum test was used to test the significant growth effect (by comparing across different age groups, P < 0.05, FDR correction; Benjamini and Yekutieli 2001) of individual functional connections within and between the 2 functional networks to delineate their growth trajectories.
As outlined above, although a peak-based ROI approach was employed to minimize potential biases introduced by volume differences across different age groups, results using the entire regions were also obtained. Moreover, to determine whether the global signal regression alters our conclusions regarding the growth trajectories of individual connections (Fox et al. 2009; Murphy et al. 2009), identical analyses as that outlined above were also conducted without global signal regression for both sets of ROIs (i.e., peak ROIs and whole ROIs).
Results
The functional connectivity maps (P < 0.05, FDR corrected) of the default and dorsal attention networks are presented in Figure 1 where the PCC and left IPS were used as the seed regions for the 2 networks, respectively. Both network topologies experience dramatic development during the first 2 years of life. Each starts from a large diffuse blob around the designated seed region in neonates, followed by dramatic topological changes at 1 year of age. For the default network, a spatially distributed and adult-like architecture is observed in 1 year old, which includes PCC, MPFC, l/r posterior inferior parietal lobule (PIPL), l/r hippocampus formation (HF), l/r lateral temporal cortex (LTC) areas, and primary visual area (PVA), highly consistent with that reported in our previous studies with a different data analysis approach (Gao et al. 2009). A similar developmental pattern is also observed for the dorsal attention network. The IPS regions become much more spatially localized at 1 year of age compared with the diffusive blobs in neonates and show an adult-like bilateral symmetric topology (Fox et al. 2005; Vincent et al. 2008). In addition, bilateral MT areas, an important region in the adult dorsal attention network (Fox et al. 2005; Vincent et al. 2008), and bilateral APFC areas are also present. Except the frontal eye field (Fox et al. 2005; Vincent et al. 2008), the dorsal attention network in 1 year old also demonstrates a spatially distributed and partially adult-like topology (Fox et al. 2005; Vincent et al. 2008).
In contrast to the dramatic developmental processes of the 2 networks during the first year of life, topological changes during the second year of life are less dramatic (Fig. 1c). One notable change in the dorsal attention network is that bilateral APFC connections are no longer present at 2 years old. Table 1 summarizes the brain regions both consistent (red) and inconsistent (black) with that observed in adults for each network at different ages. Overall, the topological representations of the 2 networks during the first 2 years of life strongly support our hypothesis that a significant improvement of both the default and the dorsal attention networks toward adult-like topologies occurs during the first year of life.
Table 1.
Brain regions significantly positive and negative correlated with the seed regions for the dorsal attention and default networks
| Neonates | 1 year old | 2 years old | |
| Dorsal attention (IPS) | l/r IPS | l/r IPS | l/r IPS |
| l/r MT | l/r MT | ||
| l/r APFC | |||
| Default (PCC) | PCC | PCC, MPFC, l/r HF, l/r LTC, l/r PIPL, PVA | PCC, MPFC, l/r HF, l/r LTC, l/r PIPL, PVA |
| Anti-dorsal attention | None | MPFC, PCC, l/r HF | MPFC, PCC, l/r HF, l/r PIPL, l/r LTC |
| Anti-Default | None | l/r IPS, l/r MT | l/r IPS, l/r MT |
Note: Regions consistent/inconsistent with typically reported ones in adults are labeled in red/black, respectively. Anticorrelated regions are labeled in blue.
In order to determine whether or not the choices of the seed regions for the dorsal attention and default networks may lead to different topologies, results using MPFC and rIPS/MT as the seed regions for the default and dorsal attention networks, respectively, are provided in the Supplementary Figure S1. With the exception of the neonate group where the topologies are highly dependent on the seeds (i.e., functionally connected areas are restricted to the vicinity of the selected seed regions), highly consistent topologies with that provided in Figure 1 are observed regardless of choice of seed location for 1 year and 2 years old. These findings further suggest that coherent network structures are absent in neonates for both networks but become well established in 1 year and 2 years old. One interesting finding is the extensive spatial overlap between the 2 networks at birth (the overlapped volume account for 39.0% of the union of the volume of the 2 networks) (Fig. 1a, right column). This extensive spatial overlap substantially reduces at 1 year of age (1.32%) and further decreases to 0.45% at 2 years of age, suggesting dramatic functional specialization of these 2 networks during the first 2 years of life.
To more quantitatively assess the age-dependent changes of connection strengths, the growth trajectories of individual connections as well as the mean connection strength of the dorsal attention (Fig. 2a,b) and default networks (Fig. 2c,d) are shown in Figure 2, respectively. All connections in the dorsal attention network show significantly increased connection strengths from neonates to 1 year old, followed by minimal changes from 1 year to 2 years of age. For default network, of the 36 available connections, 29 exhibit significantly increased connection strengths from neonates to 1 year of age. Moreover, 8 connections, including PCC-MPFC, MPFC-l/rPIPL, MPFC-PVA, l/rHF-rPIPL, rHF-lHF, and rLTC-lHF, continue to experience significant growth during the second year of life (Fig. 2c). Overall, the mean network connection growth of the 2 networks during the first 2 years is similar—a significant increase during the first year of life (red asterisks, P = 3.9 × 10⁻⁷ for dorsal attention and P = 4.5 × 10⁻⁶ for default), followed by minimal changes during the second year of life (Fig. 2b,d). The connections exhibiting statistically increased connection strengths are summarized in Table 2.
Figure 2.

The temporal characteristics of functional connection strengths within the dorsal attention and default networks. (a) Growth trajectories of the individual functional connections in the dorsal attention network. Red lines indicate significant increase (P < 0.05, FDR corrected), while black lines represent nonsignificant changes; (b) the mean network connection strength in neonates, 1 year, and 2 years old for the dorsal attention network (red asterisk, P = 3.9 × 10⁻⁷); (c) growth trajectories of the individual functional connections in the default network with an identical arrangement as that in (a); (d) the mean network connection strength in neonates, 1 year, and 2 years old for the default network (red asterisk, P = 4.5 × 10⁻⁶). All whiskers represent standard error of the mean.
Table 2.
Connections exhibiting significantly increased strengths in the dorsal attention and default networks during the first 2 years of life
| Dorsal attention | Default | |
| From neonates to 1 year old | rIPS-lIPS, lMT-lIPS, rMT-lIPS, lMT-rIPS, rMT-rIPS, rMT-lMT | PCC-lPIPL; PCC-rPIPL; PCC-MPFC; PCC-lHF; PCC-rHF; PCC-lLTC; PCC-rLTC; PCC-PVA; rPIPL-lPIPL; MPFC-lPIPL, rHF-lPIPL, lLTC-lPIPL, rLTC-lPIPL, MPFC-rPIPL, rHF-rPIPL, lLTC-rPIPL, rLTC-rPIPL, lHF-MPFC, rHF-MPFC, lLTC-MPFC, rLTC-MPFC, PVA-MPFC, rHF-lHF, rLTC-lHF, lLTC-rHF, PVA-rHF, rLTC-lLTC, PVA-lLTC, PVA-rLTC |
| From 1 year to 2 years old | None | PCC-MPFC, MPFC-lPIPL, MPFC-rPIPL, lHF-rPIPL, rHF-rPIPL, PVA-MPFC, rHF-lHF, rLTC-lHF |
While the topologies and connection strengths of the default and dorsal attention networks undergo substantial temporal changes during the first 2 years of life, the interaction patterns between the 2 networks reveal unique insights into the maturation process. Figure 3 shows brain regions exhibiting negative correlation with respect to the predefined seeds in the dorsal attention (lIPS) and default (PCC) networks, respectively. Notice there are no significantly anticorrelated regions for either network in neonates (therefore neonates' maps are not shown in the figure), but widespread negatively correlated regions (blue regions) are observed in 1 year and 2 years old for the lIPS (dorsal attention, Fig. 3a) and the PCC (default network, Fig. 3b) seed regions, respectively. More importantly, the negatively correlated regions with respect to the lIPS seed resemble brain regions in the default network and vice versa. To better delineate this relationship, the composite maps containing the anticorrelated regions with lIPS seed (coral), the default network (lime), and the overlap regions (red) are shown in Figure 3c for 1 year and 2 years old. Similarly, the anticorrelated regions with PCC seed (lime), the dorsal attention network (coral), and the overlap regions (red) are shown in Figure 3d. Notice the anticorrelated regions with the lIPS significantly overlap with the default network at 1 year of age, including the MPFC, PCC, and bilateral HF areas (left column; Fig. 3c). Conversely, the anticorrelated regions with PCC overlap with the dorsal attention network, which cover bilateral MT and IPS areas (left column; Fig. 3d). A summary of the anticorrelated regions of the 2 networks is provided in Table 1. The anticorrelated behavior appears further augmented at 2 years of age. The anticorrelated regions with lIPS seed (dorsal attention network) overlap even more extensively with the default network; new overlap regions include the bilateral LTC as well as PIPL areas, and the extent of spatial overlap in MPFC and PCC becomes more extensive. This increasing trend of overlap as a function of age is evident in the calculated overlapping ratio (right column; Fig. 3c), which increases from 11.9% in 1 year old to 22.9% in 2 years old. Similarly, the anticorrelated regions with the PCC seed (default network) also overlap more extensively with the dorsal attention network, especially in the superior parietal areas (IPS). However, the overlapping ratio experiences a relatively moderate increase from 11.5% in 1 year old to 16.4% in 2 years old (right column; Fig. 3d). These findings demonstrate the presence of the anticorrelated behaviors between the 2 networks in 1 year old, which become further augmented in the second year of life.
Figure 3.

Conjunction analyses of the anticorrelated maps between the dorsal attention and default networks. (a) Anticorrelated regions with the lIPS seed (dorsal attention network) in 1 year and 2 years old; (b) anticorrelated map with the PCC seed (default network) in 1 year and 2 years old; The color bar represents the correlation values of images shown in the (a) and (b); (c) overlap (red) between the anticorrelated map of dorsal attention (Anti-Dorsal attention, coral) and the default network (Default, lime); (d) overlap (red) between the dorsal attention (coral) and anticorrelated map of default (Anti-default, lime). The corresponding volume ratios are shown in the right-most column of (c) and (d), which were calculated as the ratios of the overlapped volume over the volume of union of the 2 composite maps (Anti-Dorsal attention + Default or Dorsal attention+ Anti-Default).
Consistent with the findings shown in Figure 3, the connection strengths of individual connections (based on the same ROIs as used in Fig. 2) between the 2 networks decrease and become negative from neonates to 2 years of age (Fig. 4). Specifically, of the 36 possible connections (4 ROIs in dorsal attention and 9 ROIs in default), 25 connections exhibit significant decreases in strengths from neonates to 1 year old (blue lines, Fig. 4a) and 5 connections (including lPIPL-lMT, rPIPL-lMT, rLTC-lMT, rLTC-lIPS, and rPIPL-rMT) continue to decrease in the second year. While 2 connections (between l/rIPS and rHF) show slight increase in the second year, they remain significantly negative (P = 1.0 × 10⁻⁶ for lIPS-rHF and P = 1.3 × 10⁻⁵ for rIPS-rHF). The connections showing significantly changed strengths between the 2 networks are summarized in Table 3. The mean network interaction strengths are presented in Figure 4b, demonstrating that the interaction strengths start from positive in neonates and significantly decrease (P = 4.3 × 10⁻⁷, red asterisk) to negative at 1 year of age and remain negative at 2 years of age.
Figure 4.
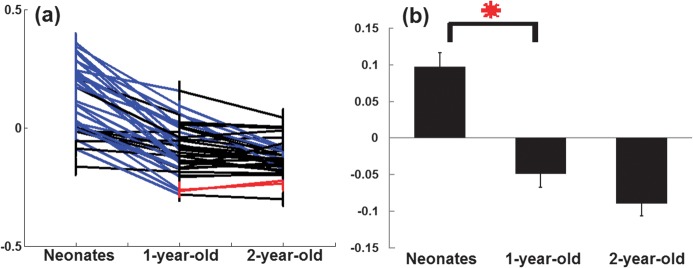
The temporal characteristics of functional connection strengths of the interaction between the dorsal attention and default networks. (a) Growth trajectories of individual between-network connections. Red/blue colors indicate significant (P < 0.05, FDR corrected) increase/decrease of interaction strength, respectively, while black color represents nonsignificant changes; (b) changes of mean interaction strength (red asterisk represents statistically significant change (P < 0.05, FDR corrected)). All whiskers represent standard error of the mean.
Table 3.
Interactions between dorsal attention and default networks exhibiting significant changes during the first 2 years of life
| Decreasing connections | Increasing connections | |
| From neonates to 1 year old | PCC-lIPS, lPIPL-lIPS, rPIPL-lIPS, MPFC-lIPS, lHF-lIPS, rHF-lIPS, lLTC→lIPS, PVA-lIPS, rPIPL-rIPS, lHF-rIPS, rHF-rIPS, PCC-lMT, lPIPL-lMT, lHF-lMT, rHF-lMT, lLTC-lMT, PVA-lMT, PCC-rMT, lPIPL-rMT, rPIPL-rMT, MPFC-rMT, lHF-rMT, rHF-rMT, rLTC-rMT, PVA-rMT | None |
| From 1 year to 2 years old | lPIPL-lMT, rPIPL-lMT, rLTC-lMT, rLTC-lIPS, rPIPL-rMT | lIPS-rHF, rIPS-rHF |
Note: Significantly increased connections are in red and significantly decreased connections are in blue.
Results obtained using the whole regions rather than peak ROIs as well as those obtained without global signal regression are shown in Supplementary Figures S2–S4. With the exception of an apparent shift toward a positive connection strength distribution in the absence of global signal regression (Supplementary Fig. S2), the connectivity patterns at each age group (Supplementary Fig. S3) as well as the growth trajectories associated with individual connections (Supplementary Fig. S4) are highly consistent with the results reported in the main text. Moreover, by first averaging the within- and between-network connection strengths in each subject and plotting the resulting mean connection strength against each subject's actual age (Supplementary Fig. S5), the resulting patterns are also highly similar to those shown in Figures 2 and 4.
Discussion
Behavioral studies have documented the emergence of cognitive functions associated with the dorsal attention and default networks (Amsterdam 1972; Haith et al. 1988; Fivush and Hamond 1990; Rothbart and Posner 2001) as well as the potential interaction between the external (related to dorsal attention) and internal (related to default network) cognitive processes (Harman et al. 1997; Rothbart and Posner 2001) in early infancy. With a large cohort of normal pediatric subjects aged between 3 weeks and 2 years old and using rs-fMRI, this study tested the hypotheses that 1) rs-fMRI will demonstrate improved network synchronization for both the dorsal attention and the default networks during the first 2 years of life and 2) a negative network interaction pattern between the dorsal attention and default networks will not be present at birth but become apparent at 1 year and be further enhanced at 2 years of age. Our results confirmed both hypotheses and revealed an interesting interplay between individual network orchestration and between-network interaction.
An extensive modification of network topologies for both the dorsal attention and the default networks is observed during the first years of life; both start from a single region centered at the seed regions in neonates and evolve to highly integrated network structures resembling that observed in adults at 1 year of age. Specifically, the choice of the seed regions plays a critical role in delineating network topologies for both networks at birth (Fig. 1 and Supplementary Fig. S1). That is, the brain topology of either network highly depends on the choice of the seed (Supplementary Fig. S1), suggesting that these 2 networks are not well formed at birth. The local connectivity pattern in neonates (except for bilateral homotopic regions) observed in this study is generally consistent with previous findings in both preterm and term infants where spatially constrained connectivity patterns are also observed for different functional networks (Fransson et al. 2007, 2011; Doria et al. 2011). Conversely, consistent topologies for both the dorsal attention and the default networks are observed regardless of the seed locations in 1 year and 2 years old, implying that both have formed highly integrated network structures (Supplementary Fig. S1). Both networks continue to evolve from 1 year to 2 years of age toward adult-like dorsal attention and default networks, although the changes are much less dramatic (Fig. 1). Quantitative measurements of connection strengths in each network also exhibit a similar developmental pattern (Fig. 2). Generally, both networks show significant increases of connection strength from neonates to 1 year old, followed by minimal changes from 1 to 2 years of age. Together, our results strongly support the hypothesis that both the dorsal attention and the default networks undergo extensive improvement in overall network integration during the first year of life.
One interesting finding warrants additional discussion. As shown in Figure 1, a substantial spatial overlap at birth is observed between the regions exhibiting significant correlation with the lIPS for dorsal attention and PCC for default, respectively. The extent to which these 2 networks are spatially overlapped is dramatically reduced at 1 year and almost vanishes at 2 years of age (Fig. 1). Although the limited spatial resolution, particularly in the context of the smaller head size of neonates, may lead to partial volume effects, it is also plausible that IPS and PCC share similar functions at birth but are progressively specialized to different cognitive functions and integrated separately into the dorsal attention and default networks at 1 year of age. Behavioral assessments may be needed to further support the potential functional specialization between IPS and PCC, although it is a daunting task to conduct complex behavioral assessments at such a young age.
Our second goal was to determine the presence or absence of an anticorrelated relation between the dorsal attention and the default networks as that been observed in adult subjects (Fox et al. 2005; Vincent et al. 2008). Anticorrelated interactions are commonly interpreted as “competition” in adults (Fox et al. 2005; Kelly et al. 2008; Vincent et al. 2008) and behavioral evidence supporting the emergence of such competing relationship during early infancy also exists. Specifically, Rothbart and Posner (2001) reported that caregivers usually soothe crying babies by gently holding/rocking before the age of 3 months. After 3 months of age, many could successfully calm crying babies by reorienting them to novel stimuli (e.g., a toy). Given that crying is mainly elicited by internal processes likely governed by the default network (Gusnard et al. 2001; Wicker et al. 2003; Buckner et al. 2008; Andrews-Hanna et al. 2010), different means to intervene this process may convey important information on the underlying mechanisms. Specifically, gently holding/rocking may provide more comfort and/or feeling of security to babies, likely alleviating their uneasiness. In contrast, reorienting to novel stimuli may incur babies' improved attentional capability around 3 months of age (Haith et al. 1988; Johnson et al. 1991), which may temporarily “block” the internal emotional process and stop crying. Such a mechanism hence supports the existence of effective inhibitions between the attention process (related to dorsal attention) and the internal process (related to default) (Harman et al. 1997; Rothbart and Posner 2001). Indeed, Harman et al. (1997) showed that facial and vocal signs of distress are halted during the reorienting period, but the infant's distress returns to almost exactly the same level as soon as the new stimuli are removed. Consistent with these behavioral observations, our results reveal the absence of anticorrelated behaviors at birth but uncover a clear anticorrelated relation between the dorsal attention and the default networks at 1 year of age (Figs 3 and 4), supporting the emergence of a network-level competition mechanism during the first year of life (although the lack of 3-month data prevent us from delineating possible functional connectivity shifts around the time of corresponding behavioral changes reported in Rothbart and Posner (2001)). Interestingly, Posner and Rothbart (1998) have related such attention process to self-regulation and to a broader sense of consciousness. Consistently, Lagercrantz and Changeux (2009) have reported the gradual progress of basic consciousness, while Amsterdam (1972) has documented the emergence of self-awareness during the first year of life. Therefore, it is plausible that the findings here are also related to an elevated level of consciousness as a result of improved sensory perception, enhanced executive attention control, and increased self-awareness.
Comparing the trajectories of individual network development (Fig. 2) with the trajectories of between-network interaction (Fig. 4), a clear pattern emerges; the time period exhibiting significantly increased connection strength within the dorsal attention and default networks coincides with a significantly increased negative correlation between the 2 networks. In addition, although the polarity differs, the magnitude of changes of connection strengths within and between networks is highly comparable from neonates to 2 years of ages (Figs 2 and 4). Together, these similarities of within- and between-network interaction might suggest that the presence of integrated dorsal attention and default networks are needed for the anticorrelated behaviors between the 2 networks. More studies with a higher temporal resolution of imaging sessions (especially during the first year of life) may be needed to further determine the relationship between maturation of individual networks and between-network interaction.
Overall, the within-network synchronization and between-network opposition pattern reported in this study depicts an exciting picture of the scaffolding process of brain's network-based architecture during early brain development and invites future studies to further delineate the process by covering an extended array of functional networks. In addition to delineating normal brain development, given the reported network-level disruption in various neurodegenerative diseases (Seeley et al. 2009), such combined network-level investigation might also hold the key to unveiling the neurophysiological origins of different developmental disorders.
Underlying Neurophysiology
Although the exact neurophysiological mechanism underlying the functional connectivity changes observed here remains to be determined, several lines of research provide potential explanations. First, previous studies (Letinic et al. 2002; Tyzio et al. 2006) have documented that γ-aminobutyric acid (GABA) is the dominant excitatory neurotransmitter during fetal life but gradually switches to its classic inhibitory role during the first few postnatal months due to changes in chloride regulation (Rivera et al. 1999). The maturation of such inhibitory action of GABA and the structural development of γ-aminobutyric acidergic interneuronal circuits are essential for the maintenance of ongoing neuronal activity (Vanhatalo and Kaila 2006). Indeed, this GABA maturation process is accompanied by diminishing “discontinuous” neuronal electrical signals (characterized by transient signal “burst”) and increasing continuous oscillations in various frequency bands as observed through neonatal electroencephalography (EEG) (Buzsaki and Draguhn 2004; Steriade 2006). Such continuous oscillations are critical for various cognitive functions and undergo a steady increase until about 3 months of age to reach “a fully continuous form” (Vanhatalo and Kaila 2006). Together with the important myelination process of long axonal tracts (Haynes et al. 2005; Gao et al. 2008), all these factors likely facilitate the long-distance synchronization/opposition of ongoing neuronal oscillations from distributed neuron assembles, which is assumed to be the neuronal underpinnings of functional connectivity observed using blood oxygen level–dependent (BOLD) fMRI (Logothetis et al. 2001; Nir et al. 2007; Shmuel and Leopold 2008). In line with these changes, Chugani et al. (1987) reported that by 3 months of age, there has been a significant increase of glucose metabolism in parietal, temporal, and occipital cortices, and by approximately 6–8 months of age, there is another increase in frontal and dorsolateral occipital cortical regions. These regional glucose metabolism increases coincide well with the functional areas in the 2 networks studied here (i.e., most of the regions from the 2 networks are from parietal, temporal, and frontal lobes), indicating that increased energy consumption is needed as these regions become increasingly more functioning. Therefore, the observed synchronization within and opposition between the 2 higher order functional networks in this study likely reflect an intertwined neurophysiological process involving neurotransmitter signaling shift, electrical activity change, myelination growth, and energy consumption increase. Future studies by simultaneously measuring neural substrates and functional connectivity may be needed to gain more insights into the underlying neurophysiological mechanisms of the observed interaction patterns between the dorsal attention and default networks.
Interpretation of Negative Correlations
The interpretation of the presence of negative correlations between the default and dorsal attention networks with the global signal removal preprocessing step has been controversial (Chang and Glover 2009; Fox et al. 2009; Murphy et al. 2009). Since such regression forces the resulting correlation distribution to be bell shaped around zero, it raises questions of whether the observed anticorrelations are “introduced” by global signal removal or brought into light after removing the nuisance factors (Murphy et al. 2009). Fox et al. (2009) have shown that even after removing the 2 networks from the global signal mask (essentially eliminating the mathematical constraints on the 2 systems), certain anticorrelations still exist. In an independent study, Chang and Glover (2009) showed evidences of anticorrelations between the 2 networks both with and without controlling for independently measured physiological noise. In addition, behavioral evidence seems to also support the competing relationship between the 2 networks (Kelly et al. 2008). Together with their well-documented opposing activation pattern (Shulman et al. 1997; Corbetta and Shulman 2002), existing evidence supports the authenticity of such anticorrelations. In this study, the observed emerging negative correlation pattern between the dorsal attention and default networks appears to provide further support for their functional relevance from a developmental perspective. Specifically, in neonates, we fail to observe any significant negative correlations (even after global signal regression), consistent with the poor functional specialization reported for such young infants (Tau and Peterson 2010). Subsequently, the anticorrelated structure experiences dynamic and behaviorally sensible evolution as age grows (Figs 3 and 4), which gradually approaches its adult configuration, strongly supporting its functional relevance.
Limitations
Instead of using external monitoring devices such as photoplethysmograph and pneumatic belt to monitor cardiac and respiratory effects (Chang and Glover 2009), respectively, so as to eliminating these potential physiological confounds in rs-fMRI, global MR signal was regressed out in our study. This is due largely to the fact that utilizing photoplethysmograph and pneumatic belt tends to make it difficult for our subjects to fall in asleep. Although regressing out the global signal cannot guarantee the complete removal of physiological confounds, Chang and Glover (2009) have shown a great correspondence between the global signal and the externally monitored respiratory and cardiac signal. As a result, it is highly plausible that the majority of such physiological confounds have been substantially minimized using this regression approach. In addition, the observed within-network synchronization and between-network opposition pattern further support this expectation, or otherwise, we would expect a more globally uniform effect for possible physiological bias rather than a functionally sensible differentiation. Nevertheless, due to the retrospective nature of this technique, residual physiological confounds may still be present and deserve further investigation.
Another limitation is the lack of information on the sleep stage of each subject. Although simultaneous EEG and rs-fMRI is the optimal way to minimize potential variability resulted from different stages of sleep among subjects, as mentioned above, it is highly challenging to image nature sleep subjects with additional external monitoring devices. In order to minimize potential variability resulted from different sleep stages, all subjects were imaged as soon as they fell asleep in our study. Moreover, previous studies (Vincent et al. 2007; Horovitz et al. 2008) have provided evidence regarding the limited effects of sleep on resting BOLD. Therefore, it is highly likely that the effects of different sleep stages among subjects are minimal in our study.
Conclusions
We have documented the dramatic emergence process for the default and dorsal attention networks during the first 2 years of life. More importantly, our results reveal that the anticorrelated behaviors between the 2 networks are absent at birth but become apparent after 1 year old, which parallels the maturation of the individual networks. Our study points out that in addition to examining the synchronization of individual networks, more attention should be paid to studying the interaction patterns between networks. Such combined network-level investigation may offer new insights into the developmental processes and potentially serve as effective biomarkers for the evaluation of abnormal brain development.
Supplementary Material
Supplementary material can be found at: http://www.cercor.oxfordjournals.org/
Funding
National Institutes of Health grants (R01NS055754, MH064065, HD053000).
Supplementary Material
Acknowledgments
Conflict of Interest: None declared.
References
- Amsterdam B. Mirror self-image reactions before age two. Dev Psychobiol. 1972;5:297–305. doi: 10.1002/dev.420050403. [DOI] [PubMed] [Google Scholar]
- Andrews-Hanna JR, Reidler JS, Sepulcre J, Poulin R, Buckner RL. Functional-anatomic fractionation of the Brain's default network. Neuron. 2010;65:550–562. doi: 10.1016/j.neuron.2010.02.005. [DOI] [PMC free article] [PubMed] [Google Scholar]
- Benjamini Y, Yekutieli D. The control of the false discovery rate in multiple testing under dependency. Ann Stat. 2001;29:1165–1188. [Google Scholar]
- Biswal B, Yetkin FZ, Haughton VM, Hyde JS. Functional connectivity in the motor cortex of resting human brain using echo-planar MRI. Magn Reson Med. 1995;34:537–541. doi: 10.1002/mrm.1910340409. [DOI] [PubMed] [Google Scholar]
- Buckner RL, Andrews-Hanna JR, Schacter DL. The brain's default network: anatomy, function, and relevance to disease. Ann N Y Acad Sci. 2008;1124:1–38. doi: 10.1196/annals.1440.011. [DOI] [PubMed] [Google Scholar]
- Buzsaki G, Draguhn A. Neuronal oscillations in cortical networks. Science. 2004;304:1926–1929. doi: 10.1126/science.1099745. [DOI] [PubMed] [Google Scholar]
- Chang C, Glover GH. Effects of model-based physiological noise correction on default mode network anti-correlations and correlations. Neuroimage. 2009;47:1448–1459. doi: 10.1016/j.neuroimage.2009.05.012. [DOI] [PMC free article] [PubMed] [Google Scholar]
- Chugani HT, Phelps ME, Mazziotta JC. Positron emission tomography study of human brain functional development. Ann Neurol. 1987;22:487–497. doi: 10.1002/ana.410220408. [DOI] [PubMed] [Google Scholar]
- Corbetta M, Shulman GL. Control of goal-directed and stimulus-driven attention in the brain. Nat Rev Neurosci. 2002;3:201–215. doi: 10.1038/nrn755. [DOI] [PubMed] [Google Scholar]
- Doria V, Beckmann CF, Arichi T, Merchant N, Groppo M, Turkheimer FE, Counsell SJ, Murgasova M, Aljabar P, Nunes RG, et al. Emergence of resting state networks in the preterm human brain. Proc Natl Acad Sci U S A. 2011;107:20015–20020. doi: 10.1073/pnas.1007921107. [DOI] [PMC free article] [PubMed] [Google Scholar]
- Fivush R, Hamond NR. Autobiographical memory across the preschool years: toward reconceptualizing childhood amnesia. In: Hudson JA, Fivush R, editors. Knowing and remembering in young children. New York: Cambridge University Press; 1990. p. 223–248. [Google Scholar]
- Fox MD, Snyder AZ, Vincent JL, Corbetta M, Van Essen DC, Raichle ME. The human brain is intrinsically organized into dynamic, anticorrelated functional networks. Proc Natl Acad Sci U S A. 2005;102:9673–9678. doi: 10.1073/pnas.0504136102. [DOI] [PMC free article] [PubMed] [Google Scholar]
- Fox MD, Zhang D, Snyder AZ, Raichle ME. The global signal and observed anticorrelated resting state brain networks. J Neurophysiol. 2009;101:3270–3283. doi: 10.1152/jn.90777.2008. [DOI] [PMC free article] [PubMed] [Google Scholar]
- Fransson P. Spontaneous low-frequency BOLD signal fluctuations: an fMRI investigation of the resting-state default mode of brain function hypothesis. Hum Brain Mapp. 2005;26:15–29. doi: 10.1002/hbm.20113. [DOI] [PMC free article] [PubMed] [Google Scholar]
- Fransson P, Aden U, Blennow M, Lagercrantz H. The functional architecture of the infant brain as revealed by resting-state fMRI. Cereb Cortex. 2011;21:145–154. doi: 10.1093/cercor/bhq071. [DOI] [PubMed] [Google Scholar]
- Fransson P, Skiold B, Horsch S, Nordell A, Blennow M, Lagercrantz H, Aden U. Resting-state networks in the infant brain. Proc Natl Acad Sci U S A. 2007;104:15531–15536. doi: 10.1073/pnas.0704380104. [DOI] [PMC free article] [PubMed] [Google Scholar]
- Gao W, Gilmore JH, Giovanello KS, Smith JK, Shen D, Zhu H, Lin W. Temporal and Spatial Evolution of Brain Network Topology during the First Two Years of Life. PLoS ONE. 2011;6(9):e25278. doi: 10.1371/journal.pone.0025278. [DOI] [PMC free article] [PubMed] [Google Scholar]
- Gao W, Lin W. Frontal parietal control network regulates the anti-correlated default and dorsal attention networks. Hum Brain Mapp. 2012;33(1):192–202. doi: 10.1002/hbm.21204. [DOI] [PMC free article] [PubMed] [Google Scholar]
- Gao W, Lin W, Chen Y, Gerig G, Smith JK, Jewells V, Gilmore JH. Temporal and spatial development of axonal maturation and myelination of white matter in the developing brain. AJNR Am J Neuroradiol. 2008;30:290–296. doi: 10.3174/ajnr.A1363. [DOI] [PMC free article] [PubMed] [Google Scholar]
- Gao W, Zhu H, Giovanello KS, Smith JK, Shen D, Gilmore JH, Lin W. Evidence on the emergence of the brain's default network from 2-week-old to 2-year-old healthy pediatric subjects. Proc Natl Acad Sci U S A. 2009;106:6790–6795. doi: 10.1073/pnas.0811221106. [DOI] [PMC free article] [PubMed] [Google Scholar]
- Gilmore JH, Lin W, Prastawa MW, Looney CB, Vetsa YS, Knickmeyer RC, Evans DD, Smith JK, Hamer RM, Lieberman JA, et al. Regional gray matter growth, sexual dimorphism, and cerebral asymmetry in the neonatal brain. J Neurosci. 2007;27:1255–1260. doi: 10.1523/JNEUROSCI.3339-06.2007. [DOI] [PMC free article] [PubMed] [Google Scholar]
- Gilmore JH, Shi F, Woolson SL, Knickmeyer RC, Short SJ, Lin W, Zhu H, Hamer RM, Styner M, Shen D. Longitudinal development of cortical and subcortical gray matter from birth to 2 years. Cereb Cortex. 2011 doi: 10.1093/cercor/bhr327. [DOI] [PMC free article] [PubMed] [Google Scholar]
- Gusnard DA, Akbudak E, Shulman GL, Raichle ME. Medial prefrontal cortex and self-referential mental activity: relation to a default mode of brain function. Proc Natl Acad Sci U S A. 2001;98:4259–4264. doi: 10.1073/pnas.071043098. [DOI] [PMC free article] [PubMed] [Google Scholar]
- Haith MM. Rules that babies look by: the organization of newborn visual activity. Hillsdale (NJ): Psychology Press; 1980. [Google Scholar]
- Haith MM, Hazan C, Goodman GS. Expectation and anticipation of dynamic visual events by 3.5-month-old babies. Child Dev. 1988;59:467–479. [PubMed] [Google Scholar]
- Harman C, Rothbart MK, Posner MI. Distress and attention interactions in early infancy. Motiv Emot. 1997;21:27–43. [Google Scholar]
- Haynes RL, Borenstein NS, Desilva TM, Folkerth RD, Liu LG, Volpe JJ, Kinney HC. Axonal development in the cerebral white matter of the human fetus and infant. J Comp Neurol. 2005;484:156–167. doi: 10.1002/cne.20453. [DOI] [PubMed] [Google Scholar]
- Horovitz SG, Fukunaga M, de Zwart JA, van Gelderen P, Fulton SC, Balkin TJ, Duyn JH. Low frequency BOLD fluctuations during resting wakefulness and light sleep: a simultaneous EEG-fMRI study. Hum Brain Mapp. 2008;29:671–682. doi: 10.1002/hbm.20428. [DOI] [PMC free article] [PubMed] [Google Scholar]
- Johnson MH, Posner MI, Robacker MK. Components of visual orienting in early infancy: contingency learning, anticipatory looking and disengaging. J Cogn Neurosci. 1991;3:335–344. doi: 10.1162/jocn.1991.3.4.335. [DOI] [PubMed] [Google Scholar]
- Kelly AM, Uddin LQ, Biswal BB, Castellanos FX, Milham MP. Competition between functional brain networks mediates behavioral variability. Neuroimage. 2008;39:527–537. doi: 10.1016/j.neuroimage.2007.08.008. [DOI] [PubMed] [Google Scholar]
- Lagercrantz H, Changeux JP. The emergence of human consciousness: from fetal to neonatal life. Pediatr Res. 2009;65:255–260. doi: 10.1203/PDR.0b013e3181973b0d. [DOI] [PubMed] [Google Scholar]
- Letinic K, Zoncu R, Rakic P. Origin of GABAergic neurons in the human neocortex. Nature. 2002;417:645–649. doi: 10.1038/nature00779. [DOI] [PubMed] [Google Scholar]
- Logothetis NK, Pauls J, Augath M, Trinath T, Oeltermann A. Neurophysiological investigation of the basis of the fMRI signal. Nature. 2001;412:150–157. doi: 10.1038/35084005. [DOI] [PubMed] [Google Scholar]
- Murphy K, Birn RM, Handwerker DA, Jones TB, Bandettini PA. The impact of global signal regression on resting state correlations: are anti-correlated networks introduced? Neuroimage. 2009;44:893–905. doi: 10.1016/j.neuroimage.2008.09.036. [DOI] [PMC free article] [PubMed] [Google Scholar]
- Nir Y, Fisch L, Mukamel R, Gelbard-Sagiv H, Arieli A, Fried I, Malach R. Coupling between neuronal firing rate, gamma LFP, and BOLD fMRI is related to interneuronal correlations. Curr Biol. 2007;17:1275–1285. doi: 10.1016/j.cub.2007.06.066. [DOI] [PubMed] [Google Scholar]
- Posner MI, Rothbart MK. Attention, self-regulation and consciousness. Philos Trans R Soc Lond B Biol Sci. 1998;353:1915–1927. doi: 10.1098/rstb.1998.0344. [DOI] [PMC free article] [PubMed] [Google Scholar]
- Raichle ME, MacLeod AM, Snyder AZ, Powers WJ, Gusnard DA, Shulman GL. A default mode of brain function. Proc Natl Acad Sci U S A. 2001;98:676–682. doi: 10.1073/pnas.98.2.676. [DOI] [PMC free article] [PubMed] [Google Scholar]
- Rivera C, Voipio J, Payne JA, Ruusuvuori E, Lahtinen H, Lamsa K, Pirvola U, Saarma M, Kaila K. The K+/Cl- co-transporter KCC2 renders GABA hyperpolarizing during neuronal maturation. Nature. 1999;397:251–255. doi: 10.1038/16697. [DOI] [PubMed] [Google Scholar]
- Rothbart MK, Posner MI. Mechanism and variation in the development of attentional networks. Cambridge (MA): MIT Press; 2001. [Google Scholar]
- Seeley WW, Crawford RK, Zhou J, Miller BL, Greicius MD. Neurodegenerative diseases target large-scale human brain networks. Neuron. 2009;62:42–52. doi: 10.1016/j.neuron.2009.03.024. [DOI] [PMC free article] [PubMed] [Google Scholar]
- Shen D, Davatzikos C. HAMMER: hierarchical attribute matching mechanism for elastic registration. IEEE Trans Med Imaging. 2002;21:1421–1439. doi: 10.1109/TMI.2002.803111. [DOI] [PubMed] [Google Scholar]
- Shmuel A, Leopold DA. Neuronal correlates of spontaneous fluctuations in fMRI signals in monkey visual cortex: implications for functional connectivity at rest. Hum Brain Mapp. 2008;29:751–761. doi: 10.1002/hbm.20580. [DOI] [PMC free article] [PubMed] [Google Scholar]
- Shulman GLFJ, Corbetta M, Buckner RL, Miezin FM. Common blood flow changes across visual tasks: II: decreases in cerebral cortex. J Cogn Neurosci. 1997;9:648–663. doi: 10.1162/jocn.1997.9.5.648. [DOI] [PubMed] [Google Scholar]
- Spreng RN, Stevens WD, Chamberlain JP, Gilmore AW, Schacter DL. Default network activity, coupled with the frontoparietal control network, supports goal-directed cognition. Neuroimage. 2010;53:303–317. doi: 10.1016/j.neuroimage.2010.06.016. [DOI] [PMC free article] [PubMed] [Google Scholar]
- Steriade M. Grouping of brain rhythms in corticothalamic systems. Neuroscience. 2006;137:1087–1106. doi: 10.1016/j.neuroscience.2005.10.029. [DOI] [PubMed] [Google Scholar]
- Tau GZ, Peterson BS. Normal development of brain circuits. Neuropsychopharmacology. 2010;35:147–168. doi: 10.1038/npp.2009.115. [DOI] [PMC free article] [PubMed] [Google Scholar]
- Tyzio R, Cossart R, Khalilov I, Minlebaev M, Hubner CA, Represa A, Ben-Ari Y, Khazipov R. Maternal oxytocin triggers a transient inhibitory switch in GABA signaling in the fetal brain during delivery. Science. 2006;314:1788–1792. doi: 10.1126/science.1133212. [DOI] [PubMed] [Google Scholar]
- Uddin LQ, Clare Kelly AM, Biswal BB, Xavier Castellanos F, Milham MP. Functional connectivity of default mode network components: correlation, anticorrelation, and causality. Hum Brain Mapp. 2008;30(2):625–637. doi: 10.1002/hbm.20531. [DOI] [PMC free article] [PubMed] [Google Scholar]
- Vanhatalo S, Kaila K. Development of neonatal EEG activity: from phenomenology to physiology. Semin Fetal Neonatal Med. 2006;11:471–478. doi: 10.1016/j.siny.2006.07.008. [DOI] [PubMed] [Google Scholar]
- Vincent JL, Kahn I, Snyder AZ, Raichle ME, Buckner RL. Evidence for a frontoparietal control system revealed by intrinsic functional connectivity. J Neurophysiol. 2008;100:3328–3342. doi: 10.1152/jn.90355.2008. [DOI] [PMC free article] [PubMed] [Google Scholar]
- Vincent JL, Patel GH, Fox MD, Snyder AZ, Baker JT, Van Essen DC, Zempel JM, Snyder LH, Corbetta M, Raichle ME. Intrinsic functional architecture in the anaesthetized monkey brain. Nature. 2007;447:83–86. doi: 10.1038/nature05758. [DOI] [PubMed] [Google Scholar]
- Wicker B, Ruby P, Royet JP, Fonlupt P. A relation between rest and the self in the brain? Brain Res Brain Res Rev. 2003;43:224–230. doi: 10.1016/j.brainresrev.2003.08.003. [DOI] [PubMed] [Google Scholar]
Associated Data
This section collects any data citations, data availability statements, or supplementary materials included in this article.