

Abstract
Docosahexaenoic acid (DHA), upon incorporation into tumor tissue, has the potential to sensitize tumors to the effects of chemotherapy or radiation therapy. Although DHA has usually been supplied to tumor tissue in the diet, appropriate dietary conditions required to obtain optimal tumor levels have not been established. Hence, we studied mammary tumor tissue responses in rats fed various durations and doses of DHA. Rats fed a palm-oil enriched diet (diet 0) were switched to diets providing either 0.8 g DHA/d (diet 1) or 1.5 g DHA/d (diet 2). Tumor tissue fatty acid composition was analysed at baseline (diet 0), at weeks 1, 4 and 9 during diet 1 and at week 4 during diet 2. Dietary DHA supplementation differentially increased DHA within phospholipids (PL) and triacylglycerol (TAG) fractions in tumors. DHA level equilibrated between 2 and 4 weeks in PL while DHA increase was more progressive in TAG and did not reach a steady state. A higher dose of DHA further increased DHA content in tumor PL and TAG (P = 0.018 and P < 0.001 respectively). DHA concentration in plasma PL was positively correlated with DHA in tumor PL (r = 0.72; P = 0.0003) and TAG (r = 0.64; P = 0.003). We conclude that dietary DHA supplementation enhances tumor content of DHA in a time- and dose-dependent manner, and that DHA level in plasma PL could be used as a proxy for tumor DHA. These findings have implications for dietary DHA supplementations in cancer patients.
Keywords: Animals; Carcinoma; chemically induced; metabolism; Dietary Fats; metabolism; Dietary Supplements; Docosahexaenoic Acids; blood; metabolism; Fatty Acids; metabolism; Female; Mammary Neoplasms, Experimental; chemically induced; metabolism; Methylnitrosourea; Phospholipids; metabolism; Rats; Rats, Sprague-Dawley; Tissue Distribution; Triglycerides; metabolism
Keywords: DHA incorporation, dietary DHA supplementation, mammary tumors, tumor phospholipids, tumor triacylglycerol, plasma phospholipids
Introduction
Recent studies have indicated that docosahexaenoic acid (DHA), a long chain n-3 polyunsaturated fatty acid (LCPUFA) of marine origin, has the potential to increase the efficacy of chemotherapy or radiation therapy in preclinical models and in cancer patients [1]. Two pilot studies are now available, demonstrating that dietary intervention with DHA increased the efficacy of chemotherapy in advanced breast or lung cancer patients without additional toxicity to non-tumor tissues [2, 3]. Should these results be confirmed in randomized phase III clinical trials, the consequences could be considerable by opening up the prospect of systematic adjuvant supplementation during cancer treatment, a significant shift in current cancer therapeutic paradigms.
DHA has been hypothesized to sensitize tumors to anticancer treatments through a variety of mechanisms involving alteration of cellular functions in cancer cells and modifications of the tumor microenvironment [1, 4, 5]. Enrichment of tumor cell membranes with DHA is crucial because it is assumed to be the initial step of these processes. On the basis of animal experiments, clinical trials were carried out in humans, where DHA was supplied to tumor tissues through a dietary supplementation during chemotherapy. Studies in rodents have shown that DHA-enriched diets administered for several weeks significantly increased tumor tissue DHA content in autochtonous mammary tumors [6, 7]. But beside this observation, little is known about incorporation of preformed DHA in tumor tissue. One pilot study showed that the efficacy of chemotherapy was tightly related to DHA level in plasma phospholipids (PL) during dietary DHA supplementation [2]. In this study, the efficacy of chemotherapy was greater in patients with high plasma levels of DHA compared to patients with low plasma levels of DHA [2]. From these observations, it was hypothesized that blood supply of preformed DHA to tumor tissues varied among patients and that DHA supply to tumors was higher when DHA levels were elevated in plasma PL. It was also hypothesized that plasma could be an indirect indicator of DHA level in tumor tissue. Since all of these hypotheses rely on circumstantial evidences, it appears that the conditions of dietary DHA supplementation needed to obtain optimal DHA accumulation in tumor tissue have to be defined to properly design and interpret studies using dietary DHA intervention aiming at sensitizing tumor tissue to anticancer treatments.
To our knowledge, no study has evaluated the influence of the duration of intake or the dose of DHA on tumor tissue content of DHA, or the use of plasma as a surrogate biomarker. Therefore, we used a model of autochtonous mammary tumors induced by a carcinogen in female rats. This model is relevant to address these issues because carcinomas develop autochtonously in the mammary gland, generating a tumor tissue with features mimicking the complexity of common human breast tumors [8, 9]. Phospholipids and triacylglycerol (TAG) are the main tumor lipid fractions in this model. Herein, we report on the response of tumor PL and TAG fatty acid composition to dietary DHA supplementation over time and to increasing dose of DHA. We also investigated whether DHA level in plasma PL can be a proxy for DHA content in tumors.
Material and Methods
Animal procedures
All the work with rats was carried out in accordance with the European guidelines for the care and use of laboratory animals and approved by the local Institutional Animal Care Committee (060NH). Female Sprague Dawley rats received a single dose of NMU (n-methyl-N-nitrosourea) by an inguinal subcutaneous injection (25mg/kg of body weight) at 48 days of age to induce mammary carcinogenesis. Detection of the tumors was performed by palpation twice a week. Tumors developed in the mammary tissue approximately 8 weeks after the induction of carcinogenesis. Diets had the same carbohydrate, protein, mineral, vitamin and total fat content but different fatty acid composition (Table 1). Rats were maintained on a palm oil-based diet (diet 0) until tumor area reached 0.8 cm2. Then, rats were fed either diet 1 (20 g/d) providing 0.8g DHA/d for 4 weeks (group 1, n = 4) or 9 weeks (group 2, n = 4) or diet 2 (20 g/d) providing 1.5 g DHA/d for 4 weeks (group 3, n = 4). In group 1, transcutaneous biopsies of one tumor per rat and blood collection (0.4 ml) from the tail were performed under general anaesthesia before switching to a DHA enriched diet (basal, diet 0) and at week 1 during diet 1. At the end of the study, rats were killed by cervical dislocation. Tumors were rapidly excised, frozen and stored at −80°C. Blood collected during the study or at sacrifice by cardiac puncture was drawn into EDTA tubes, separated into cells and plasma by centrifugation, and plasma was stored at −80°C. Palm oil was obtained from the Société Industrielle des Oléagineux (Bougival, France) and DHA was obtained from DHASCO oil (Martek Bioscience, Columbia, MD). The daily doses of DHA given to the rats were 4 g/kg body weight for diet 1 and 8 g/kg body weight for diet 2. If conversions used for drugs apply to nutrients, these amounts would correspond to approximately 700 mg/kg and 1300 mg/kg respectively in man [10]. These very high dosages of DHA were aimed at experimentally investigating the extent of changes that takes place in the level of DHA in the tumor and plasma.
Table 1.
Composition of diets
| Diet 0 | Diet 1 | Diet 2 | |
|---|---|---|---|
| Peanut oil, g/kg diet | 46.7 | 46.7 | 0 |
| Rapeseed oil, g/kg diet | 23.3 | 23.3 | 0 |
| Palm oil, g/kg diet | 80 | 0 | 0 |
| DHASCO, g/kg diet | 0 | 80 | 150 |
| Total SFA, g/kg diet | 62.77 ± 0.58 | 40.65 ± 0.18 | 54.61 ± 1.88 |
| Palmitic acid | 31.12 ± 1.84 | 11.16 ± 0.06 | 11.88 ± 0.39 |
| Stearic acid | 24.64 ± 0.17 | 1.75 ± 0.08 | 1.04 ± 0.08 |
| Total monounsaturated fatty acids, g/kg diet | 59.77 ± 2.01 | 60.63 ± 0.67 | 36.29 ± 0.99 |
| Oleic acid | 57.20 ± 2.30 | 55.21 ± 0.30 | 30.60 ± 0.59 |
| Total (n-6) fatty acids, g/kg diet | 19.41 ± 0.86 | 16.34 ± 1.06 | 1.79 ± 0.07 |
| Linoleic acid | 18.86 ± 1.15 | 15.77 ± 0.64 | 1.66 ± 0.06 |
| Total (n-3) fatty acids, g/kg diet | 2.94 ± 0.03 | 30.10 ± 0.33 | 55.22 ± 1.16 |
| ALA | 2.71 ± 0.15 | 2.07 ± 0.20 | 0.06 ± 0.00 |
| EPA | ND* | 0.05 ± 0.01 | 0.13 ± 0.01 |
| DHA | 0.12 ± 0.04 | 27.66 ± 0.45 | 54.34 ± 1.05 |
| LA:ALA ratio | 6.96 | 7.62 | 27.67 |
Carbohydrates (578 g/kg): corn starch, 372 g/kg; cellulose, 20 g/kg; sugar, 186 g/kg.
Proteins (221.6 g/kg): casein, 220 g/kg; methionine, 1.6 g/kg.
Mineral mix (40 g/kg, per kg mix): calcium, 8.1 g; phosphorus, 17.1 g; sodium, 3.16 g; chloride, 3.16 g; potassium, 10.8 g; magnesium, 0.9 g; iron, 390 mg; copper, 46 mg; manganese, 230 mg; zinc, 230 mg; cobalt, 1 mg; iodine, 2 mg; selenium, 1 mg; fluorine, 2 mg.
Vitamin mix (10 g/kg, per kg mix): retinol,5000 UI; cholecalciferol, 2500 UI; vitamin E (a-tocopherol), 50 UI; thiamine, 10 mg; riboflavin, 10 mg; pyridoxine, 10 mg; cyanocobalamine, 0.0135 mg; ascorbic acid, 100 mg; menadione, 1 mg; folic acid, 2 mg; nicotinic acid, 45 mg; pantothenic acid, 30 mg; choline, 0.75 mg; inositol, 50 mg; biotin, 0.2 mg.
Values are means ± SD, n = 3;
ND: not detected.
Fatty acid composition analysis
The fatty acid composition of the experimental diets, plasma and tumors was determined by gas chromatography as previously described [2, 11]. Diet, plasma and tumor tissue lipids were extracted using chloroform/methanol (2:1, by vol; containing 50 mg/L BHT) [12]. PL and TAG were separated by one-dimensional silicagel thin layer chromatography. Fatty acids were transmethylated with 14% boron trifluoride in methanol at 100°C for 90 min and 30 min respectively for PL and TAG. FAME were extracted with hexane. Fatty acid methyl esters were resolved on an AS 2000 gas chromatograph (ThermoFinnigan, France) equipped with a cold on-column injector and a 60 meters BPX 70 capillary column, with the aid of an automatic injector. The temperature protocol was adapted from reference [13]. FAME were identified by comparison with authentic standards (Supelco, USA). Peak area was determined using ChromQuest software and results are presented as percent of total peak area.
Statistics
GraphPad Prism (version 4, GraphPad Software, Inc., San Diego, USA) was used for statistical analysis. The effects of time on fatty acid composition were assessed by one-way ANOVA completed with Bonferroni test. The effects of dose on fatty acid composition were assessed by unpaired t-test. Spearman test was used to analyse the relationship between DHA concentration in plasma and in tumor tissue. Significance was defined as P < 0.05 (two-sided).
Results
DHA accumulation in tumor PL
The fatty acid composition of tumor PL during dietary DHA supplementation is presented in Table 2. DHA level in tumor PL rose to equilibrate between 2 and 4 weeks. DHA level increased by 2 fold after 4 weeks of intake. No further increase was noted after 4 weeks. When the dose of DHA was doubled, the amount of DHA in tumor PL increased by 1.3 fold. There was a time- and dose-dependent increase in tumor PL EPA content and a time-dependent increase in DPA n-3. No significant change was noted in the amount of ALA. Tumor LA content increased in a time-dependent manner with diet 1 and maintained while on diet 2. There was a reciprocal decrease in tumor PL ARA over time that was enhanced by a higher dose of DHA. Since oleic acid was present in large amounts in the diets, an increase in tumor PL oleic acid content was also noted.
Table 2.
Tumor PL fatty acid composition in response to different durations and doses of DHA supplementation
| Diet 0
|
Diet 1
|
Diet 2
|
ANOVA P
|
T-test P
|
|||
|---|---|---|---|---|---|---|---|
| Fatty acid | Basal | Week 1 | Week 4 | Week 9 | Week 4 | Time | Dose |
| 16:0 | 22.91 ± 1.04 | 24.68 ± 0.63 | 23.29 ± 1.65 | 22.66 ± 0.81 | 23.90 ± 1.09 | 0.189 | 0.350 |
| 18:0 | 16.07 ± 1.87 | 15.13 ± 1.92 | 14.50 ± 2.20 | 14.34 ± 1.42 | 14.03 ± 0.69 | 0.579 | 0.555 |
| 18:1n-9 | 11.80 ± 1.04 | 12.48 ± 0.95 | 13.19 ± 1.55 | 15.64 ± 1.01a b c | 15.88 ± 1.99 | 0.001 | 0.003 |
| 18:2n-6 | 2.41 ± 0.59 | 3.12 ± 0.63 | 5.10 ± 1.32a | 5.49 ± 0.91a b | 4.64 ± 0.93 | 0.001 | 0.386 |
| 20:4n-6 | 19.44 ± 0.64 | 15.44 ± 2.59 | 12.37 ± 2.69a | 9.50 ± 2.29a b | 6.47 ± 2.45 | <0.001 | <0.001 |
| 18:3n-3 | 0.01 ± 0.00 | 0.02 ± 0.00 | 0.03 ± 0.01 | 0.03 ± 0.01 | 0.02 ± 0.01 | 0.074 | 0.180 |
| 20:5n-3 | 0.04 ± 0.02 | 0.43 ± 0.13 | 1.26 ± 0.34a b | 1.56 ± 0.41a b | 3.39 ± 0.34 | <0.001 | <0.001 |
| 22:5n-3 | 0.29 ± 0.06 | 0.46 ± 0.11 | 0.75 ± 0.23a | 0.80 ± 0.18a | 0.93 ± 0.19 | <0.001 | 0.079 |
| 22:6n-3 | 2.45 ± 0.29 | 3.47 ± 0.07 | 5.23 ± 1.23a b | 5.11 ± 0.52a | 6.85 ± 1.04 | <0.001 | 0.018 |
| n-6/n-3 ratio | 9.58 | 4.83 | 2.66 | 2.40 | 1.18 | ||
Values are mean ± SD, n=4.
Different from basal,
different from week 1,
different from week 4, P < 0.05
DHA accumulation in tumor TAG
The fatty acid composition of tumor TAG during dietary DHA supplementation is presented in Table 3. DHA increase in tumor TAG was more progressive and did not equilibrate during the time course of the study compared to tumor PL. The level of 5.5 % DHA was reached in 9 weeks in the TAG fraction compared to 4 weeks in the PL fraction. The proportion of DHA in tumor TAG increased 2.6 fold when the dose of DHA was doubled. EPA increased after one week of dietary DHA supplementation to reach a steady state. EPA further increased in response to a higher dose of DHA. DPA n-3 increased in a time- and dose-dependent manner. There was a time-dependent increase in the amount of ALA and LA. Tumor TAG ARA content decreased in a time- and dose-dependent manner. There was also an increase in tumor TAG oleic acid and a decrease in stearic acid.
Table 3.
Tumor TAG fatty acid composition in response to different durations and doses of DHA supplementation
| Fatty acid | Diet 0
|
Diet 1
|
Diet 2
|
ANOVA P
|
T-test P
|
||
|---|---|---|---|---|---|---|---|
| Basal | Week 1 | Week 4 | Week 9 | Week 4 | Time | Dose | |
| 16:0 | 23.54 ± 0.79 | 26.70 ± 4.38 | 20.14 ± 1.88b | 21.41 ± 0.91b | 18.56 ± 2.53 | <0.001 | 0.153 |
| 18:0 | 11.48 ± 1.65 | 12.42 ± 3.74 | 7.70 ± 0.94a b | 6.02 ± 1.76a b | 4.30 ± 1.82 | <0.001 | <0.001 |
| 18:1n-9 | 29.71 ± 8.74 | 23.18 ± 8.14 | 42.73 ± 5.90a b | 37.81 ± 4.18b | 42.51 ± 3.93 | <0.001 | 0.928 |
| 18:2n-6 | 5.82 ± 2.92 | 4.48 ± 2.16 | 10.02 ± 1.41a b | 12.18 ± 1.66a b | 9.05 ± 1.85 | <0.001 | 0.243 |
| 20:4n-6 | 4.28 ± 1.96 | 5.32 ± 2.53 | 0.67 ± 0.38a b | 0.70 ± 0.37a b | 0.25 ± 0.17 | <0.001 | 0.008 |
| 18:3n-3 | 0.27 ± 0.19 | 0.11 ± 0.05 | 0.56 ± 0.13a b | 0.55 ± 0.18b | 0.45 ± 0.13 | <0.001 | 0.098 |
| 20:5n-3 | 0.03 ± 0.02 | 0.18 ± 0.10a | 0.18 ± 0.09a | 0.19 ± 0.10a | 0.32 ± 0.14 | 0.045 | 0.027 |
| 22:5n-3 | 0.24 ± 0.15 | 0.38 ± 0.12 | 0.23 ± 0.10 | 0.77 ± 0.32a b | 0.55 ± 0.22 | 0.001 | 0.005 |
| 22:6n-3 | 1.64 ± 1.01 | 3.26 ± 1.33 | 3.40 ± 1.09 | 5.50 ± 1.95a | 8.99 ± 1.18 | 0.004 | <0.001 |
| n-6/n-3 ratio | 6.65 | 3.42 | 2.54 | 1.81 | 0.93 | ||
Values are mean ± SD, n=4.
Different from basal,
different from week 1,
different from week 4, P < 0.05
Relationship between DHA concentration in plasma PL and in tumor tissue
DHA increase in plasma PL was rapid and reached a steady state after one week of intake (Table 4). A higher dose of DHA induced a 1.7 fold increase in DHA concentration in plasma PL. DHA concentration in plasma PL followed a pattern close to that of tumor PL. Changes in EPA and ARA followed a pattern similar to that of tumor PL. An increase of ALA was noted at week 9 during diet 1. The proportion of LA increased during diet 1 but decreased during diet 2 when the amount of LA in the diet reduced. No significant change in DPA n-3 level was noticed.
Table 4.
Plasma PL fatty acid composition in response to different durations and doses of DHA supplementation
| Fatty acid | Diet 0
|
Diet 1
|
Diet 2
|
ANOVA P
|
T-test P
|
||
|---|---|---|---|---|---|---|---|
| Basal | Week 1 | Week 4 | Week 9 | Week 4 | Time | Dose | |
| 16:0 | 16.65 ± 1.28 | 21.34 ± 1.11a | 23.11 ± 1.05a | 26.12 ± 1.35a b | 27.79 ± 1.91 | <0.001 | 0.015 |
| 18:0 | 42.30 ± 2.96 | 35.85 ± 1.92a | 34.14 ± 0.85a | 36.22 ± 1.75a | 30.28 ± 2.17 | 0.003 | 0.049 |
| 18:1n-9 | 3.71 ± 0.24 | 4.67 ± 0.43 | 5.33 ± 0.46a | 4.51 ± 0.61 | 5.99 ± 0.41 | 0.015 | 0.088 |
| 18:2n-6 | 5.85 ± 1.68 | 9.08 ± 1.26a | 11.04 ± 0.38a | 7.89 ± 0.71 | 4.74 ± 0.55 | 0.003 | <0.001 |
| 20:4n-6 | 16.59 ± 2.86 | 6.30 ± 0.83a | 3.33 ± 0.15a | 2.15 ± 0.59a b | 1.23 ± 0.79 | <0.001 | 0.009 |
| 18:3n-3 | 0.04 ± 0.02 | 0.04 ± 0.03 | 0.03 ± 0.03 | 0.24 ± 0.11a b b | 0.03 ± 0.01 | 0.004 | 0.575 |
| 20:5n-3 | 0.10 ± 0.04 | 2.27 ± 0.95a | 1.90 ± 0.41a | 1.82 ± 0.40a | 4.24 ± 1.17 | <0.001 | 0.032 |
| 22:5n-3 | 0.13 ± 0.02 | 0.24 ± 0.09 | 0.25 ± 0.12 | 0.26 ± 0.03 | 0.27 ± 0.05 | 0.250 | 0.745 |
| 22:6n-3 | 3.70 ± 0.86 | 6.83 ± 1.67a | 6.74 ± 2.27a | 6.04 ± 1.21a | 11.64 ± 1.47 | 0.011 | 0.007 |
| n-6/n-3 ratio | 5.20 | 1.50 | 1.63 | 1.19 | 0.40 | ||
Values are mean ± SD, n=4.
Different from basal,
different from week 1,
different from week 4, P < 0.05
Plasma PL DHA showed a correlation with tumor PL DHA (r = 0.72; P < 0.001; Figure 1a) and tumor TAG DHA (r = 0.64; P = 0.003; Figure 1b).
Figure 1. Positive correlation between tumor PL (a) or TAG (b) DHA levels and DHA concentration in plasma PL.
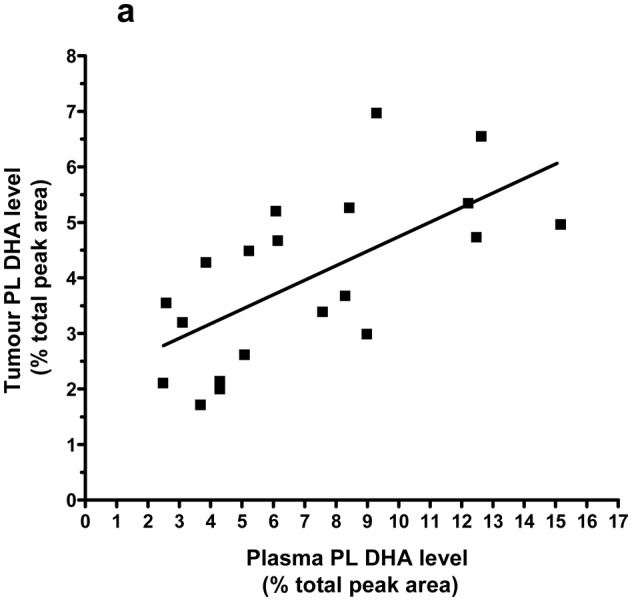
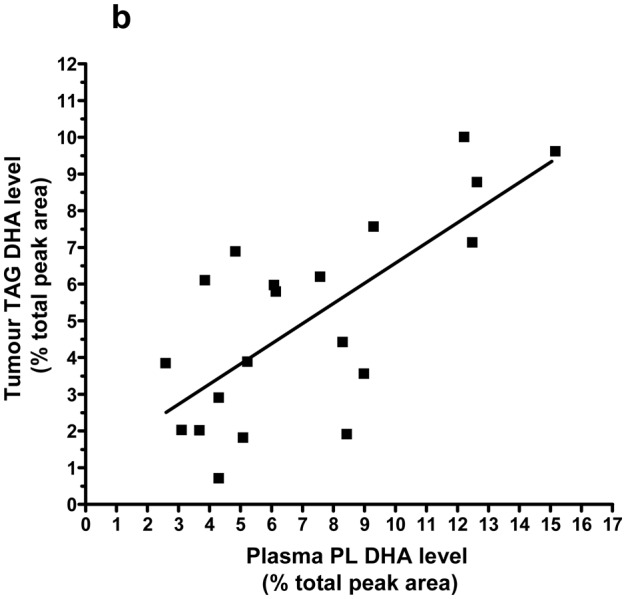
Spearman test results are r = 0.72, 95% CI = 0.39 to 0.88, p = 0.0003, n = 20 (a) and r = 0.64, 95% CI = 0.26 to 0.85, p = 0.003, n = 20 (b). Lines represent the least-squares regression analysis of best linear fit (GraphPad Prism Software, version 4). Linear regression results are r2 = 0.43, P = 0.0018 (a) and r2 = 0.52, P = 0.0003 (b).
Discussion
This study describes the evolution of mammary tumor tissue fatty acids during dietary DHA supplementation over time and with increasing dose of DHA in rats. We found that DHA accumulation in tumor tissue increased in a time- and dose-dependent manner in response to supplementary dietary DHA and that DHA concentration in plasma PL can serve as a proxy biomarker for tumor DHA.
Enrichment of cancer cell membranes and tumors with DHA has been associated with enhanced efficacy of anticancer treatments and is therefore assumed to be a critical step leading to this effect. Although increased de novo lipogenesis is a property of cancer cells [14], these cells cannot synthesize LCPUFA de novo because mammalian cells cannot introduce double bonds beyond the Δ9 position. Diet is a simple and efficient way to supply DHA to tumors as previously documented in this model [6, 7]. In the present study, we showed that dietary DHA supplementation induced a rapid accumulation of DHA in tumor PL over time. DHA level equilibrated between two and four weeks of intake in the PL fraction while no steady state was reached within the 9 weeks of intake in the TAG fraction. This suggests that a dietary DHA supplementation for two to four weeks would be necessary to significantly increase tumor PL content of DHA. As a practical consequence for future clinical trials, it would be necessary to initiate dietary DHA supplementation at least two weeks prior to chemotherapy to ensure optimal DHA accumulation into tumor tissue. When this is not possible, assessment of chemotherapy efficacy should not be performed before one month of dietary DHA supplementation has been achieved.
We provided 0.8 g DHA/d in diet 1 based on previous studies indicating that this dose significantly increased tumor DHA content and sensitized tumors to chemotherapy and radiation therapy in the same model [6, 7]. Despite the saturation of DHA level in tumor PL with this dose of DHA, tumor tissue continued to incorporate DHA in response to the considerable amount of DHA provided by diet 2 (1.5 g/d). DHA accumulation in the TAG fraction was greater than in the PL fraction in response to a higher dose of DHA. These results suggest that tumors have a high propensity to incorporate preformed DHA, even in large amounts. A possible mechanism could be an up-regulation in tumor lipid transporters to meet their high requirement for structural lipids. Whether the rate of growth or proliferation in the tumors could interfere with DHA accumulation in tumor tissue should be examined.
Diet has been considered to be the main source of DHA supplied to tissues including tumors either as preformed DHA or as its precursor, the essential fatty acid α-linolenic acid (18:3n-3, ALA). DHA synthesis from ALA requires elongation, desaturation by delta 6 (EC 1.14.19.3) and delta 5 desaturases (EC 1.14.19.4), and β-oxidation [15]. The activity of the desaturation/elongation pathway in the liver is the most important in terms of supply of ALA metabolites to other tissues. Tumor cells might also contribute to this pathway since several cancer cell lines are capable of processing exogenous essential fatty acids [16, 17]. During diet 0, endogenous synthesis of DHA may be regarded as the likely supply to tumor tissue, since no dietary source of preformed DHA was available. However, this pathway could not have markedly contributed to the increase in DHA level during dietary DHA supplementation because the amount of ALA and the ratio of LA:ALA were approximately similar in diet 1 and diet 0, and diet 2 contained only traces of ALA. The formation of EPA during dietary DHA supplementation, while diets were free from EPA, could be a result of DHA retroconversion [18]. This process mainly takes place in the liver and requires saturation of the Δ4 double bond by Δ4 enoyl CoA reductase (EC 1.3.1.34) and rearrangement of the double bond structure by Δ3, Δ2 enoyl CoA isomerase (EC 5.3.3.8) [19, 20]. The formation of DPA n-3 could be a result of DHA retroconversion or a chain-elongation of the retroconverted EPA. ARA decrease concomitent with increase in LA during dietary DHA supplementation may result from a competition with EPA and a lower conversion from LA. DHA and EPA were shown to downregulate the expression of delta 5- and delta 6-desaturases [21]. As a result of ARA changes, there was a dramatic decrease in n-6/n-3 ratio in tumor lipid fractions. Thus, we were able to profoundly modify the fatty acid composition of tumor tissue with a DHA-enriched diet. It is likely that this would have consequences on tumor metabolic pathways, particularly the production of inflammatory eicosanoids.
Blood is the route of delivery of dietary lipids to tissues. Plasma DHA in total lipids has been shown to correlate with DHA accumulation in brain, retina or liver in experimental animals [22, 23]. We found that DHA accumulation in tumor PL followed a pattern close to that of plasma PL and that DHA in tumor PL and TAG correlated with DHA level in plasma PL in this model. Studies exploring this issue in cancer patients are difficult to perform because of technical problems and ethical concerns. One study reported that the DHA increase in gastro-intestinal tumors was concomitant with its increase in plasma PL after 5 days of dietary supplementation with fish oil [24]. These results suggest that plasma, beside its use as a biomarker of intake, could be a relevant surrogate biomarker of tumor tissue DHA content.
In conclusion, this study establishes the evolution of tumor tissue fatty acid composition in response to different durations or doses of dietary DHA supplementation and demonstrates that accumulation of preformed DHA into tumor tissue is time- and dose-dependent. These results could provide a basis for a rational design of dietary DHA supplementation in cancer patients.
Acknowledgments
DHASCO was graciously provided by Martek Biosciences (Columbia, MD, USA) and palm oil by the Société Industrielle des Oléagineux (Bougival, France). We also thank Pierre Besson for his contribution to this work.
Abbreviations
- ARA
arachidonic acid
- ALA
alpha-linolenic acid
- DHA
docosahexaenoic acid
- DPA
docosapentaenoic acid
- EPA
eicosapentaenoic acid
- FAME
fatty acid methyl ester
- LA
linoleic acid
- LCPUFA
long-chain PUFA
- NMU
n-methyl-N-nitrosourea
- PL
phospholipids
- TAG
triacylglycerol
Footnotes
Conflict of interest
The authors report no conflict of interest.
References
- 1.Bougnoux P, Hajjaji N, Maheo K, Couet C, Chevalier S. Fatty acids and breast cancer: Sensitization to treatments and prevention of metastatic re-growth. Prog Lipid Res. 2010;49:76–86. doi: 10.1016/j.plipres.2009.08.003. [DOI] [PubMed] [Google Scholar]
- 2.Bougnoux P, Hajjaji N, Ferrasson MN, Giraudeau B, Couet C, Le Floch O. Improving outcome of chemotherapy of metastatic breast cancer by docosahexaenoic acid: a phase II trial. Br J Cancer. 2009;101:1978–1985. doi: 10.1038/sj.bjc.6605441. [DOI] [PMC free article] [PubMed] [Google Scholar]
- 3.Murphy RA, Mourtzakis M, Chu QS, Baracos VE, Reiman T, Mazurak VC. Supplementation with fish oil increases first-line chemotherapy efficacy in patients with advanced non small cell lung cancer. Cancer. 2011 doi: 10.1002/cncr.25933. [DOI] [PubMed] [Google Scholar]
- 4.Biondo PD, Brindley DN, Sawyer MB, Field CJ. The potential for treatment with dietary long-chain polyunsaturated n-3 fatty acids during chemotherapy. J Nutr Biochem. 2008;19:787–796. doi: 10.1016/j.jnutbio.2008.02.003. [DOI] [PubMed] [Google Scholar]
- 5.Calviello G, Serini S, Piccioni E, Pessina G. Antineoplastic effects of n-3 polyunsaturated fatty acids in combination with drugs and radiotherapy: preventive and therapeutic strategies. Nutr Cancer. 2009;61:287–301. doi: 10.1080/01635580802582777. [DOI] [PubMed] [Google Scholar]
- 6.Colas S, Paon L, Denis F, Prat M, Louisot P, Hoinard C, Le Floch O, Ogilvie G, Bougnoux P. Enhanced radiosensitivity of rat autochtonous mammary tumors by dietary docosahexaenoic acid. Int J Cancer. 2004;109:449–454. doi: 10.1002/ijc.11725. [DOI] [PubMed] [Google Scholar]
- 7.Colas S, Mahéo K, Denis F, Goupille C, Hoinard C, Champeroux P, Tranquart F, Bougnoux P. Sensitization by dietary docosahexaenoic acid of rat mammary carcinoma to anthracycline: a role for tumor vascularization. Clin Cancer Res. 2006;12:5879–5886. doi: 10.1158/1078-0432.CCR-06-0386. [DOI] [PubMed] [Google Scholar]
- 8.Gullino PM, Pettigrew HM, Grantham FH. N-Nitrosomethylurea as mammary gland carcinogen in rats. J Natl Cancer Inst. 1975;54:401–414. [PubMed] [Google Scholar]
- 9.Rivera ES, Andrade N, Martin G, Melito G, Cricco G, Mohamad N, Davio C, Caro R, Bergoc RM. Induction of mammary tumors in rat by intraperitoneal injection of NMU: histopathology and estral cycle influence. Cancer Lett. 1994;86:223–228. doi: 10.1016/0304-3835(94)90082-5. [DOI] [PubMed] [Google Scholar]
- 10.Freireich EJ, Gehan EA, Rall DP, Schmidt LH, Skipper HE. Quantitative comparison of toxicity of anticancer agents in mouse, rat, hamster, dog, monkey, and man. Cancer Chemother Rep. 1966;50:219–244. [PubMed] [Google Scholar]
- 11.Chajes V, Lanson M, Fetissof F, Lhuillery C, Bougnoux P. Membrane fatty acids of breast carcinoma: contribution of host fatty acids and tumor properties. Int J Cancer. 1995;63:169–175. doi: 10.1002/ijc.2910630204. [DOI] [PubMed] [Google Scholar]
- 12.Folch J, Lees M, Sloane Stanley GH. A simple method for the isolation and purification of total lipides from animal tissues. J Biol Chem. 1957;226:497–509. [PubMed] [Google Scholar]
- 13.Childs CE, Romeu-Nadal M, Burdge GC, Calder PC. The polyunsaturated fatty acid composition of hepatic and plasma lipids differ by both sex and dietary fat intake in rats. J Nutr. 2010;140:245–250. doi: 10.3945/jn.109.115691. [DOI] [PubMed] [Google Scholar]
- 14.Swinnen JV, Brusselmans K, Verhoeven G. Increased lipogenesis in cancer cells: new players, novel targets. Curr Opin Clin Nutr Metab Care. 2006;9:358–365. doi: 10.1097/01.mco.0000232894.28674.30. [DOI] [PubMed] [Google Scholar]
- 15.Sprecher H. The roles of anabolic and catabolic reactions in the synthesis and recycling of polyunsaturated fatty acids. Prostaglandins Leukot Essent Fatty Acids. 2002;67:79–83. doi: 10.1054/plef.2002.0402. [DOI] [PubMed] [Google Scholar]
- 16.Grammatikos SI, Subbaiah PV, Victor TA, Miller WM. Diversity in the ability of cultured cells to elongate and desaturate essential (n-6 and n-3) fatty acids. Ann N Y Acad Sci. 1994;745:92–105. doi: 10.1111/j.1749-6632.1994.tb44366.x. [DOI] [PubMed] [Google Scholar]
- 17.de Antueno RJ, Allen SJ, Ponton A, Winther MD. Activity and mRNA abundance of Delta-5 and Delta-6 fatty acid desaturases in two human cell lines. FEBS Lett. 2001;491:247–251. doi: 10.1016/s0014-5793(01)02209-8. [DOI] [PubMed] [Google Scholar]
- 18.Gronn M, Christensen E, Hagve TA, Christophersen BO. Peroxisomal retroconversion of docosahexaenoic acid (22:6(n-3)) to eicosapentaenoic acid (20:5(n-3)) studied in isolated rat liver cells. Biochim Biophys Acta. 1991;1081:85–91. doi: 10.1016/0005-2760(91)90254-f. [DOI] [PubMed] [Google Scholar]
- 19.Dommes V, Baumgart C, Kunau WH. Degradation of unsaturated fatty acids in peroxisomes. Existence of a 2,4-dienoyl-CoA reductase pathway. J Biol Chem. 1981;256:8259–8262. [PubMed] [Google Scholar]
- 20.Kunau WH, Dommes P. Degradation of unsaturated fatty acids. Identification of intermediates in the degradation of cis-4-decenoly-CoA by extracts of beef-liver mitochondria. Eur J Biochem. 1978;91:533–544. doi: 10.1111/j.1432-1033.1978.tb12707.x. [DOI] [PubMed] [Google Scholar]
- 21.Cho HP, Nakamura M, Clarke SD. Cloning, expression, and fatty acid regulation of the human delta-5 desaturase. J Biol Chem. 1999;274:37335–37339. doi: 10.1074/jbc.274.52.37335. [DOI] [PubMed] [Google Scholar]
- 22.Huang MC, Brenna JT, Chao AC, Tschanz C, Diersen-Schade DA, Hung HC. Differential tissue dose responses of (n-3) and (n-6) PUFA in neonatal piglets fed docosahexaenoate and arachidonoate. J Nutr. 2007;137:2049–2055. doi: 10.1093/jn/137.9.2049. [DOI] [PubMed] [Google Scholar]
- 23.Sarkadi-Nagy E, Wijendran V, Diau GY, Chao AC, Hsieh AT, Turpeinen A, Nathanielsz PW, Brenna JT. The influence of prematurity and long chain polyunsaturate supplementation in 4-week adjusted age baboon neonate brain and related tissues. Pediatr Res. 2003;54:244–252. doi: 10.1203/01.PDR.0000072795.38990.F2. [DOI] [PubMed] [Google Scholar]
- 24.Senkal M, Haaker R, Linseisen J, Wolfram G, Homann HH, Stehle P. Preoperative oral supplementation with long-chain Omega-3 fatty acids beneficially alters phospholipid fatty acid patterns in liver, gut mucosa, and tumor tissue. JPEN J Parenter Enteral Nutr. 2005;29:236–240. doi: 10.1177/0148607105029004236. [DOI] [PubMed] [Google Scholar]