

Abstract
Objective
While amyloid-beta (Aβ) peptide deposition into insoluble plaques is a pathological hallmark of Alzheimer’s disease, soluble oligomeric Aβ has been hypothesized to more directly underlie impaired learning and memory in dementia of the Alzheimer type. However, the lack of a sensitive, specific, and quantitative assay for Aβ oligomers has hampered rigorous tests of this hypothesis.
Methods
We developed a plate-based single molecule counting fluorescence immunoassay for oligomeric Aβ sensitive to low pg/ml concentrations of synthetic Aβ dimers using the same Aβ-specific monoclonal antibody to both capture and detect Aβ. The Aβ oligomer assay does not recognize monomeric Aβ, amyloid precursor protein, or other non-Aβ peptide oligomers.
Results
Aβ oligomers were detected in aqueous cortical lysates from patients with dementia of the Alzheimer type and non-demented patients with Aβ plaque pathology. However, Aβ oligomer concentrations in demented patients’ lysates were tightly correlated with Aβ plaque coverage (r=0.88), but this relationship was weaker in those from non-demented patients (r=0.30) despite equivalent Aβ plaque pathology. The ratio of Aβ oligomer levels to plaque density fully distinguished demented from non-demented patients, with no overlap between groups in this derived variable. Other Aβ and plaque measures did not distinguish demented from non-demented patients. Aβ oligomers were not detected in cerebrospinal fluid with this assay.
Interpretation
The results raise the intriguing hypothesis that the linkage between plaques and oligomers may be a key pathophysiological event underlying dementia of the Alzheimer type. This Aβ oligomer assay may be useful for many tests of the oligomer hypothesis.
Keywords: amyloid-beta, oligomer, Alzheimer’s disease
INTRODUCTION
Amyloid-beta (Aβ) aggregation and deposition is one of the pathological hallmarks of Alzheimer’s disease. However, the presence of fibrillar Aβ plaque pathology in cognitively normal subjects 1–4 raises the issue of whether one or more additional events are required to cause neurodegeneration and cognitive impairment. A series of recent studies have shown that soluble oligomeric species of Aβ have direct adverse effects, whereas fibrillar or monomeric Aβ seem to be less harmful in vitro 5–11 and in animal models 12–15. Several studies using postmortem tissue from Alzheimer’s patients have demonstrated the presence of soluble oligomeric Aβ species in diseased brains 13, 16–19. Thus, oligomerization of Aβ has been proposed to be a key event in the pathogenesis of dementia of the Alzheimer type.
Several groups have previously developed assays to detect amyloid-β oligomers. Strategies include Western blotting 13, 15, 19, 20, nano-particle based detection 21, conformation specific antibodies 8, 22–27, and immunoassays utilizing the same monoclonal antibody to capture and detect Aβ 28–33. However, all of these assays have had limitations in terms of sensitivity, specificity and quantitative reproducibility. One technical challenge for quantitative studies has been the choice of an oligomer standard which is stable and stoichometrically well-characterized; many synthetic oligomeric preparations contain an unstable mixture of monomers, dimers, trimers and higher order oligomers. Xia and colleagues have addressed this problem with the creation of a stable Aβ1-40Ser26Cys covalently linked disulfide homo-dimer. Under appropriate redox conditions, essentially pure dimer standards can be produced, which allows for a calculation of oligomer levels in units of “dimer equivalents”.
Our objective in developing a sensitive Aβ oligomer assay was to allow assessment of biological fluids and lysates without the need for immunoprecipitation or other methods of concentrating the samples. Aβ may oligomerize at moderate to high concentrations, which could occur artifactually during such procedures. Furthermore, some biological fluids are available only in very limited quantities. Therefore we optimized a 384-well plate format immunoassay utilizing the fluorescent single-molecule counting Erenna platform 34. Here, we demonstrate the design, sensitivity, specificity of this assay for analysis of Aβ oligomer concentrations. Using this assay we have uncovered a previously unrecognized quantitative relationship between Aβ oligomer concentrations and plaque deposition in post-mortem human cortical samples.
METHODS
Preparation of synthetic Aβ dimer standard
Synthetic Aβ1-40Ser26Cys dimer (#64130-1, AnaSpec, Fremont, CA) was initially dissolved in DMSO followed by dilution in phosphate buffered saline (PBS), pH 7.4 containing 0.01% Tween-20. Dimer peptide was isolated by size exclusion chromatography using a Superdex 200 10/300 GL column (GE Healthcare, Milwaukee, Wisconsin) eluted with 50 mM ammonium acetate, pH 8.5, at a flow rate of 0.5 ml/min. Fractions (0.25 ml) were collected and the presence of peptide was determined by an indirect enzyme-linked immunosorbent assay (ELISA) and Western blot. Amyloid-β positive fractions found to contain only dimer were pooled and lyophilized for use as the standard. Peptide concentration was determined using a combination of direct ELISA against reduced dimer with a known concentration of Aβ1-40 monomer and a modified bicinchoninic acid (BCA) protein assay.
Preparation of HJ3.4 Detection Antibody
For development of the Aβ oligomer ELISA, we selected the Aβ-specific N-terminal mouse monoclonal IgG1 HJ3.4 35. A proprietary fluorophore was conjugated to HJ3.4 via a succinimidyl ester moiety by Singulex Inc. (Alameda, CA)
Aβ Oligomer Assay
Unlabeled mouse monoclonal HJ3.4 was used to coat 384-well Nunc MaxiSorp plates (#464718, Nalge Nunc, Rochester, NY) at 20 μg/mL in a carbonate buffer (35mM sodium bicarbonate, 16 mM sodium carbonate, 3mM sodium azide, pH 9.6) using 20 μl/well overnight at 4°C. Plates were washed 5x between steps with PBS containing 0.005% Tween-20 using a BioTek EXL405 plate washer (BioTek, Winooski, VT). Sample plates were blocked using 0.2 μm filtered 4% BSA (#7030, Sigma-Aldrich, St. Louis, MO) in PBS for 1 hour at room temperature. Samples or dimer standard were analyzed neat or diluted in standard diluent (0.2 μm filtered 0.25% BSA, 0.005% Tween-20, 3 mM sodium azide, 2 μg/mL aprotinin (EMD Chemicals, Gibbstown, NJ), 1 μg/mL leupeptin (EMD Chemicals), in PBS) to 20 μL final volume and loaded. A 9-point standard curve was generated using 200, 100, 50, 25, 12.5, 6.25, 3.125, 1.56, and 0 pg/ml of Aβ1-40Ser26Cys dimer and loaded in triplicate in all experiments. All samples and standard were kept on ice during processing. Plates were centrifuged at 1000xg briefly after loading samples and standards to ensure that fluid was properly seated at the bottom of each well and to remove any air bubbles. Samples and standards equilibrated with the coating antibody during overnight 4°C incubation. After another wash step to remove unbound solutes, Aβ oligomers were detected with labeled HJ3.4at 100 ng/mL in PBS containing 0.2 μm filtered 0.1 mg/mL non-fat dry milk plus 0.005% Tween-20. Binding to exposed Aβ oligomers was allowed to occur for 1 hour at room temperature, protected from light. Following a final wash, bound detection antibody was eluted with 0.1 M glycine, pH 2.7, containing 0.01% Triton X-100 for 10 minutes at room temperature. The elution reaction was terminated by addition of 4 μL/well Singulex neutralization buffer. The eluted antibody conjugate was then measured on the Erenna® Immunoassay System (Singulex, Alameda, CA). This system uses a spot illumination and single photon counting approach to detect individual labeled antibody fluorescence emission events; thus the results are expressed as “detected events.” The standard curve was then used to calculate the concentration of amyloid-β oligomer in units of “dimer equivalents.” The standard curve was fit using the Richards equation, a 5 parameter logistic regression which accounts for asymmetry 36, as implemented in Prism 5.0 (GraphPad Software, La Jolla, CA).
Validation of the standard curve
To determine the accuracy and reproducibility of the standard curve, six independent assays were performed on different plates on different days. Each standard curve was run in triplicate to measure % coefficient of variation as a measure of intra-assay variability. Variability between the 6 assays in the calculated dimer equivalent values following curve fitting was used to measure inter-assay variability. Precision was measured using the % relative error: curve fitting-based calculated dimer equivalents vs. loaded dimer concentration. Using previously recommended criteria for ligand-binding assays 37, only standard curve values with a sum of the % coefficient of variation and the absolute value of the % relative error less than 30% were accepted as valid for the standard curve. The lower limit of quantitation (LLOQ) was defined as the lowest concentration on the standard curve which met this acceptance criterion.
Specificity Controls
Due to the excess of monomeric amyloid-β compared to oligomer in most relevant biological fluids, it is important to determine the ability of the assay to discriminate oligomeric from monomeric amyloid-β species. Monomeric Aβ1-38, Aβ1-40, and Aβ1-42 were prepared by incubating lyophilized stock peptide in 1,1,1,3,3,3-hexafluoro-2-propanol (HFIP) (#52512, Sigma-Aldrich) for 30 minutes followed by sonication and drying under vacuum to create monomer films. Monomeric amyloid-β peptides were diluted into standard diluent and measured over a range (156 pg/mL to 10 ng/mL) of concentrations to determine their effect on signal levels. Amyloid-β1-40 monomer was also titrated (3.9 pg/mL to 2 ng/mL) into standard diluent containing a fixed concentration (25 pg/mL) of amyloid-β dimer to determine if a monomer saturation effect occurs in the presence of oligomer.
To verify the specificity of HJ3.4 for Aβ over amyloid precursor protein, an immunodepletion assay was performed on brain homogenate from a 9 month old 3xTg-AD mouse 38 containing high levels of human amyloid precursor protein. Whole brain was removed after transcardial perfusion with PBS containing 0.3% heparin and immediately dounce homogenized in RIPA buffer (150 mM NaCl, 50 mM Tris-HCl, 1% Triton X-100, 0.10% SDS, 0.5% deoxycholic acid, 2.5 mM EDTA, pH 8.0) at a 10:1 ratio (RIPA volume/tissue weight) using 25 strokes followed by brief sonication. The resulting homogenate was centrifuged for 20 minutes at 17,000xg at 4°C to remove insoluble protein. Total protein was determined using a standard BCA protein assay. Individual aliquots containing 100 μg of homogenate were immunodepleted using 10 μg of each antibody (HJ3.4, 82E1, 6E10). After overnight incubation, complexes were captured using 150 μg Protein-G Dynabeads® (#100.03D, Invitrogen). The resulting immunodepleted supernatants were assayed by Western blot, as described below, to determine affinity in solution for APP.
The specificity of the assay was further validated by determining its response to N-terminally truncated pyroglutamate Aβ (AβpE3)(#29907-01, Anaspec) species, amyloid-BRI (#62-0-92A, American Peptide, Sunnyvale, CA ), and amyloid-DAN (#62-0-04A, American Peptide) oligomers. These other peptide oligomers were prepared by incubation of each species at 2.5 μM in PBS containing 0.025% SDS for one hour prior to addition of glutaraldehyde (#G6257, Sigma-Aldrich, St. Louis, MO) (0.0625% final concentration) for 2 minutes to cross-link associated peptides. The reaction was quenched by the addition of 1:20 volume 1M Tris-HCl, pH 8.0. The formation of SDS-stable, fixed oligomeric species was confirmed by Western blot. These other oligomer preparations were then measured in the assay to determine if any non-specific signal occurred.
Selection and Preparation of Human Frontal and Parietal Cortical Tissue
Human frontal and parietal cortical tissue samples were obtained from the Charles F. and Joanne Knight Alzheimer’s Disease Research Center (KADRC) at Washington University School of Medicine in Saint Louis, Missouri. Cognitive status was determined with a validated retrospective postmortem interview with an informant to establish the Clinical Dementia Rating (CDR). For the validation of this assay, we used tissue from cognitively normal subjects with minimal AD pathology (CDR 0, mean age=91.0 ± 7.9 yrs) (n=10), cognitively normal with Alzheimer’s pathology (CDR 0, mean age=90.2 ± 6.8 yrs) (n=14 frontal, 10 parietal), and mildly demented Alzheimer’s patients (CDR 1, mean age=87.7 ± 7.5 yrs) (n=9 frontal, 7 parietal). One CDR 1 frontal cortex sample was excluded from the study due to the lack of plaque pathology. Brains from prospectively assessed individuals were obtained at autopsy with a mean postmortem interval of 11.7 ± 5.7 hours. The right hemispheres from each case were coronally sliced and frozen between pre-cooled Teflon coated plates, placed in a freezer rack, and lowered into liquid nitrogen vapor in a cryo-vessel. Following the initial freezing, tissues were stored at −80°C. Tissue was partially thawed and subdivided into blocks of approximately 0.5–1 cm3 and then refrozen for measurement of amyloid-β oligomer or fixed for histological assessment of amyloid-β plaque deposition.
Preparation and Measurement of Amyloid-β Oligomers in Human Cortical Tissue Homogenates
Frozen cortical samples including both gray and white matter were weighed and immediately dounce homogenized in ice-cold PBS containing protease inhibitor (137 mM sodium chloride, 7.76 mM sodium phosphate dibasic, 2.17 mM monopotassium phosphate, 2.7 mM potassium chloride, 2 μg/mL aprotinin, 1 μg/mL leupeptin) at a 10:1 PBS volume: tissue weight ratio using a constant 25 manual strokes. The resulting homogenate was centrifuged in a Beckman Optima TLX ultracentrifuge with a TLA-55 rotor at 100,000xg to remove insoluble fibril material. Aliquots of the cleared homogenates were prepared and frozen at −80°C. The concentration of each sample was determined using a standard BCA protein assay. The concentration of PBS soluble amyloid-β oligomers in each sample was measured in triplicate at empirically determined dilutions and expressed as picograms dimer equivalents/milligrams total soluble protein. The accuracy and reproducibility of the method was determined by the ability to recover a known amount of dimer standard, spiked at three concentrations (12.5, 25, 50 pg/mL), in five brain homogenates from cognitively normal subjects without Aβ pathology, measured in six independent assays.
Control for Artifactual Oligomerization
As a control for artificial oligomerization, HFIP-treated monomeric Aβ42 at a final concentration of 1 ng/mL was spiked into the homogenization buffer of five cognitively subjects without Aβ pathology just prior to tissue homogenization. As an additional control for recovery, 12.5 pg/mL amyloid-β dimer was included in separate matched samples prior to homogenization.
Histological Assessment of Aβ Plaque Pathology
Tissues were fixed by overnight immersion in buffered 4% paraformaldehyde, followed by equilibration in 30% sucrose. Sections were cut at 50 μm on a frozen platform cryostat and maintained in a cryoprotectant buffer (2.7 M ethylene glycol, 0.44 M sucrose, 30 mM phosphate buffer, pH 7.4) prior to immunohistochemistry. Floating tissue sections were washed 3× in Tris-buffered saline (TBS) for 5 minutes each and then incubated with 0.3% H2O2 in TBS for 10 minutes at room temperature to block endogenous peroxidase. Following the incubation, sections were rinsed in TBS 3× for 5 minutes each, and then blocked with 5% normal goat serum (NGS) in TBS-X for 30 minutes at room temperature. Sections were then incubated with polyclonal rabbit anti-PAN-Aβ (#44136, Invitrogen) in 5% NGS in TBS-X at a 1:700 dilution overnight at 4 °C. The following day, sections were washed 3× in TBS for 5 minutes each time and incubated with a biotinylated secondary goat anti-rabbit antibody in a 1:1000 dilution in TBS-X for 1 hour at room temperature (Vector Laboratories, Burlingame, CA). Following the incubation of the secondary antibody, the sections were washed 3× in TBS for 5 minutes each, incubated with ABC Elite (Vector Laboratories, Burlingame, CA) at a 1:400 dilution in TBS for 1 hour at room temperature, then washed with TBS 3× for 5 minutes and developed with 3,3′-Diaminobenzidine (#D5905, Sigma-Aldrich). Sections were mounted and dehydrated using a standard ethanol-xylene series followed by coverslipping.
Quantification of Plaque Pathology
Histological samples from each patient were scanned using an Olympus Nanozoomer HT System (Hamamatsu, Bridgewater, NJ). The percent of gray matter containing plaque pathology was determined for each sample using the Image J program (NIH). The gray matter boundary was determined using a Nissl stain (cresyl violet) on an adjacent section and redrawn three times to ensure repeatability. During quantitation, the samples were coded so the user was blinded to oligomer assay results. A manual thresholding approach was used. Data from 8 slices per brain sample, spaced every 1 mm were averaged.
Western Blot
Samples for Western blot analysis were combined with standard Laemmli buffer and heated to 85°C to denature for 5 minutes. Homogenates containing amyloid-β were denatured in the absence of SDS to prevent artificial oligomerization. Fractions containing Aβ1-40Ser26Cys dimer were denatured in the absence of 2-mercaptoethanol to prevent reduction of the disulfide-bridge. Protein samples were size separated on NuPAGE® 12% Bis-Tris gels (Invitrogen) in 2-(N-morpholino)ethanesulfonic acid (MES) SDS running buffer at 150 Volts. SeeBlue® Plus-2 prestained standard (Invitrogen) was used to visualize and estimate the progression and size of the sample migration. Gels were then transferred to 0.2 μm nitrocellulose using Towbin buffer (25 mM Tris, 192 mM glycine, pH 8.6) containing 20% methanol at 150 mA for 1 hour. For Aβ western blotting, membranes were incubated at 95°C for 1 minute in PBS to allow for improved antigen binding and then cooled in room temperature PBS prior to blocking. Membranes were blocked in 2% non-fat dry milk (NFDM) PBS for 1 hour. Between all remaining steps, membranes were washed 3x for 10 minutes each with PBS-T (0.05% Tween 20). For detection of amyloid-β, the N-terminal mouse monoclonal 82E1 (IBL-America, Minneapolis, MN) was used at 0.1 μg/mL in 2% NFDM PBS overnight at 4°C. For detection of amyloid precursor protein (APP), the mouse monoclonal 6E10 (Covance, Princeton, NJ) was used at 1 μg/mL in 2% NFDM PBS overnight at 4°C. Bound primary antibodies were detected using a sheep anti-mouse-HRP (#NA931V, GE Healthcare) at 50 ng/mL in 2% NFDM PBS and then developed with ECL Advance Reagent (GE Healthcare) followed by exposure to film emulsion.
Measurement of Overall Amyloid-beta Levels in Human Frontal Cortical Tissue Homogenates
PBS soluble homogenates prepared as described above were used to assess the overall levels of Aβ by ELISA. The insoluble cortical tissue pellet remaining after PBS homogenization was dounce homogenized in ice-cold 5M guanidine-hydrochloride, pH 8.0, containing protease inhibitor (2 μg/mL aprotinin, 1 μg/mL leupeptin) at a 10:1 guanidine: tissue weight ratio using a constant 25 manual strokes. The lysates were then incubated overnight at 4°C. The resulting guanidine soluble homogenate was centrifuged in a Beckman Optima TLX ultracentrifuge with a TLA-55 rotor at 100,000xg to remove any insoluble material. Aliquots of the cleared homogenates were prepared and frozen at −80°C. The concentration of each sample was determined using a standard BCA protein assay. Overall Aβ levels were assessed using sandwich ELISAs as described previously 39. These ELISAs do not distinguish between monomeric and aggregated Aβ. Briefly, a mouse anti-Aβ40 antibody (mHJ2) or mouse anti-Aβ42 antibody (mHJ7.4) was used to capture and a biotinylated central domain antibody (mHJ5.1) was used to detect, followed by streptavidin-poly-HRP-40 (Fitzgerald Industries, Action, MA). All ELISA assays were developed using Super Slow ELISA TMB (Sigma) and absorbance read on a BioTek Synergy 2 plate reader at 650 nm. For the insoluble fraction samples, 5M guanidine was included in the standard curve at an equivalent sample ratio to account for any effect caused by guanidine to the curve dynamics. The resulting values have been expressed as pg of Aβ/mg of soluble protein.
Size Exclusion Chromatography
Representative cortical homogenates from the cognitively normal with Alzheimer’s pathology (CDR 0 + plaques, n=3) and mildly demented Alzheimer’s (CDR 1, n=3) groups were prepared in PBS as described above and normalized to 20 mg/mL. Immediately following ultracentrifugation a 1 mL injection of each sample was separated on a Superdex 200 10/300 GL column eluted with 30 mL of PBS at a flow rate of 0.3 mL/min. Twenty-three fractions of 1 mL were collected starting at the 6th mL (termed fraction 6). Total Aβ in each fraction was assessed by an indirect ELISA using biotinylated HJ5.1 antibody 35, 39 which was raised using a mid-domain epitope, amino acids 13–28, at 0.2 μg/ml concentration. Detection was performed using streptavidin conjugated HRP, as described above. Oligomeric Aβ was detected on each fraction using our plate-based fluorescence immunoassay. Globular protein standards (Biorad) included thyroglobulin (670 kDa), gamma-globulin (158 kDa), ovalbumin (44 kDa), myoglobin (17 kDa), and vitamin B12 (1.35 kDa).
Immunoprecipitation-Western Blotting
Additional representative cortical homogenates from the cognitively normal with Alzheimer’s pathology (CDR 0, n=2) and mildly demented Alzheimer’s (CDR 1, n=2) groups were prepared in PBS as described above and normalized to 20 mg/mL. Using 1 mL of each sample, an immunoprecipitation was performed with 2 μg of HJ3.4 overnight at 4°C and subsequently captured by 50 μg Protein-G Dynabeads® and processed for Western blot with 82E1 as described above.
Assessment of X-34 Positive Fibrillar Plaque Pathology
X-34 dye (generous gift from Dr. Robert Mach, Washington University) was used to stain 50-μm frontal cortex sections adjacent to those used for immunohistochemical assessment of amyloid-β plaque pathology as previously described 40. X-34 stained sections were scanned using the FITC channel on an Olympus Nanozoomer HT System (Hamamatsu). For quantitative analyses of X-34 staining, scanned images were exported with NDP viewer software (Hamamatsu) and measured using Image J program (NIH). A manual thresholding approach was used and objects identified were inspected to confirm or reject from analysis. During quantitation, the samples were coded so the user was blinded to patient identifiers. Data from 4 sections per brain sample, spaced every 1 mm were averaged.
Cerebrospinal Fluid Assessments
Cerebrospinal fluid samples were obtained by lumbar puncture as described previously 41. Briefly, 20–30 mL of CSF was collected at 8 AM after overnight fasting. Samples were gently inverted to avoid possible gradient effects, briefly centrifuged at low speed, and aliquoted into polypropylene tubes containing ethylenediaminetetraacetic acid (EDTA) prior to freezing at −84°C. Previously frozen, never thawed aliquots of CSF were assessed for amyloid-beta oligomers in a blinded fashion. Total tau, phosphorylated-tau at residue 181 (ptau181), and Aβ1-42 values were measured by ELISA (Innotest, Innogenetics) and have been previously reported 42. CSF ELISA data was generously provided by Dr. Anne Fagan. These subjects were not the same as those used for post-mortem analysis of cortex tissue.
Statistical Methods
All data were analyzed using Statistica 6.0 (StatSoft, Tulsa, OK) or Prism 5.0 (GraphPad Software, La Jolla, CA). The Shapiro-Wilk normality test was used to determine whether Aβ oligomer levels or Aβ plaque loads were normally distributed. When non-normal distributions in at least one patient group were observed, Mann-Whitney U tests were used to compare the levels between groups. When levels were normally distributed, t-tests or one-way ANOVA with Bonferroni’s multiple comparison tests were used. Pearson product moment correlations and linear regression analyses were performed to assess the relationships between Aβ oligomer levels and Aβ plaque loads in the two groups of patients (CDR 0 with pathology, CDR1). Although the distribution of Aβ oligomer levels was not normally distributed, there were approximately linear correlations between Aβ oligomer levels and Aβ plaque loads and the distribution of residuals was normally distributed. The 95% confidence intervals of the slopes of the linear regressions were calculated and the slopes of the regressions were compared between groups using an F-test.
RESULTS
We performed several tests of the sensitivity and specificity of the HJ3.4-based, 384 well plate single photon counting immunoassay. The number of single photon detected events rose monotonically with increasing concentrations of synthetic Aβ dimers (Fig. 1A). Levels as low as 1.56 pg/ml were detectible above background (Fig. 1A inset). Using strict criteria for quantitative reliability, the lower limit of quantitation was determined to be 6.25 pg/ml (Table 1), or 0.72 pM (calculated molecular weight of the synthetic dimers 8690.8 Da). The assay did not detect monomeric Aβ at concentrations as high as 10,000 pg/ml (Fig. 1B). Aβ was maintained in monomeric form using the 0.1% HFIP to disrupt hydrogen bonding (Fig. 1C left lane), as otherwise many species of Aβ will aggregate spontaneously in physiological solutions. HFIP at this concentration did not interfere with the sensitivity of the assay (Fig. 1D). Likewise, the assay was similarly sensitive to another synthetic Aβ heterogeneous oligomer preparation, produced by incubating monomeric Aβ under conditions favoring aggregation, and then cross linking the aggregates with glutaraldehyde (Fig. 1D).
Figure 1.

Sensitivity and specificity characteristics of the Aβ oligomer assay. A. Standard curve demonstrating a monotonic relationship between detected events and the concentration of synthetic Aβ1-40Ser26Cys dimer. Inset: concentrations of Aβdimer as low as 3.125 pg/ml were detectible above background. B. Specificity for Aβ dimers over Aβmonomers. (Note the log scale of the x-axis) C. Western blot demonstrating that the Aβ monomer preparation did not contain dimer and the Aβ1-40Ser26Cys dimer preparation did not contain Aβ monomer. D. Sensitivity of the assay to another type of synthetic Aβ oligomers, prepared using aggregated wild-type sequence Aβ cross-linked with glutaradehyde. Right: Western blot demonstrating a mixture of monomers, dimers, trimers and tetramers in this preparation. E. Immunodepletion experiment demonstrating that HJ3.4, the antibody used in the Aβ oligomer assay, does not bind APP in solution. Controls: 82E1 is known to require a free amino terminus of Aβ to bind, and therefore does not recognize APP, whereas 6E10 is known to bind both APP and Aβ (Reproduced from Tran et al. 201143). F. Specificity for Aβ dimers over aggregated A-Dan and A-Bri, two non-Aβ peptides that readily oligomerize. (Note the log scale of the x-axis) G. Specificity for full length Aβ dimers over N-terminally truncated, pyroglutamate modified Aβ oligomers. H. Sensitivity to Aβ dimers is unchanged in the presence of high concentrations of Aβ monomers.
TABLE 1.
Amyloid-β Oligomer Assay Characteristics
| Amyloid-β Dimer Standards (pg/mL) | ||||||||
|---|---|---|---|---|---|---|---|---|
| 200 | 100 | 50 | 25 | 12.5 | 6.25 | 3.125 | 1.56 | |
| Intra-assay | ||||||||
| %CV mean | 2.14 | 2.86 | 1.73 | 3.80 | 5.63 | 7.58 | 5.93 | 23.67 |
| % CV upper bound | 2.51 | 10.7 | 2.27 | 5.78 | 6.51 | 9.25 | 9.18 | 30.0 |
| %RE mean | −0.06 | 0.40 | −1.97 | 4.98 | −5.30 | 3.45 | −19.67 | 21.95 |
| %RE upper bound | 0.07 | 1.05 | 3.31 | 7.22 | 11.45 | 15.72 | 29.97 | 36.89 |
| Replicates (N) | 6 | 6 | 6 | 6 | 6 | 6 | 6 | 6 |
| Quantitation criteria?* | Yes | Yes | Yes | Yes | Yes | Yes | ‘sometimes’ | ‘rarely’ |
| Inter-assay | ||||||||
| Mean (pg/mL) | 200.12 | 99.60 | 50.98 | 23.76 | 13.16 | 6.03 | 3.74 | 1.22 |
| SD | 0.07 | 0.32 | 0.43 | 0.40 | 0.39 | 0.51 | 0.22 | 0.23 |
| %CV | 0.04 | 0.32 | 0.85 | 1.70 | 2.94 | 8.42 | 5.99 | 19.1 |
| Samples (N) | 6 | 6 | 6 | 6 | 6 | 6 | 6 | 6 |
%CV: % coefficient of variation.
%RE: % relative error.
Quantitation criteria: Sum of %CV and absolute %RE <30%
SD: Standard deviation
The HJ3.4 antibody used in this assay did not recognize amyloid precursor protein 43. To verify this specificity, an immunodepletion assay was performed on brain homogenate from a 9 month old 3xTg-AD mouse 38 containing high levels of human amyloid precursor protein. Incubation with 6E10 44, a monoclonal antibody known to recognize both Aβ and amyloid precursor protein 45, 46, depleted the lysates of immunoreactivity at the expected molecular weight of amyloid precursor protein (Fig. 1E), whereas incubation with 82E1, a monoclonal antibody with known specificity for Aβ over amyloid precursor protein 47 did not. Incubation with HJ3.4, like incubation with 82E1, did not deplete the lysates of amyloid precursor protein immunoreactivity (Fig. 1E). This indicated that HJ3.4 had very low binding to amyloid precursor protein in solution.
The assay was specific for oligomeric Aβ and did not recognize oligomeric forms of other peptides, unlike assays based on conformation specific antibodies 8. Oligomeric forms of A-Dan, implicated in familial Danish dementia 48 and A-Bri, implicated in familial British dementia 49, were not detected at concentrations as high as 200 pg/ml (Fig. 1F). Likewise, oligomeric forms of N-terminally truncated and pyro-glutamate modified Aβ 50 were not detected by the assay (Fig. 1G).
In principle, because the HJ3.4 antibody used to coat the plate binds to both monomeric and oligomeric Aβ, high concentrations of monomers could saturate the available binding sites on the plate and reduce the sensitivity of the assay. We found no evidence of such saturation effects at monomeric Aβ concentrations up to 2000 pg/ml (Fig. 1H). Furthermore, when synthetic Aβ oligomers were added to frontal cortex homogenates, the levels detected were greater than 90% of the expected levels. Specifically, recovery was 96–100% when 12.5 pg/ml synthetic Aβ oligomers were added. 91–93% when 25 pg/ml were added, and 95–96% when 50 pg/ml were added. Each recovery assay was performed in 5 separate brain homogenates. Thus, the immunoassay was demonstrated to be both highly sensitive to and specific for oligomeric Aβ.
To demonstrate the utility of the assay, we assessed frontal cortex samples obtained at autopsy from normal elderly controls without significant AD pathology, non-demented (CDR 0) elderly patients with known Aβ plaque pathology, and patients with mild dementia of the Alzheimer’s type (CDR 1) and Aβ plaque pathology. The 3 groups of patients did not differ in age (p=0.83, Kruskal-Wallis Test) or post-mortem interval (p=0.46). Most were female (Table 2). As expected, Aβ immunohistochemistry revealed no plaque pathology in the normal elderly controls (Fig. 2A–C). There were variable degrees of plaque coverage in both the CDR 0 non-demented elderly patients with known Aβ plaque pathology (Fig. 2D–F) and the patients with CDR1 mild dementia of the Alzheimer’s type (Fig. 2G–I). The plaque coverage expressed as % of gray matter area was quantified in a blinded fashion on 8 slices per brain sample. The extent of Aβ plaque coverage did not differ between non-demented elderly patients with plaque pathology and patients with mild dementia of the Alzheimer’s type in this study (p=0.11, Fig. 2J). This is consistent with previous reports on “preclinical” AD 1, 3, 51.
TABLE 2.
Characteristics of Human Brain Frontal Cortex Samples
| Subject ID | Status | Age (yrs.) | PMI (hrs.) | Gender |
|---|---|---|---|---|
| Patient – 1 | CDR 0 | 85 | 20.5 | female |
| Patient - 2 | CDR 0 | 86.3 | 6.3 | female |
| Patient - 3 | CDR 0 | 90 | 9.5 | female |
| Patient - 4 | CDR 0 | 78.5 | 15.75 | male |
| Patient -5 | CDR 0 | 91.5 | 16 | male |
| Patient - 6 | CDR 0 | 95.6 | 9.1 | female |
| Patient - 7 | CDR 0 | 107.8 | 5 | female |
| Patient - 8 | CDR 0 | 87.2 | 12 | male |
| Patient - 9 | CDR 0 | 96 | 12 | male |
| Patient - 10 | CDR 0 | 92.1 | 6 | female |
| Patient - 11 | CDR 0 +path | 94.5 | 10.75 | female |
| Patient - 12 | CDR 0 +path | 91.6 | 16 | female |
| Patient - 13 | CDR 0 +path | 88.3 | 9 | male |
| Patient - 14 | CDR 0 +path | 92.1 | 17 | female |
| Patient - 15 | CDR 0 +path | 98 | 18.5 | female |
| Patient - 16 | CDR 0 +path | 91.1 | 12.3 | female |
| Patient - 17 | CDR 0 +path | 93.7 | 10 | female |
| Patient - 18 | CDR 0 +path | 80.7 | 5.5 | female |
| Patient - 19 | CDR 0 +path | 91.6 | 16 | female |
| Patient - 20 | CDR 0 +path | 104 | 13 | female |
| Patient - 21 | CDR 0 +path | 90 | 24 | female |
| Patient - 22 | CDR 0 +path | 85.8 | 7 | female |
| Patient - 23 | CDR 0 +path | 78 | 15.5 | male |
| Patient - 24 | CDR 0 +path | 83.6 | 7.25 | female |
| Patient - 25 | CDR 1 | 82.7 | 13 | male |
| Patient - 26 | CDR 1 | 96 | 5.25 | female |
| Patient - 27 | CDR 1 | 80.2 | 6.3 | female |
| Patient - 28 | CDR 1 | 86 | 13 | female |
| Patient - 29 | CDR 1 | 92 | 23 | female |
| Patient - 30 | CDR 1 | 96 | 7.6 | female |
| Patient - 31 | CDR 1 | 88 | 3.15 | female |
| Patient - 32 | CDR 1 | 74.6 | 13 | female |
| Patient - 33 | CDR 1 | 94 | 11.6 | female |
PMI:Post-Mortem Interval; CDR: Clinical Dementia Rating
Figure 2.

Oligomerization of Aβ is tightly linked to plaque density in dementia of the Alzheimer type but not in high pathology elderly controls. A–C. Aβ immunohistochemistry using a polyclonal rabbit anti-pan-Aβ on frontal cortex sections from normal elderly controls demonstrates the absence of plaque pathology. Scale bar: 1 mm applies to panels A–I. D–F. Aβ plaque pathology in frontal cortex sections from non-demented elderly subjects (CDR 0). G–I. Aβ plaque pathology in frontal cortex sections from elderly subjects with mild dementia of the Alzheimer’s type (CDR 1). J. Gray matter coverage by Aβ plaque pathology was not different in the non-demented elderly subjects with plaques (CDR 0 + plaques) vs. subjects with mild dementia of the Alzheimer’s type (CDR 1). K. Aβ oligomer levels in PBS-soluble frontal cortical homogenates. (** p=0.0023, *** p=0.0003, Mann Whitney U tests). Oligomer levels expressed as pg dimer equivalents per mg total protein in homogenates. L. Control for artifactual oligomerization of monomeric Aβ during homogenization and analysis. The addition of 1000 pg/ml of monomeric Aβ1-42 spiked into the homogenization buffer along with brain tissue from normal control subjects did not result in any detectible oligomer signal. The presence of brain homogenate did not obscure or block oligomer detection, as spiking in Aβdimer resulted in the expected elevation in signal (*** p=0.0001, 1-way ANOVA). M. Correlations between Aβ oligomer levels (y-axis) and gray matter Aβ plaque pathology coverage (x-axis). r2 values represent Pearson product moment correlations. N. Ratio of Aβ oligomer levels to Aβ plaque pathology coverage was higher in subjects with mild dementia of the Alzheimer’s type (CDR 1) vs non-demented elderly subjects with plaques (CDR 0 + plaques). There was no overlap between groups (***p=0.0001, Mann Whitney U test).
Adjacent frontal cortex samples from the same patients were homogenized and found to contain variable levels of Aβ oligomers (Fig. 2K). Similar results in demented patients have been reported previously using an immunoprecipitation and Western blotting-based approach 13. Aβ oligomer levels for the normal controls were essentially at or only slightly above the lower limit of quantitation. Aβ oligomer in both the CDR 0 with plaque pathology group and the CDR 1 group were significantly elevated (p=0.0003, Mann Whitney U Tests). The Aβ oligomer levels in the CDR 0 plus pathology group were statistically lower than those in the CDR 1 group (p=0.0023). However, there was considerable overlap between groups (Fig. 2K).
Aβ oligomerization did not appear to be an artifact of the homogenization and assay procedures. The addition of 1000 pg/ml of Aβ1-42 added into the homogenization buffer along with brain tissue from normal control subjects before homogenization did not result in any detectible oligomer signal (Fig. 2L). The presence of brain homogenate did not obscure or block oligomer detection, as addition of Aβdimer to homogenates resulted in the expected elevation in signal.
Interestingly, the quantitative correlation between Aβ oligomer levels and Aβ plaque coverage was very strong in the CDR 1 group (r2 =0.88), but less tight in the CDR 0 plus plaque pathology group (r2 =0.33, Fig. 2M). The slopes of the regression lines were statistically significantly different (F(1,19)= 52.8, p=<0.0001). Unlike plaque area or oligomer measurements in isolation, the ratio of Aβ oligomer levels to Aβ plaque coverage completely distinguished the two groups, with no overlap in these populations (Fig. 2N).
We next repeated these analyses in parietal cortex samples and obtained qualitatively similar results. As in frontal cortex, the extent of parietal cortex Aβ plaque coverage did not differ significantly between CDR 0 plus plaque pathology subjects and CDR 1 subjects (p=0.16, Fig. 3A). Likewise, The Aβ oligomer levels in the CDR 0 plus pathology group were statistically lower than those in the CDR 1 group (p=0.014) but there was considerable overlap between groups (Fig. 3B). Most importantly, the ratio of Aβ oligomer levels to Aβ plaque coverage again completely distinguished the two groups, with no overlap in these populations (Fig. 3C).
Figure 3.
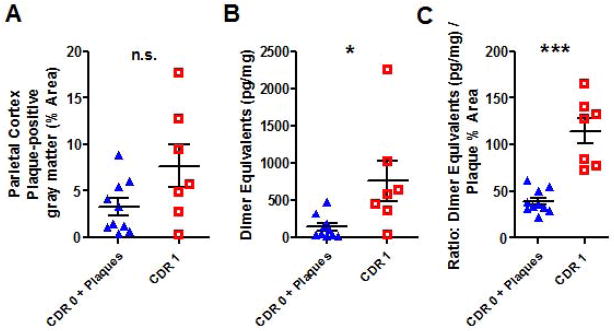
Similar relationship between Aβ oligomerization and plaque pathology in parietal cortex. A. Parietal gray matter coverage by Aβ plaque pathology was not different in the non-demented elderly subjects with plaques (CDR 0 + plaques) vs. subjects with mild dementia of the Alzheimer’s type (CDR 1). B. Aβ oligomer levels in PBS-soluble parietal cortical homogenates. (* p=0.014, Mann Whitney U test). C. Ratio of Aβ oligomer levels to Aβ plaque pathology coverage was higher in subjects with mild dementia of the Alzheimer’s type (CDR 1) vs non-demented elderly subjects with plaques (CDR 0 + plaques). As in frontal cortex, there was no overlap between groups (***p=0.0001, Mann Whitney U test).
Several other measures did not fully distinguish CDR 1 from CDR 0 plus plaque pathology samples. Specifically, we assessed measurements of PBS-soluble Aβ1-40, PBS-soluble Aβ1-42, guanidine-soluble Aβ1-40, guanidine-soluble Aβ1-42, X-34 labeled fibrillar plaque areas, and ratios of these parameters to Aβ plaque area (Figs. 4–5). Expected differences from normal controls and correlations between parameters were observed, but there was substantial overlap in every measure between the CDR 1 and CDR 0 plus plaque pathology groups.
Figure 4.

Assessments based on overall Aβ levels did not distinguish tissue from patients with mild dementia of the Alzheimer type (CDR 1) vs. non-demented elderly patients with plaque pathology (CDR 0 + plaque). A. No difference between groups in overall PBS-soluble Aβ1-40 levels, as measured using a standard sandwich ELISA. Data expressed as pg of Aβ per mg total protein. B. Overall PBS-soluble Aβ1-42 levels were not different in the CDR 0 + plaque vs. CDR 1 group, though levels in both groups were higher than in the normal control group (*p < 0.05, *** p < 0.001, Kruskall Wallis ANOVA with Dunn’s post-hoc test). C. Ratio of overall PBS-soluble Aβ1-42 levels to overall PBS-soluble Aβ1-40 levels did not distinguish CDR 0 + plaque vs. CDR 1 groups. The CDR 0 + plaque group had higher ratios than the control group (**p < 0.01). D–E. Overall Guanidine-soluble Aβ1-40 levels and Aβ1-42 levels were not different in the CDR 0 + plaque vs. CDR 1 group. Levels in both groups were higher than in the normal control group for both measures. F. Ratio of overall Guanidine-soluble Aβ1-42 levels to overall PBS-soluble Aβ1-40 levels did not distinguish CDR 0 + plaque vs. CDR 1 groups. The CDR 0 + plaque group had higher ratios than the control group (*** p < 0.001). G–H. Correlations between overall PBS-soluble Aβ1-40 and Aβ1-42 levels vs. plaque-positive gray matter. The correlation was only significant (p = 0.0023) for PBS-soluble Aβ1-42 vs. plaque area in the CDR 0 + plaque group. I–J. Ratios of overall PBS-soluble Aβ1-40 and Aβ1-42 levels to plaque-positive gray matter area coverage did not distinguish CDR 0 + plaque vs. CDR 1 groups (n. s. not significant, Mann-Whitney U Tests). K–L. Significant correlations between overall Guan-soluble Aβ1-40 and Aβ1-42 levels vs. plaque-positive gray matter. (p = 0.01 for Guan-soluble Aβ1-40 vs. plaque area in the CDR 1 group, p = 0.02 for Guan-soluble Aβ1-42 vs. plaque area in the CDR 0 + plaque group, p = 0.04 for Guan-soluble Aβ1-42 vs. plaque area in the CDR 1 group). M–N. Ratios of overall Guan-soluble Aβ1-40 and Aβ1-42 levels to plaque-positive gray matter area coverage did not distinguish CDR 0 + plaque vs. CDR 1 groups (n. s. not significant, Mann-Whitney U Tests).
Figure 5.

Assessments based on X-34 staining of fibrillar plaque pathology did not distinguish between tissue from patients with mild dementia of the Alzheimer type (CDR 1) vs. non-demented elderly patients with plaque pathology (CDR 0 + plaque). A–I: Exemplar images of X-34 staining in frontal cortex sections. Scale bar = 1 mm. J. Gray matter coverage by X-34 in CDR 0 + plaques group vs. CDR 1 group (n.s., Mann Whitney U test). K. Correlations between overall Aβ plaque coverage vs. X-34 positive fibrillar plaque coverage. (Spearman r = 0.65, p = 0.06 for the CDR 1 group). L. Correlations between Aβ oligomer levels (dimer equivalents) and gray matter X-34 positive fibrillar plaque pathology coverage. M. Ratio of Aβ oligomer levels (dimer equivalents) to X-34 positive fibrillar plaque pathology coverage was higher in the CDR 0 + plaque group (p = 0.02, Mann Whitney U test). However, there was substantial overlap between groups.
Despite the high sensitivity of the assay, oligomeric Aβ was not detected in cerebrospinal fluid samples from separate patients with mild dementia of the Alzheimer’s type (Table 3). Many of these samples had low Aβ1-42, high tau and high phospho-tau, consistent with previously reported cerebrospinal fluid biomarkers of Alzheimer’s disease pathology 42.
Table 3.
Characteristics of Human Cerebrospinal Fluid Samples
| Subject ID | CDR Status | Age at L.P. (yrs.) | Tau (pg/ml) | Phospho-tau (pg/ml) | Overall Aβ1-42 (pg/ml) | Oligomeric Aβ (dimer equivalents pg/ml) |
|---|---|---|---|---|---|---|
| 34 | 0 | 68.2 | 246 | 164 | 1080 | <6.25 |
| 35 | 0 | 66.6 | 216 | 52 | 1024 | <6.25 |
| 36 | 0 | 72.5 | 198 | 49 | 976 | <6.25 |
| 37 | 0 | 69.0 | 373 | 73 | 844 | <6.25 |
| 38 | 0 | 74.0 | 280 | 81 | 1033 | <6.25 |
| 39 | 0 | 74.2 | 531 | 95 | 1150 | <6.25 |
| 40 | 0 | 67.9 | 280 | 86 | 924 | <6.25 |
| 41 | 0 | 80.5 | 428 | 96 | 1052 | <6.25 |
| 42 | 0 | 70.6 | 378 | 85 | 1083 | <6.25 |
| 43 | 0 | 69.5 | 397 | 79 | 1233 | <6.25 |
| 44 | 0.5 | 79.3 | 228 | 50 | 265 | <6.25 |
| 45 | 0.5 | 68.4 | 117 | 21 | 359 | <6.25 |
| 46 | 0.5 | 72.4 | 650 | 165 | 312 | <6.25 |
| 47 | 0.5 | 80.8 | 1155 | 162 | 167 | <6.25 |
| 48 | 0.5 | 72.5 | 370 | 77 | 328 | <6.25 |
| 49 | 1 | 74.5 | 928 | 107 | 226 | <6.25 |
| 50 | 1 | 70.6 | 493 | 57 | 210 | <6.25 |
| 51 | 1 | 81.5 | 597 | 102 | 296 | <6.25 |
| 52 | 1 | 72.4 | 585 | 94 | 354 | <6.25 |
| 53 | 1 | 84.4 | 383 | 70 | 360 | <6.25 |
CDR: Clinical Dementia Rating, L.P.: Lumbar puncture.
Tau, phospho-tau and overall Aβ1-42 were measured by standard ELISA.
To determine whether the size forms of oligomeric Aβ also differed between CDR 1 and CDR 0 plus plaque pathology samples, we used two methods: immunoprecipitation-Western blotting and size exclusion chromatography. On immunoprecipitation-Western blotting, we observed primarily ~4 kDa and ~8 kDa bands consistent with monomers and dimers. These were present in both CDR 1 and CDR 0 plus plaque pathology samples. However, the dimer band could not be reliably quantified because its intensity was highly variable in our hands when aliquots of the same homogenates were assessed repeatedly.
On size exclusion chromatography, we detected oligomeric Aβ using our plate-based fluorescence immunoassay primarily in fractions 7–10 from both CDR 1 and CDR 0 plus plaque pathology samples (Figure 6A, representative of samples from 3 patients in each group). These fractions correspond to high molecular weight species, as a thyroglobulin protein standard (670 kDa) eluted off the column in fractions 8–10 (Figure 6C). The exact size of the oligomeric Aβ cannot be determined precisely, however, because aggregated Aβ likely does not behave like a globular protein. Importantly, though, the location and shape of the peak did not differ between CDR 1 and CDR 0 plus plaque pathology samples. Furthermore, there was no oligomer signal in fractions 15–19 (Figure 6A), where synthetic monomeric and dimeric Aβ eluted (Figure 6D). The same fractions were assessed for total Aβ using an indirect ELISA that does not distinguish monomeric from oligomeric species. Fractions 15–19 from both CDR 1 and CDR 0 plus plaque pathology samples contained substantial amounts of Aβ (Figure 6B). Our plate-based fluorescence immunoassay is capable of detecting Aβ dimers if present (Figure 1), which indicates that most likely the Aβ in fractions 15–19 in monomeric. Taken together, these results indicate that and the majority of Aβ oligomeric species in these lysates are high molecular weight, and that the size of the oligomers does not distinguish between demented and non-demented subjects with Aβ plaque pathology.
Figure 6.

Size exclusion chromatography indicated that Aβ oligomers were primarily high molecular weight both in non-demented patients with Aβ plaque pathology (CDR 0 + Plaques) and patients with mild dementia of the Alzheimer type (CDR 1). A. Plate-based fluorescence immunoassay for Aβ oligomers, reported as detected events, for serial fractions eluted with PBS off of a Superdex 200 10/300 GL column: larger molecules elute in earlier fractions, and smaller molecules elute in later fractions. Aβ oligomers eluted in fractions 7–10 for both samples. Dashed line indicates background levels of detected events. B. Total Aβ assessed by indirect ELISA in the same fractions. Total Aβ eluted in 2 peaks, a high molecular weight peak in fractions 7–10 corresponding to oligomeric Aβ shown in panels A, and a lower molecular weight peak in fractions 15–19 likely corresponding to monomeric Aβ. C. Globular protein size standards, run on the same column under the same conditions. D. Synthetic Aβ dimers run on the same column under the same conditions eluted in fractions 14–19, and synthetic Aβ monomers eluted in fractions 15–19, as assessed by total Aβ indirect ELISA.
DISCUSSION
In summary, we have developed a sensitive, specific and quantitative assay for Aβ oligomers. Using this assay, we have demonstrated that Aβ oligomer levels are tightly linked to plaque deposition in frontal cortex samples from patients with clinical dementia of the Alzheimer’s type, but much less tightly linked in cognitively normal elderly patients with comparable levels of Aβ plaque deposition. This relationship has not been previously recognized to our knowledge, and this finding exemplifies the utility of the Aβ oligomer assay described here. An important finding is that cognitively normal patients with Aβ plaque pathology can have substantial levels of Aβ oligomers, levels as high as some CDR 1 demented patients. This suggests that oligomer levels per se in brain lysates may not be a direct correlate of dementia, but that the events leading to a tight linkage between plaques and oligomers may play a pathophysiological role in the progression of clinical disease status.
A caveat to this interpretation is that the quantitative measure that fully distinguished demented from non-demented patients with Aβ plaque pathology, the ratio of Aβ oligomers to plaque area, is a derived variable from post-hoc analysis. We performed a total of 14 post-hoc analyses, and none of the others distinguished between these groups. From a statistical perspective, the p-value for comparison between groups in the ratio of Aβ oligomers to plaque area was < 0.0001. Thus even after stringent correction for multiple comparisons by the Bonferroni method, this would still yield a corrected p-value of <0.0014, highly unlikely to have occurred by chance.
A recent study has demonstrated that soluble oligomers isolated from Alzheimer’s cortex cause cytoskeletal abnormalities at 100-fold less concentration than synthetic dimers in primary hippocampal neuron cultures 52. This finding, along with our observation of oligomers in preclinical AD subjects, raises the intriguing possibility that there could be a shift in neurotoxicity in oligomeric species during disease progression. The combination of sensitive toxicity assessments and a quantitatively rigorous Aβ oligomer assay would be greatly beneficial in addressing this question and directing therapeutic development.
Aβ oligomerization has been hypothesized to underlie cognitive deterioration in dementia of the Alzheimer’s type. However, detection of Aβ oligomers has not been reported in the living human brain. In principle, tissue homogenization and oligomer assay procedures could result in artifactual Aβ oligomerization, but such artifactual oligomerization does not appear to be occurring to any appreciable extent using the methods described here. This adds confidence to the conclusion that the Aβ oligomers detected arose in situ, although it does not settle the question of whether they formed pre- or post-mortem.
We were unable to detect oligomers in cerebrospinal fluid from patients with mild dementia of the Alzheimer’s type with this assay. We have not performed direct comparisons with other methods used to assess CSF 53, 54 and thus our results should be interpreted with caution. Aβ oligomers with N-terminal modification or Aβ oligomers at very low concentrations would not be detected in our assay, but could still be clinically relevant as pharmacodynamic biomarkers. Importantly, it is not known whether oligomers detected in PBS-soluble brain lysates are freely diffusible in vivo in the extracellular space of the human brain. Instead, they could in principle be loosely associated with plaques or cells where they could exert locally toxic effects 55.
Several limitations of this study should be noted. First, the sample size was relatively small, and consisted exclusively of elderly subjects with late onset dementia. A larger population allowing stratification by ApoE genotype as well as younger subjects and subjects with familial Alzheimer’s disease should be assessed. Second, only frontal and parietal cortex were assessed. The temporal lobe, posterior cingulate/precuneus, and hippocampal regions known to be especially vulnerable to Alzheimer’s pathology have not been examined. Third, the size forms of the oligomers assessed have not been resolved. This assay uses ‘dimer equivalents’ as the unit of measure, but does not distinguish between size forms; a trimer or higher order oligomer may bind more than one detecting antibody and therefore be counted as more than one oligomer. The size exclusion chromatography results indicate that any non-linearities in the way that the assay detects Aβ oligomers are not likely to underlie the differences between demented and non-demented patients with Aβ plaque pathology. Fourth, the assay does not distinguish between oligomers of Aβ peptides of various lengths including the longer C99 peptide resulting from β-secretase but not γ-secretase cleaved APP. However, in human AD brain extracts, most oligomers appear to be primarily composed of Aβ1-42.13 Fifth, the timing of when the switch from a loose correlation between Aβ plaque coverage and Aβ oligomer levels to a tight correlation has not been determined. Very mild (CDR 0.5) dementia subjects should be assessed in the future. Sixth, samples such as blood, urine, and brain interstitial fluid have not been systematically assessed and thus the utility of this method for ante-mortem detection of Aβ oligomers has not been established. If Aβ oligomers can be detected ante-mortem, the ratio of oligomer levels to PET PIB binding could be a close analog of the oligomer/plaque ratio shown here to distinguish demented and non-demented subjects. Finally, more extensive analyses of the plaque pathology may be revealing. It is not known whether neuritic dystrophy, microgliosis, post-translational modifications of Aβ, neuronal loss, synaptic disturbances, or tau pathologies are related to these findings.
Despite these limitations, these findings raise several interesting questions. Why are some Aβ plaques tightly associated with oligomers and some are not? Could early plaques serve as oligomer binding or sequestration sites which later become saturated and leave Aβ oligomers free to diffuse through the extracellular space of the brain? What are the effects of ApoE genotype, tau localization, and microglial signaling on the coupling between plaques and oligomers? What is the relationship between plaques and oligomers in transgenic mouse models of Alzheimer’s disease? The use of a sensitive, specific and quantitatively useful assay may assist in addressing these questions and many others. The very high sensitivity may be especially important for applications such as assessments of microdialysis samples, laser capture microdissection analyses, and size fractionation experiments. The quantitative reliability may be useful for the assessment of dose-response relationships in mechanistic, electrophysiological, and behavioral experiments. Finally, the 384-well plate format could lend itself to adaptation to high throughput assays of compounds designed to inhibit Aβ oligomerization.
Acknowledgments
We thank Elizabeth Macy, and John Todd for advice and assistance. Human brain and cerebrospinal fluid samples were provided by the Washington University Knight Alzheimer’s Disease Research Center. We thank Reid Townsend for use of the Erenna Immunoassay System, Frank LaFerla for providing 3xTg-AD mice, Robert Mach for providing X-34, and Anne Fagan for providing cerebrospinal fluid data.
Support: NIH R01 NS065069 (Brody), NIH K08 NS049237 (Brody), NIH AG13956 (Holtzman), a Burroughs Wellcome Career Award in the Biomedical Sciences (Brody), the Thrasher Research Fund (Brody), NIH AG029524 (Cirrito), NIH K-23-AG03094601 & R-01-NS065667 (Bateman), NIH P50AG05681 (Holtzman) the Charles F. and Joanne Knight ADRC at Washington University (Cirrito), the Cure Alzheimer’s Fund (Holtzman), and NIH Neuroscience Blueprint Core Grant to Washington University (P30 NS057105).
Footnotes
Author contributions: TJE, JRC, RJB and DLB designed research. TJE and HTZ performed research and primary data analysis. TJE and DLB performed statistical analyses, NJC contributed brain samples, DMH contributed antibodies. TJE and DLB prepared figures and wrote the paper. The corresponding author DLB has access to all of the primary data and vouches for its integrity.
References
- 1.Price JL, Morris JC. Tangles and plaques in nondemented aging and “preclinical” Alzheimer’s disease. Annals of neurology. 1999 Mar;45(3):358–68. doi: 10.1002/1531-8249(199903)45:3<358::aid-ana12>3.0.co;2-x. [DOI] [PubMed] [Google Scholar]
- 2.Aizenstein HJ, Nebes RD, Saxton JA, et al. Frequent amyloid deposition without significant cognitive impairment among the elderly. Archives of neurology. 2008 Nov;65(11):1509–17. doi: 10.1001/archneur.65.11.1509. [DOI] [PMC free article] [PubMed] [Google Scholar]
- 3.Hulette CM, Welsh-Bohmer KA, Murray MG, Saunders AM, Mash DC, McIntyre LM. Neuropathological and neuropsychological changes in “normal” aging: evidence for preclinical Alzheimer disease in cognitively normal individuals. Journal of neuropathology and experimental neurology. 1998 Dec;57(12):1168–74. doi: 10.1097/00005072-199812000-00009. [DOI] [PubMed] [Google Scholar]
- 4.Katzman R, Terry R, DeTeresa R, et al. Clinical, pathological, and neurochemical changes in dementia: a subgroup with preserved mental status and numerous neocortical plaques. Annals of neurology. 1988 Feb;23(2):138–44. doi: 10.1002/ana.410230206. [DOI] [PubMed] [Google Scholar]
- 5.Selkoe DJ. Soluble oligomers of the amyloid beta-protein impair synaptic plasticity and behavior. Behav Brain Res. 2008 Sep 1;192(1):106–13. doi: 10.1016/j.bbr.2008.02.016. [DOI] [PMC free article] [PubMed] [Google Scholar]
- 6.Wang HW, Pasternak JF, Kuo H, et al. Soluble oligomers of beta amyloid (1-42) inhibit long-term potentiation but not long-term depression in rat dentate gyrus. Brain research. 2002 Jan 11;924(2):133–40. doi: 10.1016/s0006-8993(01)03058-x. [DOI] [PubMed] [Google Scholar]
- 7.Lambert MP, Barlow AK, Chromy BA, et al. Diffusible, nonfibrillarligands derived from Abeta1-42 are potent central nervous system neurotoxins. Proceedings of the National Academy of Sciences of the United States of America. 1998 May 26;95(11):6448–53. doi: 10.1073/pnas.95.11.6448. [DOI] [PMC free article] [PubMed] [Google Scholar]
- 8.Kayed R, Head E, Thompson JL, et al. Common structure of soluble amyloid oligomers implies common mechanism of pathogenesis. Science. 2003;300(5618):486–9. doi: 10.1126/science.1079469. [DOI] [PubMed] [Google Scholar]
- 9.Dahlgren KN, Manelli AM, Stine WB, Jr, Baker LK, Krafft GA, LaDu MJ. Oligomeric and fibrillar species of amyloid-beta peptides differentially affect neuronal viability. The Journal of biological chemistry. 2002 Aug 30;277(35):32046–53. doi: 10.1074/jbc.M201750200. [DOI] [PubMed] [Google Scholar]
- 10.Ono K, Condron MM, Teplow DB. Structure-neurotoxicity relationships of amyloid beta-protein oligomers. Proceedings of the National Academy of Sciences of the United States of America. 2009 Sep 1;106(35):14745–50. doi: 10.1073/pnas.0905127106. [DOI] [PMC free article] [PubMed] [Google Scholar]
- 11.Townsend M, Shankar GM, Mehta T, Walsh DM, Selkoe DJ. Effects of secreted oligomers of amyloid beta-protein on hippocampal synaptic plasticity: a potent role for trimers. The Journal of physiology. 2006 Apr 15;572(Pt2):477–92. doi: 10.1113/jphysiol.2005.103754. [DOI] [PMC free article] [PubMed] [Google Scholar]
- 12.Walsh DM, Klyubin I, Fadeeva JV, et al. Naturally secreted oligomers of amyloid beta protein potently inhibit hippocampal long-term potentiation in vivo. Nature. 2002 Apr 4;416(6880):535–9. doi: 10.1038/416535a. [DOI] [PubMed] [Google Scholar]
- 13.Shankar GM, Li S, Mehta TH, et al. Amyloid-beta protein dimers isolated directly from Alzheimer’s brains impair synaptic plasticity and memory. Nature medicine. 2008 Aug;14(8):837–42. doi: 10.1038/nm1782. [DOI] [PMC free article] [PubMed] [Google Scholar]
- 14.Cleary JP, Walsh DM, Hofmeister JJ, et al. Natural oligomers of the amyloid-beta protein specifically disrupt cognitive function. Nature neuroscience. 2005 Jan;8(1):79–84. doi: 10.1038/nn1372. [DOI] [PubMed] [Google Scholar]
- 15.Lesne S, Koh MT, Kotilinek L, et al. A specific amyloid-beta protein assembly in the brain impairs memory. Nature. 2006 Mar 16;440(7082):352–7. doi: 10.1038/nature04533. [DOI] [PubMed] [Google Scholar]
- 16.Kuo YM, Emmerling MR, Vigo-Pelfrey C, et al. Water-soluble Abeta (N-40, N-42) oligomers in normal and Alzheimer disease brains. The Journal of biological chemistry. 1996;271(8):4077–81. doi: 10.1074/jbc.271.8.4077. [DOI] [PubMed] [Google Scholar]
- 17.Gong Y, Chang L, Viola KL, et al. Alzheimer’s disease-affected brain: presence of oligomeric A beta ligands (ADDLs) suggests a molecular basis for reversible memory loss. Proc Natl Acad Sci U S A. 2003 Sep 2;100(18):10417–22. doi: 10.1073/pnas.1834302100. [DOI] [PMC free article] [PubMed] [Google Scholar]
- 18.Tomic JL, Pensalfini A, Head E, Glabe CG. Soluble fibrillar oligomer levels are elevated in Alzheimer’s disease brain and correlate with cognitive dysfunction. Neurobiology of disease. 2009 Sep;35(3):352–8. doi: 10.1016/j.nbd.2009.05.024. [DOI] [PMC free article] [PubMed] [Google Scholar]
- 19.McLean CA, Cherny RA, Fraser FW, et al. Soluble pool of Abeta amyloid as a determinant of severity of neurodegeneration in Alzheimer’s disease. Annals of neurology. 1999 Dec;46(6):860–6. doi: 10.1002/1531-8249(199912)46:6<860::aid-ana8>3.0.co;2-m. [DOI] [PubMed] [Google Scholar]
- 20.Gong Y, Chang L, Viola KL, et al. Alzheimer’s disease-affected brain: presence of oligomeric A beta ligands (ADDLs) suggests a molecular basis for reversible memory loss. Proceedings of the National Academy of Sciences of the United States of America. 2003;100(18):10417–22. doi: 10.1073/pnas.1834302100. [DOI] [PMC free article] [PubMed] [Google Scholar]
- 21.Georganopoulou DG, Chang L, Nam JM, et al. Nanoparticle-based detection in cerebral spinal fluid of a soluble pathogenic biomarker for Alzheimer’s disease. Proceedings of the National Academy of Sciences of the United States of America. 2005 Feb 15;102(7):2273–6. doi: 10.1073/pnas.0409336102. [DOI] [PMC free article] [PubMed] [Google Scholar]
- 22.Englund H, Sehlin D, Johansson AS, et al. Sensitive ELISA detection of amyloid-beta protofibrils in biological samples. Journal of neurochemistry. 2007 Oct;103(1):334–45. doi: 10.1111/j.1471-4159.2007.04759.x. [DOI] [PubMed] [Google Scholar]
- 23.Hillen H, Barghorn S, Striebinger A, et al. Generation and therapeutic efficacy of highly oligomer-specific beta-amyloid antibodies. The Journal of neuroscience: the official journal of the Society for Neuroscience. 2010 Aug 4;30(31):10369–79. doi: 10.1523/JNEUROSCI.5721-09.2010. [DOI] [PMC free article] [PubMed] [Google Scholar]
- 24.Lee EB, Leng LZ, Zhang B, et al. Targeting amyloid-beta peptide (Abeta) oligomers by passive immunization with a conformation-selective monoclonal antibody improves learning and memory in Abeta precursor protein (APP) transgenic mice. The Journal of biological chemistry. 2006 Feb 17;281(7):4292–9. doi: 10.1074/jbc.M511018200. [DOI] [PubMed] [Google Scholar]
- 25.Lambert MP, Velasco PT, Chang L, et al. Monoclonal antibodies that target pathological assemblies of Abeta. Journal of neurochemistry. 2007 Jan;100(1):23–35. doi: 10.1111/j.1471-4159.2006.04157.x. [DOI] [PubMed] [Google Scholar]
- 26.Lambert MP, Viola KL, Chromy BA, et al. Vaccination with soluble Abeta oligomers generates toxicity-neutralizing antibodies. Journal of neurochemistry. 2001 Nov;79(3):595–605. doi: 10.1046/j.1471-4159.2001.00592.x. [DOI] [PubMed] [Google Scholar]
- 27.van Helmond Z, Heesom K, Love S. Characterisation of two antibodies to oligomeric Abeta and their use in ELISAs on human brain tissue homogenates. Journal of neuroscience methods. 2009 Jan 30;176(2):206–12. doi: 10.1016/j.jneumeth.2008.09.002. [DOI] [PubMed] [Google Scholar]
- 28.Howlett D, Cutler P, Heales S, Camilleri P. Hemin and related porphyrins inhibit beta-amyloid aggregation. FEBS letters. 1997 Nov 10;417(2):249–51. doi: 10.1016/s0014-5793(97)01290-8. [DOI] [PubMed] [Google Scholar]
- 29.Sian AK, Frears ER, El-Agnaf OM, et al. Oligomerization of beta-amyloid of the Alzheimer’s and the Dutch-cerebral-haemorrhage types. The Biochemical journal. 2000 Jul 1;349(Pt 1):299–308. doi: 10.1042/0264-6021:3490299. [DOI] [PMC free article] [PubMed] [Google Scholar]
- 30.LeVine H., 3rd Alzheimer’s beta-peptide oligomer formation at physiologic concentrations. Analytical biochemistry. 2004 Dec 1;335(1):81–90. doi: 10.1016/j.ab.2004.08.014. [DOI] [PubMed] [Google Scholar]
- 31.Xia W, Yang T, Shankar G, et al. A specific enzyme-linked immunosorbent assay for measuring beta-amyloid protein oligomers in human plasma and brain tissue of patients with Alzheimer disease. Archives of neurology. 2009 Feb;66(2):190–9. doi: 10.1001/archneurol.2008.565. [DOI] [PMC free article] [PubMed] [Google Scholar]
- 32.Klaver AC, Patrias LM, Finke JM, Loeffler DA. Specificity and sensitivity of the Abeta oligomer ELISA. Journal of neuroscience methods. 2011 Feb 15;195(2):249–54. doi: 10.1016/j.jneumeth.2010.12.001. [DOI] [PubMed] [Google Scholar]
- 33.DeMattos RB, O’Dell MA, Parsadanian M, et al. Clusterin promotes amyloid plaque formation and is critical for neuritic toxicity in a mouse model of Alzheimer’s disease. Proceedings of the National Academy of Sciences of the United States of America. 2002 Aug 6;99(16):10843–8. doi: 10.1073/pnas.162228299. [DOI] [PMC free article] [PubMed] [Google Scholar]
- 34.Todd J, Freese B, Lu A, et al. Ultrasensitive flow-based immunoassays using single-molecule counting. Clinical chemistry. 2007 Nov;53(11):1990–5. doi: 10.1373/clinchem.2007.091181. [DOI] [PubMed] [Google Scholar]
- 35.Schwetye KE, Cirrito JR, Esparza TJ, Mac Donald CL, Holtzman DM, Brody DL. Traumatic brain injury reduces soluble extracellular amyloid-beta in mice: a methodologically novel combined microdialysis-controlled cortical impact study. Neurobiology of disease. 2010 Dec;40(3):555–64. doi: 10.1016/j.nbd.2010.06.018. [DOI] [PMC free article] [PubMed] [Google Scholar]
- 36.Giraldo J, Vivas NM, Vila E, Badia A. Assessing the (a)symmetry of concentration-effect curves: empirical versus mechanistic models. Pharmacology & therapeutics. 2002 Jul;95(1):21–45. doi: 10.1016/s0163-7258(02)00223-1. [DOI] [PubMed] [Google Scholar]
- 37.DeSilva B, Smith W, Weiner R, et al. Recommendations for the bioanalytical method validation of ligand-binding assays to support pharmacokinetic assessments of macromolecules. Pharm Res. 2003 Nov;20(11):1885–900. doi: 10.1023/b:pham.0000003390.51761.3d. [DOI] [PubMed] [Google Scholar]
- 38.Oddo S, Caccamo A, Shepherd JD, et al. Triple-transgenic model of Alzheimer’s disease with plaques and tangles: intracellular Abeta and synaptic dysfunction. Neuron. 2003 Jul 31;39(3):409–21. doi: 10.1016/s0896-6273(03)00434-3. [DOI] [PubMed] [Google Scholar]
- 39.Kim J, Castellano JM, Jiang H, et al. Overexpression of low-density lipoprotein receptor in the brain markedly inhibits amyloid deposition and increases extracellular A beta clearance. Neuron. 2009 Dec 10;64(5):632–44. doi: 10.1016/j.neuron.2009.11.013. [DOI] [PMC free article] [PubMed] [Google Scholar]
- 40.Styren SD, Hamilton RL, Styren GC, Klunk WE. X-34, a fluorescent derivative of Congo red: a novel histochemical stain for Alzheimer’s disease pathology. J Histochem Cytochem. 2000 Sep;48(9):1223–32. doi: 10.1177/002215540004800906. [DOI] [PubMed] [Google Scholar]
- 41.Fagan A, Younkin L, Morris J, et al. Differences in the Aβ40/Aβ42 ratio associated with cerebrospinal fluid lipoproteins as a functionof apolipoprotein E genotype. Ann Neurol. 2000;48:201–10. [PubMed] [Google Scholar]
- 42.Fagan AM, Roe CM, Xiong C, Mintun MA, Morris JC, Holtzman DM. Cerebrospinal fluid tau/beta-amyloid(42) ratio as a prediction of cognitive decline in nondemented older adults. Archives of neurology. 2007 Mar;64(3):343–9. doi: 10.1001/archneur.64.3.noc60123. [DOI] [PubMed] [Google Scholar]
- 43.Tran HT, Sanchez L, Esparza TJ, Brody DL. Distinct Temporal and Anatomical Distributions of Amyloid-beta and Tau Abnormalities following Controlled Cortical Impact in Transgenic Mice. PloS one. 2011 doi: 10.1371/journal.pone.0025475. in press. [DOI] [PMC free article] [PubMed] [Google Scholar]
- 44.Kim K, Wen G, Bancher C, et al. Detection and Quantitation of Amyloid B-peptide with 2 Monoclonal Antibodies. Neuroscience Research Communications. 1990;7(2):113–22. [Google Scholar]
- 45.Ramakrishna N, Saikumar P, Potempska A, Wisniewski HM, Miller DL. Expression of human Alzheimer amyloid precursor protein in insect cells. Biochemical and biophysical research communications. 1991 Jan 31;174(2):983–9. doi: 10.1016/0006-291x(91)91515-e. [DOI] [PubMed] [Google Scholar]
- 46.DeMattos RB, Bales KR, Cummins DJ, Dodart JC, Paul SM, Holtzman DM. Peripheral anti-Abeta antibody alters CNS and plasma Abeta clearance and decreases brain Abeta burden in a mouse model of Alzheimer’s disease. Proceedings of the National Academy of Sciences of the United States of America. 2001;98(15):8850–5. doi: 10.1073/pnas.151261398. [DOI] [PMC free article] [PubMed] [Google Scholar]
- 47.Horikoshi Y, Sakaguchi G, Becker AG, et al. Development of Abeta terminal end-specific antibodies and sensitive ELISA for Abeta variant. Biochemical and biophysical research communications. 2004 Jul 2;319(3):733–7. doi: 10.1016/j.bbrc.2004.05.051. [DOI] [PubMed] [Google Scholar]
- 48.Holton JL, Lashley T, Ghiso J, et al. Familial Danish dementia: a novel form of cerebral amyloidosis associated with deposition of both amyloid-Dan and amyloid-beta. J Neuropathol Exp Neurol. 2002 Mar;61(3):254–67. doi: 10.1093/jnen/61.3.254. [DOI] [PubMed] [Google Scholar]
- 49.Vidal R, Frangione B, Rostagno A, et al. A stop-codon mutation in the BRI gene associated with familial British dementia. Nature. 1999 Jun 24;399(6738):776–81. doi: 10.1038/21637. [DOI] [PubMed] [Google Scholar]
- 50.Saido TC, Iwatsubo T, Mann DM, Shimada H, Ihara Y, Kawashima S. Dominant and differential deposition of distinct beta-amyloid peptide species, A beta N3(pE), in senile plaques. Neuron. 1995 Feb;14(2):457–66. doi: 10.1016/0896-6273(95)90301-1. [DOI] [PubMed] [Google Scholar]
- 51.Price JL, McKeel DW, Jr, Buckles VD, et al. Neuropathology of nondemented aging: presumptive evidence for preclinical Alzheimer disease. Neurobiology of aging. 2009 Jul;30(7):1026–36. doi: 10.1016/j.neurobiolaging.2009.04.002. [DOI] [PMC free article] [PubMed] [Google Scholar]
- 52.Jin M, Shepardson N, Yang T, Chen G, Walsh D, Selkoe DJ. Soluble amyloid {beta}-protein dimers isolated from Alzheimer cortex directly induce Tau hyperphosphorylation and neuritic degeneration. Proc Natl Acad Sci U S A. 2011 Mar 18; doi: 10.1073/pnas.1017033108. [DOI] [PMC free article] [PubMed] [Google Scholar]
- 53.Fukumoto H, Tokuda T, Kasai T, et al. High-molecular-weight beta-amyloid oligomers are elevated in cerebrospinalfluid of Alzheimer patients. The FASEB journal: official publication of the Federation of American Societies for Experimental Biology. 2010 Aug;24(8):2716–26. doi: 10.1096/fj.09-150359. [DOI] [PubMed] [Google Scholar]
- 54.Klyubin I, Betts V, Welzel AT, et al. Amyloid beta protein dimer-containing human CSF disrupts synaptic plasticity: prevention by systemic passive immunization. The Journal of neuroscience: the official journal of the Society for Neuroscience. 2008 Apr 16;28(16):4231–7. doi: 10.1523/JNEUROSCI.5161-07.2008. [DOI] [PMC free article] [PubMed] [Google Scholar]
- 55.Koffie RM, Meyer-Luehmann M, Hashimoto T, et al. Oligomeric amyloid beta associates with postsynaptic densities and correlates with excitatory synapse loss near senile plaques. Proceedings of the National Academy of Sciences of the United States of America. 2009 Mar 10;106(10):4012–7. doi: 10.1073/pnas.0811698106. [DOI] [PMC free article] [PubMed] [Google Scholar]