Abstract
Background
To avoid complications associated with under- or overtreatment of patients with skeletal metastases, doctors need accurate survival estimates. Unfortunately, prognostic models for patients with skeletal metastases of the extremities are lacking, and physician-based estimates are generally inaccurate.
Questions/purposes
We developed three types of prognostic models and compared them using calibration plots, receiver operating characteristic (ROC) curves, and decision curve analysis to determine which one is best suited for clinical use.
Methods
A training set consisted of 189 patients who underwent surgery for skeletal metastases. We created models designed to predict 3- and 12-month survival using three methods: an Artificial Neural Network (ANN), a Bayesian Belief Network (BBN), and logistic regression. We then performed crossvalidation and compared the models in three ways: calibration plots plotting predicted against actual risk; area under the ROC curve (AUC) to discriminate the probability that a patient who died has a higher predicted probability of death compared to a patient who did not die; and decision curve analysis to quantify the clinical consequences of over- or undertreatment.
Results
All models appeared to be well calibrated, with the exception of the BBN, which underestimated 3-month survival at lower probability estimates. The ANN models had the highest discrimination, with an AUC of 0.89 and 0.93, respectively, for the 3- and 12-month models. Decision analysis revealed all models could be used clinically, but the ANN models consistently resulted in the highest net benefit, outperforming the BBN and logistic regression models.
Conclusions
Our observations suggest use of the ANN model to aid decisions about surgery would lead to better patient outcomes than other alternative approaches to decision making.
Level of Evidence
Level II, prognostic study. See Instructions for Authors for a complete description of levels of evidence.
Introduction
Accurate survival estimates are important when treating patients with skeletal metastases [20]. These estimations help to set patient and physician expectations and to guide the medical and surgical decision-making process [10]. Unfortunately, physician-based estimates are generally inaccurate, and better means of prognostication are necessary [5].
Accurate and successful survival models must include information from several sources [4]: demographic and disease-specific variables [1], patient- or physician-derived performance status [17], and laboratory analysis [6]. Physician-based estimates, though controversial, may also be important to consider [12]. With this in mind, we chose three distinct modeling techniques that could be used with a variety of clinical input data. Each was designed to estimate 3- and 12-month survival in patients with surgically treated skeletal metastases. The first was a Bayesian Belief Network (BBN) [3], chosen because it retains its ability to function in the setting of missing input data [15], which is common in the clinical setting. The second was an Artificial Neural Network (ANN), chosen for its powerful discriminatory capability [22]. Finally, the third was a logistic regression model, considered to be the gold standard, as it is commonly used for this purpose.
Traditionally, model comparisons focus solely on accuracy. In this manner, sensitivity and specificity can be rigorously calculated and the area under the receiver operator characteristic (ROC) curve (AUC) calculated [2]. However, these metrics fail to address consequences associated with a falsely positive or negative result. These are typically of unequal importance, particularly in the oncologic setting, in which the consequences of a missed diagnosis generally outweigh the risk of unnecessary testing and/or surgery. As such, the consequences of wrong answers generated by prospective models must also be evaluated to determine not only which model is superior but also whether the models are actually useful in the clinical setting [8].
When treating patients with skeletal metastases of the spine and extremities, we seek to maximize function and quality of life for the greatest amount of time. Falsely optimistic survival estimates may influence patients and clinicians to pursue more aggressive therapies, rather than perhaps more appropriate conservative treatments. This approach results in a higher proportion of both major perioperative complications and death during convalescence [21]. Conversely, falsely pessimistic survival estimates are problematic when surgeons choose a less invasive, less durable implant that lacks sufficient biomechanical durability to outlast the patient. In this setting, implant failures can occur, which require more complicated revision procedures, often at the end of life [16, 20].
We therefore developed three models, an ANN, a BBN, and a logistic regression model, and compared them using a variety of methods. We then asked the following questions: (1) Which model offers the greatest discrimination between patients with different postoperative survival in terms of ROC analysis? And (2) which model performs best on decision curve analysis [18] and is therefore most clinically useful?
Patients and Methods
We retrospectively reviewed our institution-owned patient management database (Disease Management System, v5.2, 1996) and identified all 189 patients who underwent surgery for skeletal metastases at Memorial Sloan-Kettering Cancer Center between 1999 and 2003. No records were excluded. Each record contained 15 variables and sufficient followup information to establish survival at 12 months after surgery (Table 1). Recorded variables included age at surgery, race, sex, primary oncologic diagnosis, indication for surgery (impending or complete pathologic fracture), number of bone metastases (solitary or multiple), presence or absence of visceral metastases, estimated glomerular filtration rate (mL/minute/1.73 m2), serum calcium concentration (mg/dL), serum albumin concentration (g/dL), presence or absence of lymph node metastases, prior chemotherapy (yes or no), preoperative hemoglobin (mg/dL; on admission, before transfusion, if applicable), absolute lymphocyte count (K/mL), and the senior surgeon’s estimate of survival (postoperatively in months). No patients were lost to followup during the study period.
Table 1.
Patient characteristics (n = 189)
| Characteristic | Value |
|---|---|
| Age (years)* | 63 (54, 72) |
| Male | 85 (45%) |
| Cancer diagnosis | |
| Lung, gastric, hepatocellular, or melanoma | 49 (26%) |
| Sarcoma or other carcinoma | 38 (20%) |
| Breast, prostate, renal cell, thyroid, myeloma, or lymphoma | 102 (54%) |
| Bone metastasis | |
| Solitary | 54 (29%) |
| Multiple | 135 (71%) |
| Fracture type | |
| Completely broken | 83 (44%) |
| Impending | 106 (56%) |
| ECOG performance status | |
| ≤ 2 | 91 (48%) |
| ≥ 3 | 98 (52%) |
| Lymph node metastasis | 34 (18%) |
| Visceral metastasis | 113 (60%) |
| Albumin (g/dL)* | 4.0 (3.5, 4.4) |
| Absolute lymphocyte count (K/μL)* | 1.0 (0.6, 1.5) |
| Calcium (g/dL)* | 9.2 (8.7, 9.7) |
| GFR (mL/min/1.73 m2)* | 96 (75, 114) |
| Hemoglobin (g/dL)* | 11.4 (10.1, 12.9) |
| Surgeon estimate of survival (months)* | 8 (4, 12) |
| Survival > 3 months | 131 (69%) |
| Survival > 12 months | 78 (41%) |
Values are expressed as median, with interquartile range in parentheses; the remaining values are expressed as frequency, with percentage in parentheses; ECOG = Eastern Cooperative Oncology Group; GFR = estimated glomerular filtration rate.
Each model was constructed using the same data and trained to estimate postoperative survival at both 3 and 12 months. The 3-month model was intended to help surgeons decide whether or not to operate, and the 12-month model was intended to help surgeons decide whether a more durable implant is necessary. Thus, two models were developed using each technique: a 3-month model and a 12-month model. There were no missing data. Each model was internally validated using the crossvalidation techniques described below.
The BBN was developed in a manner previously described [3] using commercially available machine learning software (FasterAnalytics™; DecisionQ, Washington, DC, USA). Briefly, all 15 variables (features) were considered as candidate features for inclusion in the model. BBNs readily identify relationships of conditional dependence, how and under what circumstances the value assumed by one feature depends on the value(s) of other features. Conditional dependence for a group of features can be represented mathematically by a joint probability distribution function (jPDF). The jPDF allows one to describe the hierarchical relationships between features in a graphical manner and then calculate the probability of one feature (ie, 3-month postoperative survival) assuming a particular value (yes/no), expressed in terms of the values of two or more features. For this study, prior distributions (the value or values each feature is likely to assume under various circumstances) were estimated from the training set and thus were not specified a priori. Unrelated and redundant features were pruned to generate the final models. The BBN models were trained to estimate the likelihood of survival at both 3 and 12 months after surgery, discriminating two possible outcomes (survival at 3 and 12 months: yes or no). Ten-fold crossvalidation was performed to assess the accuracy of the models. Briefly, we first randomized the data into 10 matching train-and-test sets. Each set consisted of a training set composed of 90% of patient records and a test set composed of the remaining 10% of records. Each matching set was unique to ensure there was no overlapping information between sets. A BBN model was trained, using each training set, by applying the same parameters as the final models and then tested on the unknowns contained within the corresponding test set.
We then developed ANN models using the Oncogenomics Online Artificial Neural Network Analysis (OOANNA) system [13], which uses feed-forward multilayer perceptron (MLP) ANNs. We performed principal component analysis on all 15 candidate features to identify the top 10 linearly uncorrelated variables with the largest variance. This was done in an effort to simplify, as well as mitigate overfitting of the model to the training data. Overfitting occurs when a model describes the noise within a set of observations, rather than more general trends, resulting in poor predictive performance on external validation. This MLP network was composed of three layers: an input layer consisting of the 10 principal components identified above, a hidden layer (which may change the relative emphasis placed on data from each of the inputs) with five nodes, and an output layer, which based on information from the hidden layer estimates the most likely outcomes (survival at 3 and 12 months: yes or no). Briefly, data from all 189 study subjects were uploaded into the OOANNA system, which automatically selected the top 10 principal components and input them into the ANN model. Leave-one-out crossvalidation was performed by training the model on n − 1 (188) records and then testing it on one independent test record. In this fashion, the ANN, using the 10 principal components, estimated the likelihood of 3- and 12-month survival for each independent test record.
Finally, for comparison to the two machine learning techniques described above, we developed a conventional logistic regression model using variables observed to be potentially significant on univariate analysis (oncologic diagnosis, presence of visceral metastasis, preoperative serum hemoglobin concentration, Eastern Cooperative Oncology Group performance status, and the surgeon’s estimate of postoperative survival). We used STATA® 11.0 statistical software (StataCorp LP, College Station, TX, USA). Ten-fold crossvalidation was performed.
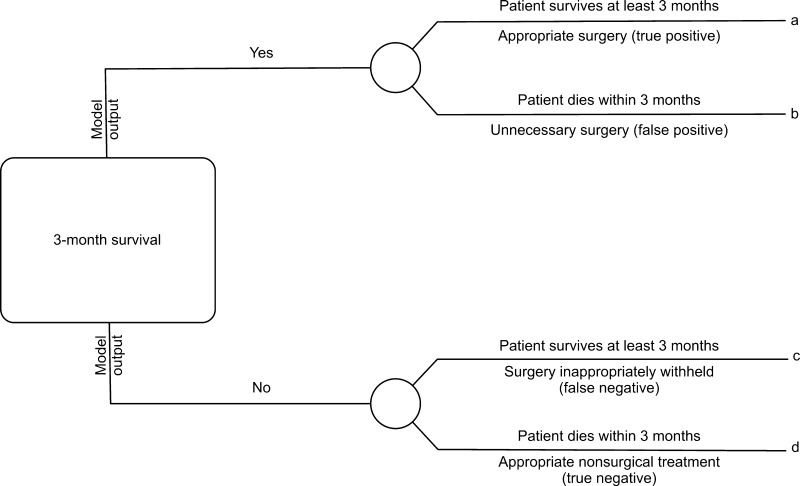
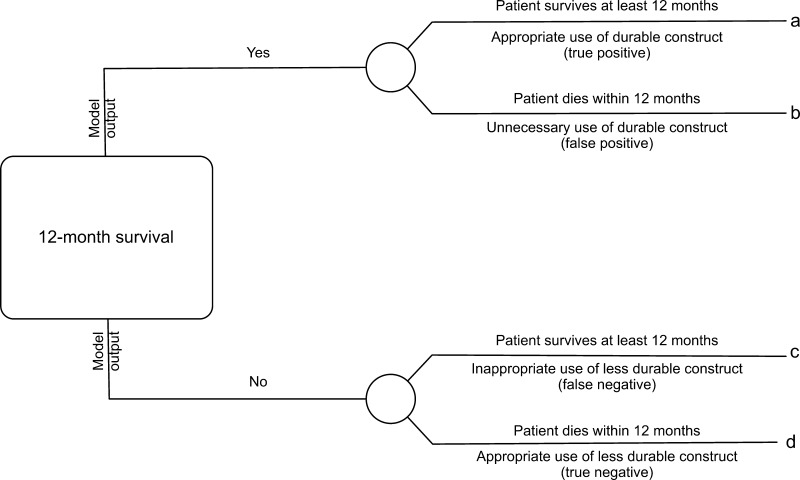
Models were directly compared using a variety of methods. First, calibrations were created that plotted predicted risk against actual risk to assess the accuracy of the model predictions. Second, the discrimination, or AUC, of each model was assessed. The discrimination of a model is the probability that a patient who died has a higher predicted probability of death compared to a patient who did not die [2]. Third, decision curve analysis [16] was performed in the following manner. In contrast to decision tree analysis, which weighs the possible consequences of several decisions, decision curve analysis helps quantify the consequences of over- or undertreatment of a disease process. When constructing the decision curves, we assumed clinical decisions would be based strictly on the output of each model. For instance, the decision to offer surgery would be based on the likelihood of survival at 3 months, whereas the choice of implant (more durable or less durable) would be based on the likelihood of survival at 12 months. Each model generates a survival probability p at specific time points after surgery. If the probability is near 1, surgeons may choose to recommend surgery in the case of the 3-month model and a more durable implant in the case of the 12-month model. If the probability is near 0, nonsurgical treatment may be recommended in the case of the 3-month model or a less invasive/less durable implant in the case of the 12-month model. At some probability between 1 and 0, however, surgeons may have difficulty choosing a treatment method. For this study, we defined the point at which surgeons become indecisive as the threshold probability pt, in which the expected benefit of treatment is equal to the expected benefit of no treatment. The treatment decision trees are depicted for 3-month survival (Fig. 1) and 12- month survival (Fig. 2), in which a, b, c, and d represent values associated with each possible outcome. For instance, for the 3-month models, a − c is defined as the consequence of a false-negative result, withholding surgery in someone who actually survives long enough to benefit (ie, > 3 months, in this case). Similarly, d − b is defined as the consequence of a false-positive result, performing surgery in someone who does not live long enough to benefit (ie, < 3 months). For the 12-month models, the definitions remain the same; however, the clinical impact changes. For 12-month survival, a − c remains the consequence of a false-negative result, but in this case, a less durable implant is inappropriately chosen in a patient who outlives his/her implant and subsequently requires a revision procedure. Similarly, d − b remains the consequence of a false-positive result; however, this time it results in unnecessarily aggressive surgery in a patient who does not live long enough to benefit.
Fig. 1.
This decision tree represents the four possible scenarios stemming from the use of the 3-month models. Each outcome, a, b, c, or d, corresponds to a theoretical clinical scenario. For instance, true positives are those in which appropriate surgical treatment is rendered, false positives are those in which unnecessary surgery is performed, false negatives are those in which surgery was inappropriately withheld, and true negatives are those in which appropriate nonsurgical or less invasive treatment is rendered.
Fig. 2.
This decision tree represents the four possible scenarios stemming from the use of the 12-month models. Each outcome, a, b, c, or d, corresponds to a theoretical clinical scenario. For instance, true positives are those that result in the appropriate use of durable implants, false positives are those in which more durable implant are used unnecessarily (when less durable implants would have sufficed), false negatives are those in which less durable implants were used when more durable implants were required, and true negatives are those in which appropriate less durable implants were used.
From the decision trees, we derive the following formula as previously described [18]:
 |
Simply stated, the threshold probability of survival pt in which a surgeon decides (1) whether to offer surgery and/or (2) a more durable implant is necessary is related to how he/she weighs the consequences of overtreating or undertreating the patient. By letting the value of a true-positive result be 1, we arrive at the following formula [14]:
 |
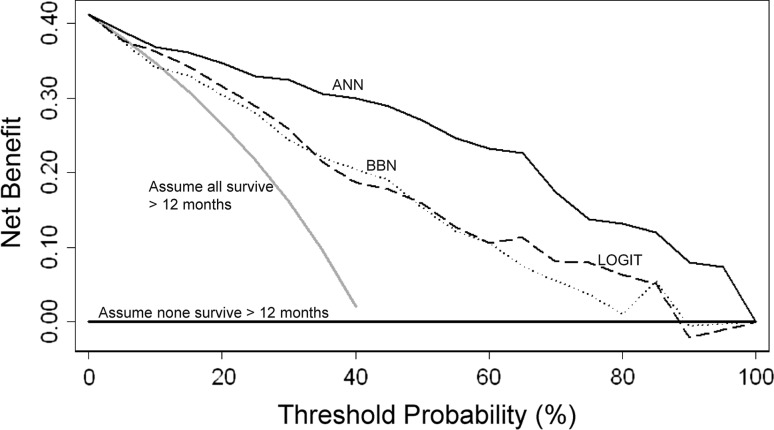
In this fashion, each model’s net benefit, defined as one patient duly receiving an implant commensurate with his/her estimated survival, was plotted against a range of threshold probabilities from 0 to 1.
Results
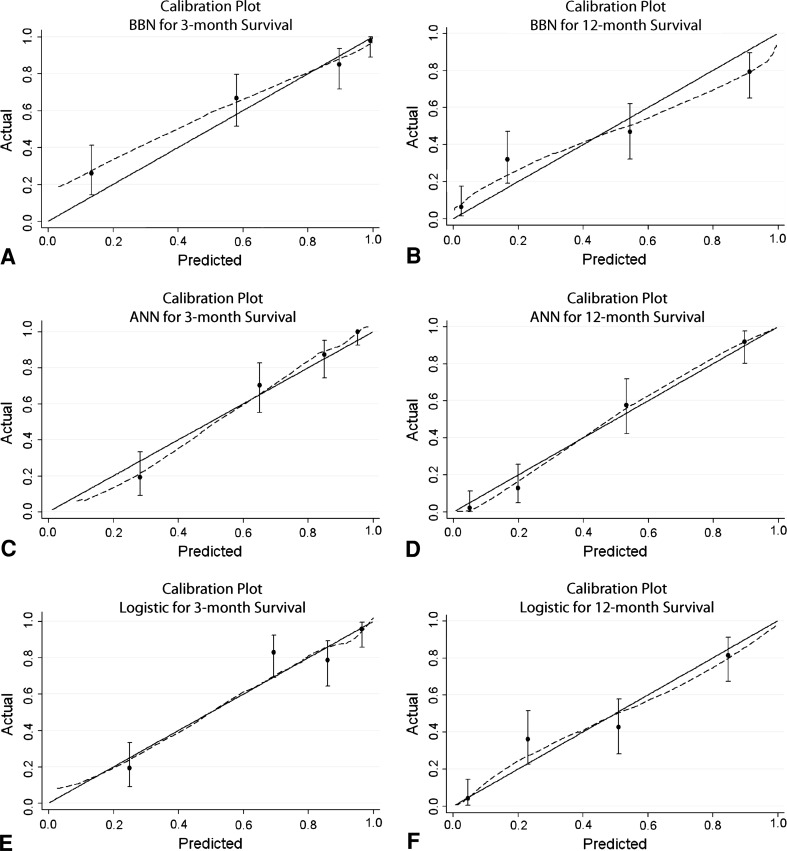
By inspection of the calibration plots (Fig. 3), the ANN and logistic regression models appeared well calibrated. By comparison, the BBN models appeared miscalibrated, underestimating actual 3- and 12-month survival over the lower range of probability estimates and slightly overestimating 12-month survival over the higher ranges.
Fig. 3A−F.
Calibration plots are shown for the (A) 3- and (B) 12-month BBN models, (C) 3- and (D) 12-month ANN models, and (E) 3- and (F) 12-month logistic regression models. Calibration plots illustrate the agreement between observed outcomes and predictions. Perfect calibration to the training data should overlie the 45° solid line. Note the 3-month BBN model appears miscalibrated at low probability estimates by underestimating actual survival.
The ANN models were the most accurate, with AUCs of 0.89 (95% CI, 0.84–0.94) and 0.93 (95% CI, 0.89–0.96), respectively, for the 3- and 12-month models. The BBN and logistic regression models performed similarly, with AUCs of 0.85 (95% CI, 0.79–0.91) and 0.83 (95% CI, 0.77–0.89) and 0.84 (95% CI, 0.77–0.90) and 0.83 (95% CI, 0.78–0.89), respectively.
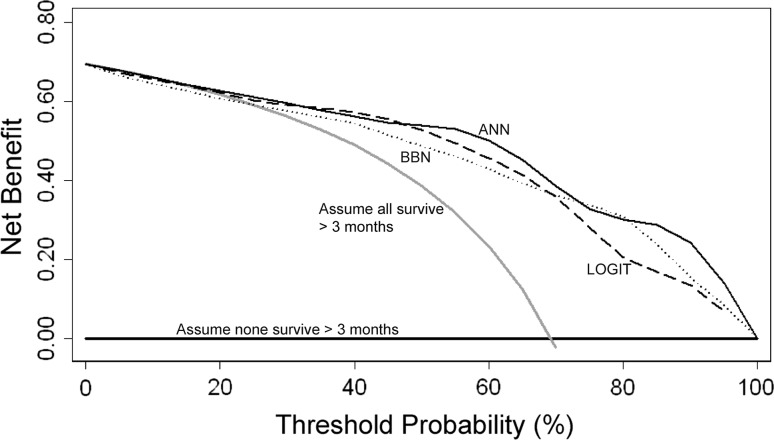
All three modeling techniques produced validation data suitable for ROC analysis and decision curve analysis. After decision curve analysis, all models demonstrated a net benefit, indicating each could be used clinically, rather than assume all patients or no patients will survive longer than 3 or 12 months, respectively. All three 3-month models performed similarly; however, there were subtle differences among them (Fig. 4). Any differences noted by this method are thought to be clinically important. Regarding the 12-month models (Fig. 5), the ANN produced the highest net benefit across all threshold probabilities. The BBN and logistic regression models performed similarly. At both 3- and 12-month time points, the ANN performed best at or near the threshold probability of 0.5, corresponding to a 50% probability of survival at each time point.
Fig. 4.
Comparing the 3-month models using decision curve analysis, net benefit is plotted versus threshold probability of 3-month survival. All models (ANN, BBN, logistic regression [LOGIT]) performed similarly and could be used clinically rather than assume all patients (or no patients) will survive longer than 3 months after surgery.
Fig. 5.
Comparing the 12-month models using decision curve analysis, net benefit is plotted versus threshold probability of 12-month survival. All models (ANN, BBN, logistic regression [LOGIT]) resulted in positive net benefit, indicating they could be used clinically rather than assume all patients (or no patients) will survive longer than 12 months after surgery. Note the ANN outperformed the other models across all threshold probabilities, including the clinically useful threshold probability of 50% estimated survival at 12 months.
Discussion
There is, perhaps, no better application of personalized medicine than for the treatment of patients with cancer. One aspect of this would be developing personalized estimates of survival for patients with skeletal metastases, as we have done. Our goal is to provide orthopaedic surgeons with a web-based tool, designed to help them decide not only whether to offer surgery but also whether a more durable implant is appropriate. In doing so, it is important to carefully avoid over- or undertreatment of the disease and thus maximize function and quality of life for the greatest amount of time. With this in mind, patients with short life expectancies may require less invasive surgery, including intramedullary nailing or other fixation techniques [19, 23]. In contrast, patients with longer survival estimates are generally thought to require more durable reconstructive options that increase both the perioperative risk and the duration of rehabilitation [10, 16, 20]. Though more accurate models are generally more useful than less accurate models, it is possible either can lead to inferior outcomes. Thus, one’s focus should not solely be on accuracy. Decision curve analysis not only elucidates whether models are worth using clinically but also provides metrics to directly compare individual models. Our goal was to critically evaluate three prognostic models, all developed using the same clinical data, and answer the following questions: (1) Which model performs best on decision curve analysis [18]? And (2) which model most accurately estimates postoperative survival in terms of sensitivity, specificity, and ROC analysis?
This study has limitations. First, the patient population is from a highly selected tertiary referral center and may not be representative of other populations. This may be problematic when employing machine learning techniques such as ANNs and BBNs to build prognostic models. Overfitting can occur, which would cause the results of the decision curve analysis to be overly optimistic. As such, despite demonstrating positive net benefit, these models must still undergo external validation to demonstrate their applicability in other patient populations, and prospective external validation is currently underway. Second, these models apply only to patients undergoing surgery for skeletal metastases and do not apply to all patients with metastatic disease. Third, the ANN and logistic regression models require complete input information, which can limit their usefulness and result in misleading conclusions when complete information is not available. Nevertheless, the demographic and clinicopathologic variables used in these models will likely be readily available, particularly in the perioperative setting. Fourth, the BBN models appeared miscalibrated, underestimating actual 3- and 12-month survival over the lower range of probability estimates and slightly overestimating 12-month survival over the higher ranges. This is a subjective determination. Though methods exist to quantify the degree of calibration along a continuum, there is no consensus regarding what is, and is not, calibrated.
Our findings suggest each modeling technique produced potentially clinically useful models on decision curve analysis and can be used clinically rather than assume all patients will survive longer than 3 months or no patients will survive longer than 12 months. At the 3-month time point, each technique performed similarly, all resulting in net benefit higher than the alternatives of treating all or no patients (Fig. 4). Depending on the threshold probability (the probability of survival at which the surgeon would recommend treatment), each modeling technique appeared best at some point along the continuum. However, the ANN produced the greatest net benefit over the higher threshold probabilities. Therefore, the ANN may be consistently the most useful model when applied to the clinical setting.
At the 12-month time point, the ANN consistently outperformed the BBN and logistic regression models over all threshold probabilities. At the extreme (pt > 0.9), surgeons may be better off assuming no patient will survive longer than 12 months than using the BBN or logistic regression models. This is not likely to be a common clinical scenario: it is doubtful any surgeon would demand a 90% probability of survival before considering a more durable implant. In fact, the cutoff chosen for ROC analysis for the 12-month models was 0.4, which represents, in our opinion (JAF, JHH), a clinically relevant threshold for surgeons who treat this specific patient population. Nevertheless, decision curve analysis evaluates and compares models over a range of threshold probabilities, so an exact value of pt need not be specified a priori.
Using our institutionally derived data set, the ANN model was superior to the other two models both in accuracy and on decision curve analysis. Nevertheless, BBN techniques retain a unique advantage over ANNs. As clinicians, we often base clinical decisions on incomplete or otherwise inadequate information. BBNs can effectively account for this type of uncertainty or missing information within the input data [15], which may make them ideally suited for use in the clinical setting. While ANNs can be developed to accommodate missing data [11], Bayesian methods are typically better suited for this purpose [9]. With respect to the clinical utility of logistic regression models, one must consider they do not typically account for conditionally dependent relationships between variables [7]; this weakness may degrade accuracy in the setting of missing input data. If clinical decisions are to be made using incomplete information, the BBN method, described above, can still be used.
These data support the use of each of these models in patients with surgically treated skeletal metastases. Though prognostic models are common in orthopaedics, we are aware of no other reports documenting the use of decision curve analysis in the orthopaedic literature. Nevertheless, we believe prognostic models should be evaluated on the basis of clinical value (by decision curve analysis) before clinical use. It would also be helpful to understand more about the relevant threshold probabilities in surgeons who treat this specific patient population. This highlights the need for prospective studies evaluating surgeon preference. We believe models such as these should continue to be developed and, when vetted properly, will ultimately provide orthopaedic surgeons with useful clinical decision support tools to estimate each patient’s likelihood of survival and, as such, help guide surgical management and implant selection.
Acknowledgments
We thank Javed Khan, PhD, from the Oncogenomics Section, Pediatric Oncology Branch, National Cancer Institute, for access and insight into the architecture and application of the ANN and Jesse Galle, BS, for helpful data assembly.
Footnotes
Each author certifies that he or she, or a member of his or her immediate family, has no commercial associations (eg, consultancies, stock ownership, equity interest, patent/licensing arrangements, etc) that might pose a conflict of interest in connection with the submitted article.
All ICMJE Conflict of Interest Forms for authors and Clinical Orthopaedics and Related Research editors and board members are on file with the publication and can be viewed on request.
Each author certifies that his or her institution approved or waived approval for the reporting of this investigation and that all investigations were conducted in conformity with ethical principles of research.
This work was performed at Memorial Sloan-Kettering Cancer Center, New York, NY, USA.
References
- 1.Bauer HC, Wedin R. Survival after surgery for spinal and extremity metastases: prognostication in 241 patients. Acta Orthop Scand. 1995;66:143–146. doi: 10.3109/17453679508995508. [DOI] [PubMed] [Google Scholar]
- 2.Cook NR. Use and misuse of the receiver operating characteristic curve in risk prediction. Circulation. 2007;115:928–935. doi: 10.1161/CIRCULATIONAHA.106.672402. [DOI] [PubMed] [Google Scholar]
- 3.Forsberg JA, Eberhardt J, Boland PJ, Wedin R, Healey JH. Estimating survival in patients with operable skeletal metastases: an application of a bayesian belief network. PLoS ONE. 2011;6:e19956. doi: 10.1371/journal.pone.0019956. [DOI] [PMC free article] [PubMed] [Google Scholar]
- 4.Glare P. Clinical predictors of survival in advanced cancer. J Support Oncol. 2005;3:331–339. [PubMed] [Google Scholar]
- 5.Glare P, Virik K, Jones M, Hudson M, Eychmuller S, Simes J, Christakis N. A systematic review of physicians’ survival predictions in terminally ill cancer patients. BMJ. 2003;327:195–198. doi: 10.1136/bmj.327.7408.195. [DOI] [PMC free article] [PubMed] [Google Scholar]
- 6.Hansen BH, Keller J, Laitinen M, Berg P, Skjeldal S, Trovik C, Nilsson J, Walloe A, Kalen A, Wedin R. The Scandinavian Sarcoma Group Skeletal Metastasis Register: survival after surgery for bone metastases in the pelvis and extremities. Acta Orthop Scand Suppl. 2004;75:11–15. doi: 10.1080/00016470410001708270. [DOI] [PubMed] [Google Scholar]
- 7.Harrell FE, Lee KL, Mark DB. Multivariable prognostic models: issues in developing models, evaluating assumptions and adequacy, and measuring and reducing errors. Stat Med. 1996;15:361–387. doi: 10.1002/(SICI)1097-0258(19960229)15:4<361::AID-SIM168>3.0.CO;2-4. [DOI] [PubMed] [Google Scholar]
- 8.Hunink MGM, Glasziou PP, Siegel JE, Weeks JC, Pliskin JS, Elstein AS, Weinstein MC. Decision Making in Health and Medicine: Integrating Evidence and Values. Cambridge, UK: Cambridge University Press; 2001. [Google Scholar]
- 9.Jayasurya K, Fung G, Yu S, Dehing-Oberije C, De Ruysscher D, Hope A, De Neve W, Lievens Y, Lambin P, Dekker AL. Comparison of Bayesian network and support vector machine models for two-year survival prediction in lung cancer patients treated with radiotherapy. Med Phys. 2010;37:1401–1407. doi: 10.1118/1.3352709. [DOI] [PubMed] [Google Scholar]
- 10.Manoso MW, Healey JH. Metastatic cancer to the bone. In: DeVita, Hellman, and Rosenberg’s Cancer: Principles & Practice of Oncology. Philadelphia, PA: Lippincott Williams & Wilkins; 2008.
- 11.Markey MK, Tourassi GD, Margolis M, DeLong DM. Impact of missing data in evaluating artificial neural networks trained on complete data. Comput Biol Med. 2006;36:516–525. doi: 10.1016/j.compbiomed.2005.02.001. [DOI] [PubMed] [Google Scholar]
- 12.Nathan SS, Healey JH, Mellano D, Hoang B, Lewis I, Morris CD, Athanasian EA, Boland PJ. Survival in patients operated on for pathologic fracture: implications for end-of-life orthopedic care. J Clin Oncol. 2005;23:6072–6082. doi: 10.1200/JCO.2005.08.104. [DOI] [PubMed] [Google Scholar]
- 13.Oncogenomics Section, Pediatric Oncology Branch, Center for Cancer Research, National Cancer Institute. Online artificial neural network analysis tool. Available at: http://home.ccr.cancer.gov/oncology/oncogenomics/tool.htm. Accessed December 20, 2011.
- 14.Peirce CS. The numerical measure of the success of predictions. Science. 1884;4:453–454. doi: 10.1126/science.ns-4.93.453-a. [DOI] [PubMed] [Google Scholar]
- 15.Rubin DB, Schenker N. Multiple imputation in health-care databases: an overview and some applications. Stat Med. 1991;10:585–598. doi: 10.1002/sim.4780100410. [DOI] [PubMed] [Google Scholar]
- 16.Steensma M, Boland PJ, Morris CD, Athanasian E, Healey JH. Endoprosthetic treatment is more durable for pathologic proximal femur fractures. Clin Orthop Relat Res. 2012;470:920–926. doi: 10.1007/s11999-011-2047-z. [DOI] [PMC free article] [PubMed] [Google Scholar]
- 17.Tokuhashi Y, Matsuzaki H, Oda H, Oshima M, Ryu J. A revised scoring system for preoperative evaluation of metastatic spine tumor prognosis. Spine (Phila Pa 1976). 2005;30:2186–2191. [DOI] [PubMed]
- 18.Vickers AJ, Elkin EB. Decision curve analysis: a novel method for evaluating prediction models. Med Decis Making. 2006;26:565–574. doi: 10.1177/0272989X06295361. [DOI] [PMC free article] [PubMed] [Google Scholar]
- 19.Ward WG, Holsenbeck S, Dorey FJ, Spang J, Howe D. Metastatic disease of the femur: surgical treatment. Clin Orthop Relat Res. 2003;415(suppl):S230–S244. doi: 10.1097/01.blo.0000093849.72468.82. [DOI] [PubMed] [Google Scholar]
- 20.Wedin R, Bauer HC, Wersäll P. Failures after operation for skeletal metastatic lesions of long bones. Clin Orthop Relat Res. 1999;358:128–139. doi: 10.1097/00003086-199901000-00016. [DOI] [PubMed] [Google Scholar]
- 21.Weeks JC, Cook EF, O’Day SJ, Peterson LM, Wenger N, Reding D, Harrell FE, Kussin P, Dawson NV, Connors AF, Lynn J, Phillips RS. Relationship between cancer patients’ predictions of prognosis and their treatment preferences. JAMA. 1998;279:1709–1714. doi: 10.1001/jama.279.21.1709. [DOI] [PubMed] [Google Scholar]
- 22.Wei JS, Badgett TC, Khan J. New technologies for diagnosing pediatric tumors expert opinion on medical diagnostics. Expert Opin Med Diagn. 2008;2:1205–1219. doi: 10.1517/17530059.2.11.1205. [DOI] [PMC free article] [PubMed] [Google Scholar]
- 23.Weiss KR, Bhumbra R, Biau DJ, Griffin AM, Deheshi B, Wunder JS, Ferguson PC. Fixation of pathological humeral fractures by the cemented plate technique. J Bone Joint Surg Br. 2011;93:1093–1097. doi: 10.1302/0301-620X.93B8.26194. [DOI] [PubMed] [Google Scholar]


