

Abstract
Recent theory in causal inference has provided concepts for mediation analysis and effect decomposition that allow one to decompose a total effect into a direct and an indirect effect. Here, it is shown that what is often taken as an indirect effect can in fact be further decomposed into a “pure” indirect effect and a mediated interactive effect, thus yielding a three-way decomposition of a total effect (direct, indirect, and interactive). This three-way decomposition applies to difference scales and also to additive ratio scales and additive hazard scales. Assumptions needed for the identification of each of these three effects are discussed and simple formulae are given for each when regression models allowing for interaction are used. The three-way decomposition is illustrated by examples from genetic and perinatal epidemiology, and discussion is given to what is gained over the traditional two-way decomposition into simply a direct and an indirect effect.
There has been considerable interest in methodology for mediation analysis and effect decomposition of a total effect into direct and indirect effects. The recent causal inference literature has allowed for such effect decomposition even in the presence of interactions and in nonlinear models.1–13 The counterfactual quantities used to define these direct and indirect effects accommodated interaction, even at the individual level.1,2 However, the presence of such interaction has led to more than one way to decompose the total effect into a direct effect and indirect effect, depending precisely on how the interaction was accounted for.1,14 This article shows that a further decomposition is possible: one can decompose a total effect into a direct effect, an indirect effect, and an interactive effect. This further decomposition makes clearer the role of interaction when questions of mediation and pathways are of interest.
The article is structured as follows. We first review definitions for natural direct and indirect effects and discuss issues concerning interaction in these decompositions. We then consider a difference scale and give a new three-way decomposition at the individual counterfactual level of a total effect into direct effect, indirect effect, and interactive components. The identification of these effects follows standard arguments; the three-way decomposition itself is novel. Following this, we show how a similar decomposition can be achieved for ratio scales. We then illustrate how this three-way decomposition can be carried out using simple regression models. In the following section, we revisit two examples of mediation analysis in which direct and indirect effects were estimated and carry out the three-way effect decomposition in these settings. We close with discussion of the implications of the results in this article for our understanding of pathways and mediation.
NATURAL DIRECT AND INDIRECT EFFECTS
Let A denote the exposure of interest, Y the outcome, M a potential mediator, and C a set of baseline covariates. We let Ya and Ma denote, respectively, the values of the outcome and mediator that would have been observed had the exposure A been set to level a; let Yam denote the value of the outcome that would have been observed had A been set to level a, and M to m. Suppose we compare two levels of the exposure, a and a*; for binary exposure, we would have a = 1 and a* = 0. The controlled direct effect, comparing exposure level A = a to A = a* and fixing the mediator to level m, is defined by Yam − Ya*m and captures the effect of exposure A on outcome Y, intervening to fix M to m; it may be different for different levels of m.1,2 It may also be different for across persons. The natural direct effect1,2 is defined as YaMa*−Ya*Ma* and differs from controlled direct effects, in that the intermediate M is set to the level Ma*, the level that it would have naturally been under some reference condition for the exposure, A = a*. Similarly, the natural indirect effect can be defined as YaMa−YaMa*, which compares the effect of the mediator at levels Ma and Ma* on the outcome when exposure is set to A = a. For the natural indirect effect to be nonzero, the exposure would have to change the mediator and that change in the mediator would have to change the outcome; natural indirect effects thus capture formally our notion of mediation. Defined thus, for a binary exposure, these three effects would be: Y1m − Y0M for the controlled direct effect, Y1M0−Y0M0 for the natural direct effect, and Y1M1−Y1M0 and for the natural indirect effect. Natural direct and indirect effects have the property that a total effect, Y1 − Y0, decomposes into a natural direct and indirect effect: Y1−Y0=Y1M1−Y0M0=(Y1M1−Y1M0)+(Y1M0−Y0M0); the decomposition holds even when there are interactions and nonlinearities.
Because the direct and indirect effects above are counterfactual quantities, we in general will not be able to compute these for any person in the population, but under certain assumptions, we might hope to be able to estimate them on average. The expected values of three effects, conditional on the covariates C = c, are defined by: E[Y1m−Y0m|c], E[Y1M0−Y0M0|c], and E[Y1M1−Y1M0|c], respectively. Under certain no-confounding assumptions, the average controlled direct effect, natural direct effect, and natural indirect effect, conditional on the covariates, are identified by the data. For causal diagrams interpreted as nonparametric structural equation models,15 the following four assumptions suffice to identify natural direct and indirect effects from data2: (i) the effect the exposure A on the outcome Y is unconfounded conditional on C; (ii) the effect the mediator M on the outcome Y is unconfounded conditional on C; (iii) the effect the exposure A on the mediator M is unconfounded conditional on C; and (iv) there is no effect of the exposure that itself confounds the mediator-outcome relationship. If we let X∐Y|Z denote that X is independent of Y conditional on Z, then these four assumptions stated formally in terms of counterfactual independence are the following: (i) YamA∐C, (ii) YamM∐{A,C}, (iii) Ma∐A|C, and (iv) Yam∐Ma*|C. Average controlled direct effects conditional on C are identified by assumptions (i) and (ii) alone; natural direct and indirect effects are identified by assumptions (i)–(iv). Some additional technical conditions referred to as consistency and composition are also needed to relate the observed data to counterfactual quantities. The consistency assumption in this context is that when A = a, the counterfactual outcomes Ya and Ma are equal to the observed outcomes Y and M, respectively, and that when A = a and M = m, the counterfactual outcome Yam is equal to Y. The composition assumption is that Ya=YaMa. Further discussion of these assumptions is given elsewhere.4,16 Note that assumption (iv) requires that there is no effect of the exposure that itself confounds the mediator-outcome relationship. This assumption would hold in Figure 1 but would be violated in Figure 2.
FIGURE 1.
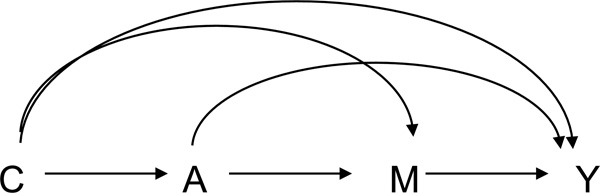
Mediation with exposure A, outcome Y, mediator M, and confounders C.
FIGURE 2.

Mediation with a mediator-outcome confounder L that is affected by the exposure.
Avin et al17 have shown that natural direct and indirect effects are not identified from data in Figure 2 or whenever there is a variable (such as L) that is affected by exposure that in turn confounds the mediator-outcome relationship, irrespective of whether data are available on this exposure-induced confounder.
The natural direct and indirect effects defined above are referred to by Robins and Greenland1 as “pure direct effects” and “total indirect effects,” respectively. Robins and Greenland use the terminology “pure” and “total” because there are different ways of decomposing an overall effect into direct and indirect effects component. Above, we decomposed the overall or total effect as follows: Y1−Y0=Y1M1−Y0M0=(Y1M1−Y1M0)+(Y1M0−Y0M0). For the natural direct effect, Y1M0−Y0M0, we compared average outcomes under exposure versus no exposure, in both cases setting the mediator to what it would have been in the absence of exposure. We might instead compare exposure to no exposure, now in both cases setting the mediator to what it would have been in the presence of exposure. This would be the counterfactual contrast Y1M1−Y0M1. Likewise in the decomposition above, for the natural indirect effect, Y1M1−Y1M0, we compared average outcome when exposure is set to present and the mediator is set to the level it would have been with versus without exposure. We might instead compare average outcome when exposure is set to absent and the mediator is set to the level it would have been with versus without exposure. This would be the counterfactual contrast Y0M1−Y0M0. Robins and Greenland refer to Y1M1−Y0M1 as the “total direct effect” and Y1M1−Y1M0 as the “pure indirect effect,” in contrast to the pure direct effect and total indirect effect considered above. We also then have an alternative effect decomposition of an overall effect: Y1−Y0=(Y1M1−Y0M1)+(Y0M1−Y0M0). We can thus decompose an overall, Y1 − Y0, either into a total indirect effect and a pure direct effect, (Y1M1−Y1M0)+(Y1M0−Y0M0), or into a total direct effect and a pure indirect effect, (Y1M1−Y0M1)+(Y0M1−Y0M0). See also the Table for the definition of these effects.
Table.
Counterfactual Definitions of Direct and Indirect Effects
| Effect | Counterfactual definition |
|---|---|
| Total indirect effect | (Y1M1−Y1M0) |
| Pure direct effect | (Y1M0−Y0M0) |
| Pure indirect effect | (Y0M1−Y0M0) |
| Total direct effect | (Y1M1−Y0M1 |
| Mediated interaction | (Y11−Y10−Y01 + Y00) (M1−M0) |
The pure and total terminology used by Robins and Greenland1 essentially arises from different ways of accounting for an interaction. When we decompose an overall or total effect into a pure direct effect and a total indirect effect, the indirect effect “picks up” the interaction; the pure in pure direct effect effectively indicates that the direct effect does not pick up the interaction. When we decompose an overall effect into a total direct effect and a pure indirect effect, the direct effect picks up the interaction; the pure in pure indirect effect effectively indicates that the indirect effect does not pick up the interaction (see Hafeman18 for illustration of this point in the sufficient-cause framework). We thus have two different decompositions depending on how we account for the interaction. Traditionally, the decomposition has been into the pure direct effect and the total indirect effect. This was arguably, in part, because of historical reasons as this decomposition was the one initially suggested by Pearl; however, under certain “monotonicity” assumptions, the total indirect effect, in contrast to the pure indirect effect, would also give more evidence for the actual operation, rather than just the presence, of mediating mechanisms.19,20 In some cases, one decomposition may be preferred to another on substantive grounds, as they constitute different effects and different decompositions are answering different questions.21 In other cases, deciding between the two may be less clear. The two decompositions remain, and there is some level of arbitrariness or ambiguity in choosing between them. Again, this ambiguity of the choice between the two essentially arises from different ways of accounting for interaction. In the next section, we show that this ambiguity can be eliminated by a three-way decomposition of a total effect into three components: (i) a pure direct effect, (ii) pure indirect effect, and (iii) an interactive effect.
A THREE-WAY DECOMPOSITION OF A TOTAL EFFECT INTO DIRECT, INDIRECT, AND INTERACTIVE EFFECTS
For simplicity, we will consider the setting of a binary exposure and binary mediator. A more general decomposition for categorical or continuous exposure and mediator is given in the Appendix. For binary exposure A, binary mediator M, and outcome Y, we show in the Appendix that we have the following decomposition:
| (1) |
The first term in this decomposition is the pure direct effect considered in the previous section. The second term in this decomposition is the pure indirect effect considered in the previous section. The third term in this decomposition, (Y11 − Y10 − Y01 + Y00) (M1 − M0), is the product of an additive interaction between the exposure and the mediator on the outcome, (Y11 − Y10 − Y01 + Y00), and the effect of the exposure on the mediator, (M1 − M0). This interactive effect will be nonzero if and only if it is both the case that the exposure has some effect on the mediator, (M1 − M0) ≠ 0, and if the additive interaction contrast, (Y11 − Y10 − Y01 + Y00), is nonzero. We might thus refer to this interactive effect as a “mediated interactive effect.” The contrast (Y11 − Y10 − Y01 + Y00) is a counterfactual measure of additive interaction. It is considered in more detail elsewhere.22–25 It can be rewritten as (Y11 − Y00) − {(Y10 + Y00) + (Y01 − Y00)}. It will be nonzero for a person if the effect on the outcome of setting both the exposure and the mediator to present differs from the sum of the effects of having only one of the exposure or the mediator present. In the Appendix, it is shown that this mediated interactive effect is equal to the difference between the total indirect effect and the pure indirect effect, (Y1M1−Y1M0)−(Y0M1−Y0M0); the mediated interactive effect is also equal to the difference between the total direct effect and the pure direct effect. The three-way decomposition above and the mediated interactive effect essentially resolve the ambiguity above concerning the choice between decomposition into a pure direct and total indirect effect, or a total direct and pure indirect effect. The ambiguity was created by different ways of accounting for interaction. Instead of specifically assigning such interaction to either the direct effect or the indirect effect, we can simply account for it separately.
The decomposition above in equation (1) applies at the individual counterfactual level. We have considered average direct and indirect effects conditional on the covariates above. The average interactive mediation effect conditional on covariates C = c could likewise be defined as: E[(Y11 − Y10 − Y01 + Y00)(M1 − M0)|c]. Under the assumptions (i)–(iv) above (specifically, Yam∐Ma*𝖺|C), we can give a somewhat similar decomposition for the average effect conditional on C
| (2) |
The first expression in the decomposition is the average pure direct effect conditional on the covariates C. The second term in this decomposition is the average pure indirect effect considered conditional on the covariates C. The third term in the decomposition is the product of the average causal interaction conditional on covariates C, E[Y11 − Y10 − Y01 + Y00|c], and the average effect of the exposure on the mediator conditional on covariates C, E[M1 − M0|c]. As shown in the Appendix, what assumption (iv) essentially gives us here is that the average “mediated interactive effect” is simply equal to the product of the average additive interaction and the average effect of the exposure on the mediator, that is, E[(Y11 − Y10 − Y01 + Y00)(M1 − M0)|c] = E[(Y11 − Y10 − Y01 + Y00)|c]E[M1 − M0)|c].
In the Appendix, it is also shown that under assumptions (i)–(iv) the average pure direct effect, pure indirect effect, and mediated interactive effect, conditional on covariates C = c are identified from data by the following empirical expressions:
The identification of these effects follows standard arguments already in the literature2; it is the three-way decomposition itself that is novel. In a subsequent section, we will illustrate the estimation of these three effects using regression models.
It was noted above that when using a two-way decomposition of a total effect into a direct and an indirect effect, there was ambiguity in how this was done and in the manner in which interaction was accounted for. The total effect could be decomposed into the sum of a total indirect effect and a pure direct effect or into a pure indirect effect and a total direct effect. The three-way decomposition arguably lends support to the approach of using the total indirect effect and the pure direct effect. This is because the total indirect effect is itself composed of the pure indirect effect and a mediated interaction. If the indirect effect that we use in a two-way decomposition of a total effect into direct and indirect effects is to capture the entirety of the effect that is in some sense mediated, then it arguably ought to include the mediated interaction as well. Fortunately, it is the decomposition of a total effect into a total indirect effect and a pure direct effect that has most often been used in practice and in software and, as noted above, there are other theoretical arguments for sometimes preferring this particular decomposition.19,20 However, again, with the three-way decomposition, one need not decide between alternative two-way decompositions and alternative approaches to account for interaction. The mediated interactive effect can be left as its own component in the decomposition.
A THREE-WAY DECOMPOSITION ON THE RATIO SCALE
Thus far, we have been considering the definition of these direct, indirect, and interaction effects on a difference scale. Often in epidemiology, risk ratios or odds ratios are used for convenience, ease of interpretation, or to account for study design. Direct and indirect effects have also been considered on risk ratio and odds ratio scales.5,12 For example, we could define the conditional total effect risk ratio by . We could likewise define the pure direct effect risk ratio by and the pure indirect effect risk ratio by . As shown in the eAppendix (http://links.lww.com/EDE/A651), we then have the following decomposition for the excess relative risks:
| (4) |
On the left-hand side of this equation, the term is the excess relative risk for the total effect. On the right-hand side of the equation, we have a three-way decomposition. The first term in this decomposition is the excess relative risk for the pure direct effect, the second term is the excess relative risk for the pure indirect effect, and the final term could be interpreted as a measure of mediated excess relative risk due to interaction. We will refer to this quantity as RERImediated. When using a ratio scale, epidemiologists will sometimes use a quantity called the “relative excess risk due to interaction”26 or the “interaction contrast ratio.”22 The causal relative excess risk due to interaction if M were binary would be defined as:
| (5) |
It assesses whether there is additive interaction but does so using ratios. The mediated relative excess risk due to interaction in equation (4) is analogous to the regular causal relative excess risk due to interaction in equation (5) but with replacing m = 1 and m = 0 in equation (5) with M1 and M0, respectively, in equation (4). It is shown in the eAppendix (http://links.lww.com/EDE/A651) that the RERImediated is equal to RERIcausal times a scaling factor. However, the interpretation of RERImediated as a mediated interaction is somewhat weaker on the ratio scale than on the difference scale because on the ratio scale we have only a three-way decomposition for average effects, whereas on the difference scale the decomposition in equation (1) held at the individual counterfactual level.
In any case, analogous to the decomposition for the total effect defined on a difference scale, we can decompose the excess relative risk for a total effect into the sum of the excess relative risk for the pure direct effect, the excess relative risk for the pure indirect effect, and the mediated relative excess risk due to interaction:
| (6) |
These quantities are similarly all identified under assumptions (i)–(iv); estimation of direct and indirect effect risk ratios is described elsewhere.5,12 Similar decompositions would hold also for an odds ratio scale. In the eAppendix (http://links.lww.com/EDE/A651), we describe a simple estimation approach for the ratio scale using regressions that allow for interaction. Likewise, in the eAppendix (http://links.lww.com/EDE/A651), we discuss how similar three-way decompositions hold for direct and indirect effects for hazard ratios,9–11 allowing one to decompose the excess hazard ratio for a total effect into the sum of an excess hazard ratio for the direct effect, an excess hazard ratio for the indirect effect, and the hazard ratio equivalent of the mediated relative excess risk due to interaction.
One final point is perhaps worth noting. Using odds ratios, which will approximate risk ratios when the outcome is rare, VanderWeele and Vansteelandt5 used a decomposition of a total effect risk ratio (odds ratio) into a product of a pure direct effect risk ratio and a total indirect effect risk ratio where the total indirect risk ratio would be defined as so that . VanderWeele and Vansteelandt proposed as a measure of the proportion mediated on the risk difference scale the measure . It is shown in the eAppendix (http://links.lww.com/EDE/A651) that the numerator in this quantity, , is in fact equal to , that is, to the sum of the excess relative risk for the pure indirect effect plus the mediated relative excess risk due to interaction. These are the latter two terms in the decomposition in equation (6).
DIRECT, INDIRECT, AND INTERACTIVE EFFECTS WITH REGRESSION
Suppose that assumptions (i)–(iv) hold that Y and M are continuous and that the following regression models for Y and M are correctly specified:
VanderWeele and Vansteelandt4 derived expressions for natural direct and indirect effects from these two regressions. However, as discussed above, we can further decompose such effects into a pure direct effect, a pure indirect effect, and a mediated interactive effect. It is shown in the eAppendix (http://links.lww.com/EDE/A651) that for exposure levels a and a* the pure direct effect and pure indirect effect are given by:
and the mediated interactive effect is given by
The sum of the pure indirect effect and the mediated interactive effect is equal to θ2β1+θ3β1a*)(a−a*), which is the total indirect effect derived by VanderWeele and Vansteelandt. If the exposure was binary, the pure direct, pure indirect, and mediated interactive effects would, respectively, simply be: (θ1+θ3(β0+β′2E[C])}, θ2β1 and θ3β1. Standard errors for estimators of these quantities could be derived using the delta method along the lines of VanderWeele and Vansteelandt4 or by using bootstrapping. In the eAppendix (http://links.lww.com/EDE/A651), we also derive similar expressions for a binary outcome for the pure direct effect risk ratio, the pure indirect effect ratio, and the mediated relative excess risk due to interaction.
Illustrations
We will consider two data examples using methods from causal mediation analysis to decompose a total effect into natural direct and indirect effects. Here, we will revisit these examples and give the three-way decompositions. VanderWeele et al27 used lung cancer case-control data to examine the extent to which the effect of chromosome 15q25.1 rs8034191 C alleles on lung cancer risk was mediated by cigarettes smoked per day. rs8034191 C alleles had been found to be associated with both smoking28,29 and lung cancer,30–32 but there had been debate as to whether the effects on lung cancer were direct or mediated by smoking. Because the outcome, lung cancer, is rare, odds ratios approximate risk ratios. Using lung case-control data and logistic regression models, controlling for sex, age, education, restricting to white persons, and allowing for gene-by-smoking interaction, it was found that comparing 2 to 0 C alleles gave a pure direct effect odds ratio of 1.72 (95% confidence interval [CI] = 1.34−2.21), a total indirect effect odds ratio of 1.028 (0.99−1.07), and a total effect odds ratio of 1.72 × 1.028 = 1.77 (1.38−2.26), with proportion mediated . Most of the effect was found to be not through increasing the number of cigarettes per day, that is, direct. The indirect effect was not quite statistically significant but this may have been because of limited sample size—the evidence for the effect of the variants on smoking in larger studies is quite clear, but the effect size is quite small.33 If we now use the three-way decomposition for risk ratios:
we find, , and RERImediated=0.036. Thus, of the excess relative risk, (1.77 − 1) = 0.77, for the total effect, (1.72 − 1)/0.77 = 93.7% is attributable to the pure direct effect, (1.014 − 1)/0.77 = 1.7% is attributable to the pure indirect effect, and 0.036/0.77 = 4.6% is attributable to the mediated interaction; again the overall proportion mediated is 1.7% + 4.6% = 6.3%. Of the mediated effect, which is itself a small proportion, most of this mediated effect is attributable to the mediated interaction rather than a pure indirect effect. In this case, there is little reason a priori to prefer either the pure indirect effect or the total indirect effect to assess the substantive question of interest; in this case, reporting the three-way decomposition may make the most sense.
In another example, Ananth and VanderWeele34 examined the extent to which the effect of placental abruption on perinatal mortality was mediated by preterm birth using National Center for Health Statistics birth certificate files from 1995–2002. Allowing for potential interaction between abruption and preterm birth and controlling for various sociodemographic variables, Ananth and VanderWeele found that the pure direct effect risk ratio was 10.18 (95% CI = 9.80–10.58), the total indirect effect risk ratio was 1.35 (1.33–1.38), and the total effect risk ratio was 10.18 × 1.35 = 13.76 (13.45–14.08), with proportion mediated: . If we now use the three-way decomposition for ratios:
we find , and RERImediated=2.11. Thus, of the excess relative risk, (13.76 − 1) = 12.76, for the total effect, (10.18 − 1)/12.76 = 71.9% is attributable to the pure direct effect, (2.47 − 1)/12.76 = 11.5% is attributable to the pure indirect effect, and 2.11/12.76 = 16.6% is attributable to the mediated interaction; again, the overall proportion mediated is 11.5% + 16.6% = 28.1%. From this analysis, we see that although a substantial portion of the effect of abruption on infant mortality is mediated by increasing the likelihood of preterm birth, it is the interaction between abruption and preterm birth in the majority of these cases of mediation that brings about infant mortality.
Both these examples would require assumptions (i)–(iv) above held conditional on the covariates, a point discussed again below. Discussion of these assumptions in their respective substantive contexts can be found in VanderWeele et al27 and Ananth and VanderWeele.34
DISCUSSION
The principle behind the results in this article was to use the difference between the total indirect effect and the pure indirect effect (or, equivalently, the total direct effect and pure direct effect) as a measure of interaction, a mediated interactive effect. The interpretation of this difference between two indirect effects as a measure of interaction required justification. In the case of these effects defined as the difference of counterfactuals, the difference between the total indirect effect and the pure indirect effect was, in fact, the product of a causal interaction defined in terms of counterfactuals and the effect of the exposure on the mediator. We thus referred to this effect as a mediated interactive effect. For this effect to be nonzero for an individual person, an interaction had to be present and the exposure had to have an effect on the mediator. We also saw that for conditional effects on the difference scale, the conditional average of this mediated interactive effect could, under the assumption of no exposure-induced mediator-outcome confounder, be expressed as the product of the standard additive interaction contrast and the average conditional effect of the exposure on the mediator. In the case of the ratio scale, the interactive effect (again ultimately arising from taking the difference between a total indirect effect and a pure indirect effect) could be interpreted as a mediated analogue of the relative excess risk due to interaction. Further discussion of the three-way decomposition for hazard ratios9–11,35,36 or for direct and indirect effects in the presence of a mediator-outcome confounder affected by exposure37 are given in the eAppendix (http://links.lww.com/EDE/A651). In all these cases, the total effect could thus be decomposed into a direct effect, an indirect effect, and an interactive effect.
The chief difficulty in estimating the components of this three-way decomposition is the strong assumptions required for their identification. These assumptions were no confounding of the exposure-outcome, mediator-outcome, and exposure-mediator relationships, conditional on the covariates, and further that there is no mediator-outcome confounder affected by the exposure. These are strong assumptions; however, the assumptions for the three-way decomposition are no stronger than those required to estimate direct and indirect effects generally. Moreover, the extent to which violations of these assumptions would affect inference can be assessed through sensitivity analysis for the pure direct and indirect effects.6,8 Future research could perhaps also adapt sensitivity analysis for interactions38 to extend such techniques to the mediated interaction considered in this article.
As noted above, and as has been done in the past, one could of course simply decompose a total or overall effect into two components: the pure direct effect and the total indirect effect. This raises the question of which of these decompositions is to be preferred—the two-way or the three-way—and what it is that is ultimately of interest when we carry out effect decomposition. The two-way decomposition is simpler, but the three-way decomposition has the potential to give additional insight. It allows us to assess how much of the total indirect effect is attributable to a mediated interaction versus a pure indirect effect. It makes clearer the role of interaction in mediation analysis. A researcher interested in mediation and effect decomposition should perhaps consider first whether the pure indirect effect or the total indirect effect more closely corresponds to what might be the mediated effect of interest. As has been pointed out previously, these two effects have different substantive interpretations and one or the other may be useful in different contexts.21 In other cases, however (such as perhaps the genetics example above), there may be no clear reason to choose between the two. In such instances, no choice need be made; an investigator can decompose the total effect into three components. In other cases, a researcher may want to know what portion of a mediated effect requires also the joint operation of the exposure and the mediator. In these cases, the three-way decomposition can give further insight into this question, as was perhaps the case in the perinatal example above.
In summary, then, a researcher who is interested in either the pure indirect effect or total indirect effect on substantive grounds perhaps has no reason to pursue the three-way decomposition. Alternatively, if the substantive setting is such that the choice between the two seems arbitrary, or if further insight is desired into what portion of a mediated effect requires the joint operation of the exposure and the mediator, then the three-way decomposition might be pursued. Arguably, however, in the end, the use of a method should be judged by the insight it gives into actual applications. Time and use over numerous data examples will ultimately make clearer the extent to which the three-way decomposition proposed in this article is helpful in practice.
Supplementary Material
ACKNOWLEDGMENTS
I thank Fan Mu and Nina Paynter for insightful questions that prompted this research, and Sander Greenland, Eric Tchetgen Tchetgen, and two reviewers for helpful comments on an earlier draft of the article.
Supported by National Institutes of Health grants HD060696 and ES017876.
APPENDIX
We first show that the decomposition in equation (1) holds. As noted in the text, we can decompose the total effect into a total indirect effect and a pure direct effect:
By adding and subtracting the pure indirect effect, (Y0M1−Y0M0), we obtain
The third quantity in this decomposition is the difference between the total indirect effect and the pure indirect effect. This quantity is also equal to the difference between the total direct effect and the pure direct effect, {(Y1M1−Y0M1)−(Y1M0−Y0M0)}. We will consider the value that this difference between the total indirect and the pure indirect effect, (Y1M1−Y1M0)−(Y0M1−Y0M0), might take under several different scenarios. If M0=M1, then both indirect effects are 0 and so the difference is 0. If M1 = 1 and M0 = 0, then (M1 − M0)=1 and the difference will be (Y11−Y10−Y01+Y00)=(Y11−Y10−Y01+Y00)(M1−M0). If M1=0 and M0=1, then M1−M0=−1 and the difference will be (−Y11+Y10+Y01−Y00)=(Y11−Y10−Y01+Y00)(M1−M0). Thus, the difference (Y1M1−Y1M0)−(Y0M1−Y0M0) is always equal to (Y11−Y10−Y01+Y00)(M1−M0) and we have (as above):
| (7) |
We will now establish the decomposition in equation (2) for conditional effects. We will in fact establish a more general result for an arbitrary exposure and mediator (not restricting to binary exposure and mediator). We have that E[Ya−Ya*|c]
where the first quantity is the conditional pure direct effect, the second is the conditional pure indirect effect, and the third is the difference between the conditional total direct effect and the conditional pure direct effect. Under assumption (iv) that YamMa*∐X, we have that this difference is:
where m* is an arbitrary value of M, and where the first equality follows by iterated expectations, the second by assumption (iv), and the fourth because for some fixed level of m*, mE[Ya*m|c]{P(Ma=m|c)−P(Ma*=m|c)}=0, and mE[Ya*m*|c]{P(Ma=m|c)−P(Ma*=m|c)}=0. Thus, for arbitrary exposure and mediator, under assumption (iv) we have the decomposition of the conditional effect:
where the first term is the pure direct effect, the second is the pure indirect effect, and the third is a mediated interactive effect. If we consider binary exposure and mediator with a=1,a*=0,m*=0, we have
and so we have
| (8) |
thus establishing the decomposition in equation (2).
For the identification formulae in equation (3), under assumptions (i)–(iv) that
has been established elsewhere.2 We have shown above that under assumption (iv),
and under assumptions (i) and (ii) the first term in this product is equal to {E[Y|A=1,M=1,c]−E[Y|A=1,M=0,c]−E[Y|A=0,M=1,c]+E[Y|A=0,M=0,c]} and under assumption (iii) the second term in this product is equal to E[M|A=1,c]−E[M|A=0,c], thus establishing the identification formulae in equation (3).
Footnotes
Publisher's Disclaimer: This is a PDF file of an unedited manuscript that has been accepted for publication. As a service to our customers we are providing this early version of the manuscript. The manuscript will undergo copyediting, typesetting, and review of the resulting proof before it is published in its final citable form. Please note that during the production process errors may be discovered which could affect the content, and all legal disclaimers that apply to the journal pertain.
SDC Supplemental digital content is available through direct URL citations in the HTML and PDF versions of this article (www.epidem.com). This content is not peer-reviewed or copy-edited; it is the sole responsibility of the author.
REFERENCES
- 1.Robins JM, Greenland S. Identifiability and exchangeability for direct and indirect effects. Epidemiology. 1992;3:143–155. doi: 10.1097/00001648-199203000-00013. [DOI] [PubMed] [Google Scholar]
- 2.Pearl J. Proceedings of the Seventeenth Conference on Uncertainty and Artificial Intelligence. San Francisco, Calif: Morgan Kaufmann; 2001. Direct and indirect effects; pp. 411–420. [Google Scholar]
- 3.van der Laan MJ, Petersen ML. Direct effect models. Int J Biostat. 2008 doi: 10.2202/1557-4679.1064. Article 23. [DOI] [PubMed] [Google Scholar]
- 4.VanderWeele TJ, Vansteelandt S. Conceptual issues concerning mediation, interventions and composition. Statistics and Its Interface. 2009;2:457–468. [Google Scholar]
- 5.Vanderweele TJ, Vansteelandt S. Odds ratios for mediation analysis for a dichotomous outcome. Am J Epidemiol. 2010;172:1339–1348. doi: 10.1093/aje/kwq332. [DOI] [PMC free article] [PubMed] [Google Scholar]
- 6.Imai K, Keele L, Tingley D. A general approach to causal mediation analysis. Psychol Methods. 2010;15:309–334. doi: 10.1037/a0020761. [DOI] [PubMed] [Google Scholar]
- 7.Imai K, Keele L, Tingley D, Yamamoto T. Causal mediation analysis using R. In: Vinod HD, editor. Advances in Social Science Research Using R. New York: Springer (Lecture Notes in Statistics); 2010. pp. 129–154. [Google Scholar]
- 8.VanderWeele TJ. Bias formulas for sensitivity analysis for direct and indirect effects. Epidemiology. 2010;21:540–551. doi: 10.1097/EDE.0b013e3181df191c. [DOI] [PMC free article] [PubMed] [Google Scholar]
- 9.Lange T, Hansen JV. Direct and indirect effects in a survival context. Epidemiology. 2011;22:575–581. doi: 10.1097/EDE.0b013e31821c680c. [DOI] [PubMed] [Google Scholar]
- 10.VanderWeele TJ. Causal mediation analysis with survival data. Epidemiology. 2011;22:582–585. doi: 10.1097/EDE.0b013e31821db37e. [DOI] [PMC free article] [PubMed] [Google Scholar]
- 11.Tchetgen Tchetgen EJ. On causal mediation analysis with a survival outcome. Int J Biostat. 2011;7:1–38. doi: 10.2202/1557-4679.1351. Article 33, [DOI] [PMC free article] [PubMed] [Google Scholar]
- 12.Valeri L, VanderWeele TJ. Mediation analysis allowing for exposure-mediator interactions and causal interpretation: theoretical assumptions and implementation with SAS and SPSS macros. Technical Report. doi: 10.1037/a0031034. [DOI] [PMC free article] [PubMed]
- 13.Ten Have TR, Joffe MM. A review of causal estimation of effects in mediation analyses. Stat Methods Med Res. 2012;21:77–107. doi: 10.1177/0962280210391076. [DOI] [PubMed] [Google Scholar]
- 14.Robins JM. Semantics of causal DAG models and the identification of direct and indirect effects. In: Green P, Hjort NL, Richardson S, editors. Highly Structured Stochastic Systems. New York: Oxford University Press; 2003. pp. 70–81. [Google Scholar]
- 15.Pearl J. Causality: Models, Reasoning, and Inference. 2nd ed. Cambridge: Cambridge University Press; 2009. [Google Scholar]
- 16.VanderWeele TJ. Concerning the consistency assumption in causal inference. Epidemiology. 2009;20:880–883. doi: 10.1097/EDE.0b013e3181bd5638. [DOI] [PubMed] [Google Scholar]
- 17.Avin C, Shpitser I, Pearl J. Identifiability of path-specific effects. Proceedings of the International Joint Conferences on Artificial Intelligence. 2005:357–363. [Google Scholar]
- 18.Hafeman D. A sufficient cause based approach to the assessment of mediation. Eur J Epidemiol. 2008;23:711–721. doi: 10.1007/s10654-008-9286-7. [DOI] [PubMed] [Google Scholar]
- 19.Vanderweele TJ. Subtleties of explanatory language: what is meant by “mediation”? Eur J Epidemiol. 2011;26:343–346. doi: 10.1007/s10654-011-9588-z. [DOI] [PMC free article] [PubMed] [Google Scholar]
- 20.Suzuki E, Yamamoto E, Tsuda T. Identification of operating mediation and mechanism in the sufficient-component cause framework. Eur J Epidemiol. 2011;26:347–357. doi: 10.1007/s10654-011-9568-3. [DOI] [PubMed] [Google Scholar]
- 21.Hafeman DM, Schwartz S. Opening the Black Box: a motivation for the assessment of mediation. Int J Epidemiol. 2009;38:838–845. doi: 10.1093/ije/dyn372. [DOI] [PubMed] [Google Scholar]
- 22.Rothman KJ, Greenland S, Lash TL. Modern Epidemiology. 3rd ed. Philadelphia, Pa: Lippincott Williams and Wilkins; 2008. Concepts of interaction Chapter 5. [Google Scholar]
- 23.VanderWeele TJ, Robins JM. The identification of synergism in the sufficient-component-cause framework. Epidemiology. 2007;18:329–339. doi: 10.1097/01.ede.0000260218.66432.88. [DOI] [PubMed] [Google Scholar]
- 24.VanderWeele TJ, Robins JM. Empirical and counterfactual conditions for sufficient cause interactions. Biometrika. 2008;95:49–61. [Google Scholar]
- 25.VanderWeele TJ. Sufficient cause interactions and statistical interactions. Epidemiology. 2009;20:6–13. doi: 10.1097/EDE.0b013e31818f69e7. [DOI] [PubMed] [Google Scholar]
- 26.Rothman KJ. Modern Epidemiology. 1st ed. Boston, Mass: Little, Brown and Company; 1986. [Google Scholar]
- 27.VanderWeele TJ, Asomaning K, Tchetgen Tchetgen EJ, et al. Genetic variants on 15q25.1, smoking and lung cancer: an assessment of mediation and interaction. Am J Epidemiol. 2012;175:1013–1020. doi: 10.1093/aje/kwr467. [DOI] [PMC free article] [PubMed] [Google Scholar]
- 28.Saccone SF, Hinrichs AL, Saccone NL, et al. Cholinergic nicotinic receptor genes implicated in a nicotine dependence association study targeting 348 candidate genes with 3713 SNPs. Hum Mol Genet. 2007;16:36–49. doi: 10.1093/hmg/ddl438. [DOI] [PMC free article] [PubMed] [Google Scholar]
- 29.Spitz MR, Amos CI, Dong Q, Lin J, Wu X. The CHRNA5-A3 region on chromosome 15q24-25.1 is a risk factor both for nicotine dependence and for lung cancer. J Natl Cancer Inst. 2008;100:1552–1556. doi: 10.1093/jnci/djn363. [DOI] [PMC free article] [PubMed] [Google Scholar]
- 30.Hung RJ, McKay JD, Gaborieau V, et al. A susceptibility locus for lung cancer maps to nicotinic acetylcholine receptor subunit genes on 15q25. Nature. 2008;452:633–637. doi: 10.1038/nature06885. [DOI] [PubMed] [Google Scholar]
- 31.Amos CI, Wu X, Broderick P, et al. Genome-wide association scan of tag SNPs identifies a susceptibility locus for lung cancer at 15q25.1. Nat Genet. 2008;40:616–622. doi: 10.1038/ng.109. [DOI] [PMC free article] [PubMed] [Google Scholar]
- 32.Thorgeirsson TE, Geller F, Sulem P, et al. A variant associated with nicotine dependence, lung cancer and peripheral arterial disease. Nature. 2008;452:638–642. doi: 10.1038/nature06846. [DOI] [PMC free article] [PubMed] [Google Scholar]
- 33.Liu JZ, Tozzi F, Waterworth DM, et al. Wellcome Trust Case Control Consortium. Meta-analysis and imputation refines the association of 15q25 with smoking quantity. Nat Genet. 2010;42:436–440. doi: 10.1038/ng.572. [DOI] [PMC free article] [PubMed] [Google Scholar]
- 34.Ananth CV, VanderWeele TJ. Placental abruption and perinatal mortality with preterm delivery as a mediator: disentangling direct and indirect effects. Am J Epidemiol. 2011;174:99–108. doi: 10.1093/aje/kwr045. [DOI] [PMC free article] [PubMed] [Google Scholar]
- 35.Li R, Chambless L. Test for additive interaction in proportional hazards models. Ann Epidemiol. 2007;17:227–236. doi: 10.1016/j.annepidem.2006.10.009. [DOI] [PubMed] [Google Scholar]
- 36.VanderWeele TJ. Causal interactions in the proportional hazards model. Epidemiology. 2011;22:713–717. doi: 10.1097/EDE.0b013e31821db503. [DOI] [PMC free article] [PubMed] [Google Scholar]
- 37.Robins JM. A new approach to causal inference in mortality studies with sustained exposure period—application to control of the healthy worker survivor effect. Math Modelling. 1986;7:1393–1512. [Google Scholar]
- 38.VanderWeele TJ, Mukherjee B, Chen J. Sensitivity analysis for interactions under unmeasured confounding. Statistics in Medicine. 2012;31:2552–2564. doi: 10.1002/sim.4354. [DOI] [PMC free article] [PubMed] [Google Scholar]
Associated Data
This section collects any data citations, data availability statements, or supplementary materials included in this article.