

Abstract
Human stromal (mesenchymal) stem cells (hMSCs) are multipotent stem cells with ability to differentiate into mesoderm-type cells e.g. osteoblasts and adipocytes and thus they are being introduced into clinical trials for tissue regeneration. Traditionally, hMSCs have been isolated from bone marrow, but the number of cells obtained is limited. Here, we compared the MSC-like cell populations, obtained from alternative sources for MSC: adipose tissue and skin, with the standard phenotype of human bone marrow MSC (BM-MSCs). MSC from human adipose tissue (human adipose stromal cells (hATSCs)) and human skin (human adult skin stromal cells, (hASSCs) and human new-born skin stromal cells (hNSSCs)) grew readily in culture and the growth rate was highest in hNSSCs and lowest in hATSCs. Compared with phenotype of hBM-MSC, all cell populations were CD34−, CD45−, CD14−, CD31−, HLA-DR−, CD13+, CD29+, CD44+, CD73+, CD90+,and CD105+. When exposed to in vitro differentiation, hATSCs, hASSCs and hNSSCs exhibited quantitative differences in their ability to differentiate into adipocytes and to osteoblastic cells. Using a microarray-based approach we have unveiled a common MSC molecular signature composed of 33 CD markers including known MSC markers and several novel markers e.g. CD165, CD276, and CD82. However, significant differences in the molecular phenotype between these different stromal cell populations were observed suggesting ontological and functional differences. In conclusion, MSC populations obtained from different tissues exhibit significant differences in their proliferation, differentiation and molecular phenotype, which should be taken into consideration when planning their use in clinical protocols.
Electronic supplementary material
The online version of this article (doi:10.1007/s12015-012-9365-8) contains supplementary material, which is available to authorized users.
Keywords: Stromal cells, Mesenchymal stem cell, Adipose tissue, Bone marrow, Skin, DNA microarray
Introduction
Human stromal stem cells (also known as mesenchymal stem cells or multipotent stromal stem cells) (hMSC) are a group of clonogenic cells capable of self-renewal and multilineage differentiation into mesoderm-type cells e.g. osteoblasts, adipocytes and chondrocytes [1, 2]. MSC are being introduced in a number of clinical trials for tissue repair e.g. bone and cartilage defects, for the enhancement of tissue regeneration e.g. myocardial infarction, and immune modulation e.g. graft-versus-host disease (GvHD) [1, 3]. The initial results from these trials are very encouraging. The standard site for obtaining human MSC is bone marrow where the cells are located on the abluminal surface of blood vessels [4]. However, one limitation for obtaining hMSC from bone marrow is the difficulty of obtaining enough number of cells required for clinical studies [5]. During the recent years, MSC-like populations have been obtained from a wide range of tissues e.g. adipose tissue [6], skin [7], blood [8], umblical cord blood [9], teeth [10], pancreas [11] and liver [12]. Among all these tissues, adipose tissue and skin are attractive choices to obtain cells needed for clinical studies due to the ease of obtaining clinical samples.
Adipose tissue used for providing MSC is usually obtained during operative procedure e.g. liposuction [13] and human adipose tissue derived stromal cells (hATSCs) have been reported to exhibit a similar phenotype to that of human bone marrow MSC (hBM-MSCs) [6, 13] . Also recently, it has been reported that stromal cultures of foreskin and skin can generate MSC-like cells with differentiation capacity into mesodermal cells (adipocytes, osteoblasts, chondrocytes) and possibly to cells from the ectodermal cells and endodermal lineages in vitro [14–16]. However, similarities and differences of these different cell populations are not clearly defined.
The aim of the present study was to compare stromal cell populations obtained from two clinically relevant sources: adipose tissue and skin with the standard bone marrow-derived MSC. In addition, we employed microarray-based gene expression profiling in order to compare the molecular phenotype of these cell populations.
Material and Methods
Cell Culture
We obtained samples of adipose tissue and dermal skin from patients undergoing abdominal bariatric surgery, lipectomy, knee replacement or gastrointestinal operations. Fresh foreskin specimens were obtained from 2–3 day old male babies. None of the patients had malignant disease and all provided written informed consent. The project was approved by the Institution Review Board of King Saud University Medical College and Hospital (10-2815-IRB).
Unless otherwise stated, the basal culture medium used in all experiments is Dulbecco’s Modified Eagle Medium (DMEM) (supplemented with D-glucose 4500 mg/L, 4 mM L-Glutamine and 110 mg/L Sodium Pyruvate, 10 %), Fetal Bovine Serum (FBS) (10 %), Penicillin-Streptomycin(P/S) (1 %) and non-essential amino acids (1 %). All reagents were purchased from Gibco-Invitrogen, USA.
Human Adipose-Tissue Stromal Cells (hATSCs)
The adipose tissues were washed 3 to 4 times using Phosphate buffered saline (PBS), minced and incubated in 1 % collagenase type 1 for 45 min at 37 °C. Mature adipocytes and undigested tissue fragments were separated from pellets of stromal vascular fraction (SVF) by centrifugation at 500 g for 15 min. SVF cells were re-suspended in culture medium and plated in 25 cm2 tissue culture flasks and maintained in a humidified incubator at 37 °C and 5 % CO2. All non-adherent cells were removed after 24 h. Cells were fed with new medium for every 3–4 days until 70–80 % confluence. For all experiments cells were used at passage 4 with division ratio 1:3.
Human Skin Stromal Cells
Skin stromal cells were derived from two sources: foreskin samples (human new-born skin stromal cells, hNSSCs) and from abdominal or knee skin samples (human adult skin stromal cells, hASSCs). The skin specimens were washed in PBS and the subcutaneous tissues (hypodermis) were mechanically dissected and removed. The samples were cut into small pieces ≈3 mm and employed as an explant culture with the dermis layer lying on the culture surface. The tissues were maintained in a humidified incubator at 37 °C and 5 % CO2. For all experiments cells were used at passage 4 with division ratio 1:3. For DNA microarray studies, two commercially available non-stem fibroblastic cell lines were included: neonatal foreskin fibroblasts HFF1(ATCC # SCRC-1041) and BJ (ATCC # SCRC-2522).
Human Bone Marrow-Derived MSC
As a model for human bone marrow derived MSC (hBM-MSCs), we employed a well characterized hMSC cell line that has been telomerized by the human telomerase reversetranscriptase gene (hTERT) transduction and known as hMSC-TERT [17]. The hMSC-TERT express all known markers and similar differentiation capacity of normal hBM-MSCs in vitro and in vivo [18]. For the DNA microarray studies, we included as a control, primary bone marrow derived MSC that were obtained from haematologically normal, osteoarthritic donor patients undergoing routine total hip-replacement surgery using STRO-1 antibody by immune magnetic panning (Kindly provided by Dr Emmajayne Kingham and Professor Richard Oreffo, University of Southampton, UK) .
Cell Proliferation
Proliferation rates of hATSCs, hASSCs and hNSSCs were determined by counting cell number and calculating population doubling (PD) rate. The cells were cultured in 6 cm2 tissue culture petri dish at cell density 8000 cells/cm2. At confluency, the cells were trypsinized and counted manually by hemocytometer. At each passage, population doubling was determined by the formula: logN/log2 where N is the number of cells at confluence divided by the initial cell number. Cumulative PD level is the sum of population doublings and PD rate is PD/time in culture.
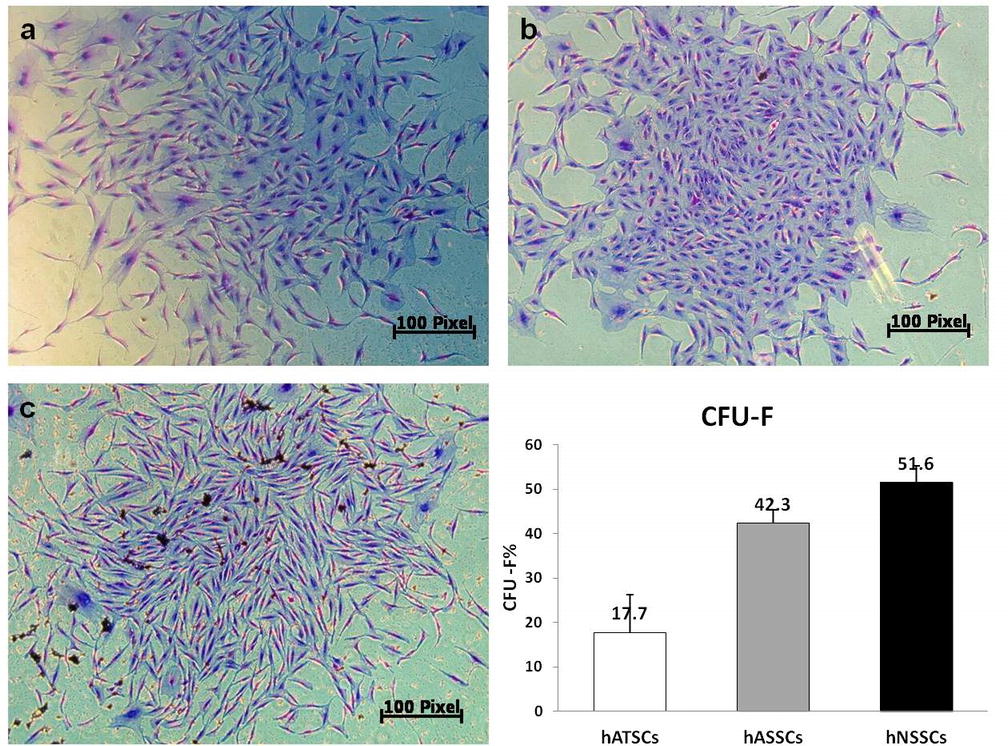
Colony Forming Unit-Fibroblast (CFU-F) Assay
hATSCs, hASSCs and hNSSCs were plated at 103 cells in 6-cm petri dishes and allowed to grow for 15 days. The cultures were terminated and stained with crystal violet for colony visualization. A colony was defined as a group of cells (>40). The colonies were counted manually under an inverted microscope.
Cell Differentiation
Osteoblast Differentiation
Cells were cultured in basal medium till 70–80 % confluence. Osteogenic induction medium composed of DMEM containing 10 % FBS, 1 % P/S, 50 μg/mL L-ascorbic acid (Wako Chemicals GmbH, Neuss, Germany), 10 mM β-glycerophosphate (Sigma), and 10 nM calcitriol[(1α,25-dihydroxy vitamin D3) (sigma)], 10 nM dexamethasone (Sigma) was added and was changed every 3 days. Control cultures were maintained in vehicle-containing basal medium.
Adipocyte Differentiation
Cells were cultured in basal medium until 90–100 % confluence and then transferred to DMEM medium containing adipogenic-induction mixture containing 10 % FBS, 10 % Horse Serum (Sigma), 1 % P/S, 100 nM dexamethasone, 0.45 mM isobutyl methyl xanthine [(IBMX) (Sigma)], 3 μg/mL insulin (Sigma), and 1 μM Rosiglitazone [(BRL49653) (Novo Nordisk, Bagsvaerd, Denmark)]. The adipogenic induction medium was replaced every 3 days. Control cells were cultured in vehicle-containing basal medium.
Cytochemical Assays
Alkaline Phosphatase (ALP) Staining for Osteoblasts
Cells were washed in PBS, fixed in acetone/citrate buffer and incubated with ALP substrate solution (naphthol AS-TR phosphate 0.1M Tris buffer, pH 9.0) for 1 h at room temperature.
Oil Red-O Staining for Adipocytes
Cells were washed in PBS, fixed in 4 % formaldehyde and stained for 1 h at room temperature with filtered Oil red-O staining solution (prepared by dissolving 0.5 g Oil red-O powder in 60 % isopropanol).
Immunofluorescence Staining
Cells were fixed with 4 % cold paraformaldehyde (Sigma) for 15 min and permeabilized with 0.1 % Triton X-100 (Sigma) for 10 min. After washing with PBS, cells were treated with 3 % bovine serum albumin (BSA, Sigma) for 30 min, followed by incubation with primary antibody (purified mouse anti-vimentin, BD Pharminogen) diluted in PBS (1:100) at 4 °C overnight. After removal of primary antibodies, cells were washed three times with PBS, and the secondary antibody (Goat polyclonal to anti mouse IgG, Abcam) conjugated to FITC was added (1:4000) and incubated for 1 h at room temperature. Cells were washed three times with PBS, and mounted with a medium containing DAPI to detect nuclei (VectaShield; Vector Labs, Burlingame, CA).
Flow Cytometry (FACS) Analysis
Cells were harvested by use of 0.05 % trypsin-EDTA for 5 min at 37 °C, recovered by centrifugation at 200 g for 5 min, washed twice in ice-cold PBS supplemented with 2 % FBS and re-suspended at a concentration of 105 cells/antibody test. Ten μL of PE-conjugated mouse anti-human CD146, CD73, CD29 and HLA-DR, FITC-conjugated mouse anti-human CD34, CD90, CD45, CD13 and CD31, APC-conjugated mouse anti-human CD105, CD14 and CD44 antibodies (all from BD Biosciences, except that the monoclonal antibody against human CD105, was from R&D systems) were used. Negative control staining was performed using a FITC/PE/APC-conjugated mouse IgG1 isotype antibodies. After storage for 30 min at room temperature in the dark, cells were washed with PBS, re-suspended in 500 μL of PBS and analyzed in the BD FACS Calibur flow cytometer (BD Biosciences). Living cells were gated in a dot plot of forward versus side scatter signals acquired on linear scale. At least, 8000 gated events were acquired on a log fluorescence scale. Positive staining was distinct as the emission of a fluorescence signal that surpassed levels achieved by >99 % of control cell population stained with corresponding isotype antibodies. The ratios of fluorescence signals versus scatter signals were calculated and histograms were generated using the software Cell Quest Pro Software Version 3.3 (BD Biosciences).
Reverse Transcriptase (RT)-Real-Time Quantitative Polymerase Chain Reaction (qPCR)
Total RNA was extracted using MagNA pure compact RNA isolation kit (Roche Applied Science, Germany. Cat No: 04802993001) in automated MagNA pure compact system (Roche, Germany). cDNA synthesis and Polymerase chain reaction (PCR) samples were prepared using a iScript One-step RT-PCR Kit with SYBER Green (Bio-Rad, USA) and run on a Light Cycler (Roche) PCR machine. Relative quantification of PCR products were based on value differences between the target and β-actin control using the 2−ΔΔCT method., The following RT-PCR primers (all from Invitrogen limited, UK) were used to detect the expression of specific ß-actin (forward: TGTGCCCATCTACGAGGGGTATGC, reverse: GGTACATGGTGGTGCCGCCAGACA, amplify 448 bp), ALP (forward: ACGTGGCTAAGAATGTCATC, reverse: CTGGTAGGCGATGTCCTTA, amplify 475 bp), Osteocalcin (forward: AGAGCGACACCCTAGAC, reverse: CATGAGAGCCCTCACA, amplify 310 bp), Osteopontin (forward: GGTGATGTCCTCGTCTGTA, reverse: CCAAGTAAGTCCAACGAAAG, amplify 347 bp) PPAR-γ 2 (forward: CTCCACTTTGATTGCACTTTGG, reverse: TTCTCCTAT TGACCCAGAAAGC, amplify 307 bp), aP2 (forward: TGGTTGATTTTCCATCCCAT, reverse: GCCAGGAATTTGACGAAGTC, amplify 107 bp), Adiponectin (forward: ATGTCTCCCTTAGGACCAATAAG, reverse: TGTTGCTGGGAGCTGTTCTACTG, amplify 234 bp. The relative abundance of target mRNA was expressed relative to β-actin gene expression.
Microarray-Based Global Gene Expression Analysis
Total RNA was isolated using the GeneMatrix Universal RNA Purification Kit (Cat. E 3598-02, Roboklon, Berlin, Germany) and quality-checked by Nanodrop analysis (Nanodrop Technologies, Wilmington, DE, USA). 400 ng of total RNA was used as input for generating biotin-labeled cRNA (Ambion, Austin, TX, United States). cRNA samples were then hybridized onto Illumina human-8 BeadChips version 3. Hybridizations, washing, Cy3-streptavidin staining and scanning were performed on the Illumina BeadStation 500 platform (Illumina, San Diego, CA, USA), according to the manufacturer’s instruction. hMSC-TERT was hybridized in duplicates, while triplicates were used for the following samples: hNSSCs, hASSCs, hATSCs. Expression data analysis was carried out using the BeadStudio software 3.0 (Illumina, San Diego, CA, USA). Raw data were background-subtracted, normalized using the “rank invariant” algorithm, and filtered for significant expression on the basis of negative control beads. Genes were considered significantly expressed with detection p values ≤ 0.01. Differential expression analysis was performed with the illumina custom method using hMSC-TERT as reference control. The following parameters were set to identify statistical significance: differential p values ≤ 0.01, fold change ratio >1.5. Pathway analysis was performed using DAVID Bioinformatics Resources 6.7 (http://david.abcc.ncifcrf.gov). Heatmap picture was generated using Microarray Software Suite TM4 (TM4.org).
Statistical Analysis
All results are based on at least 3 independent experiments and are expressed as mean % ± SD for 6 donors in each group. The One-Way ANOVA was used to analyze results of FACS. Post-hoc testing was performed for intergroup comparison using student T-test. Student t test was used to compare the mean values of PD rates between groups. Value of P < 0.05 was considered statistically significant. The SPSS software package (version 17.0; SPSS Inc., USA) was used for the statistical testing.
Results
Cell Morphology
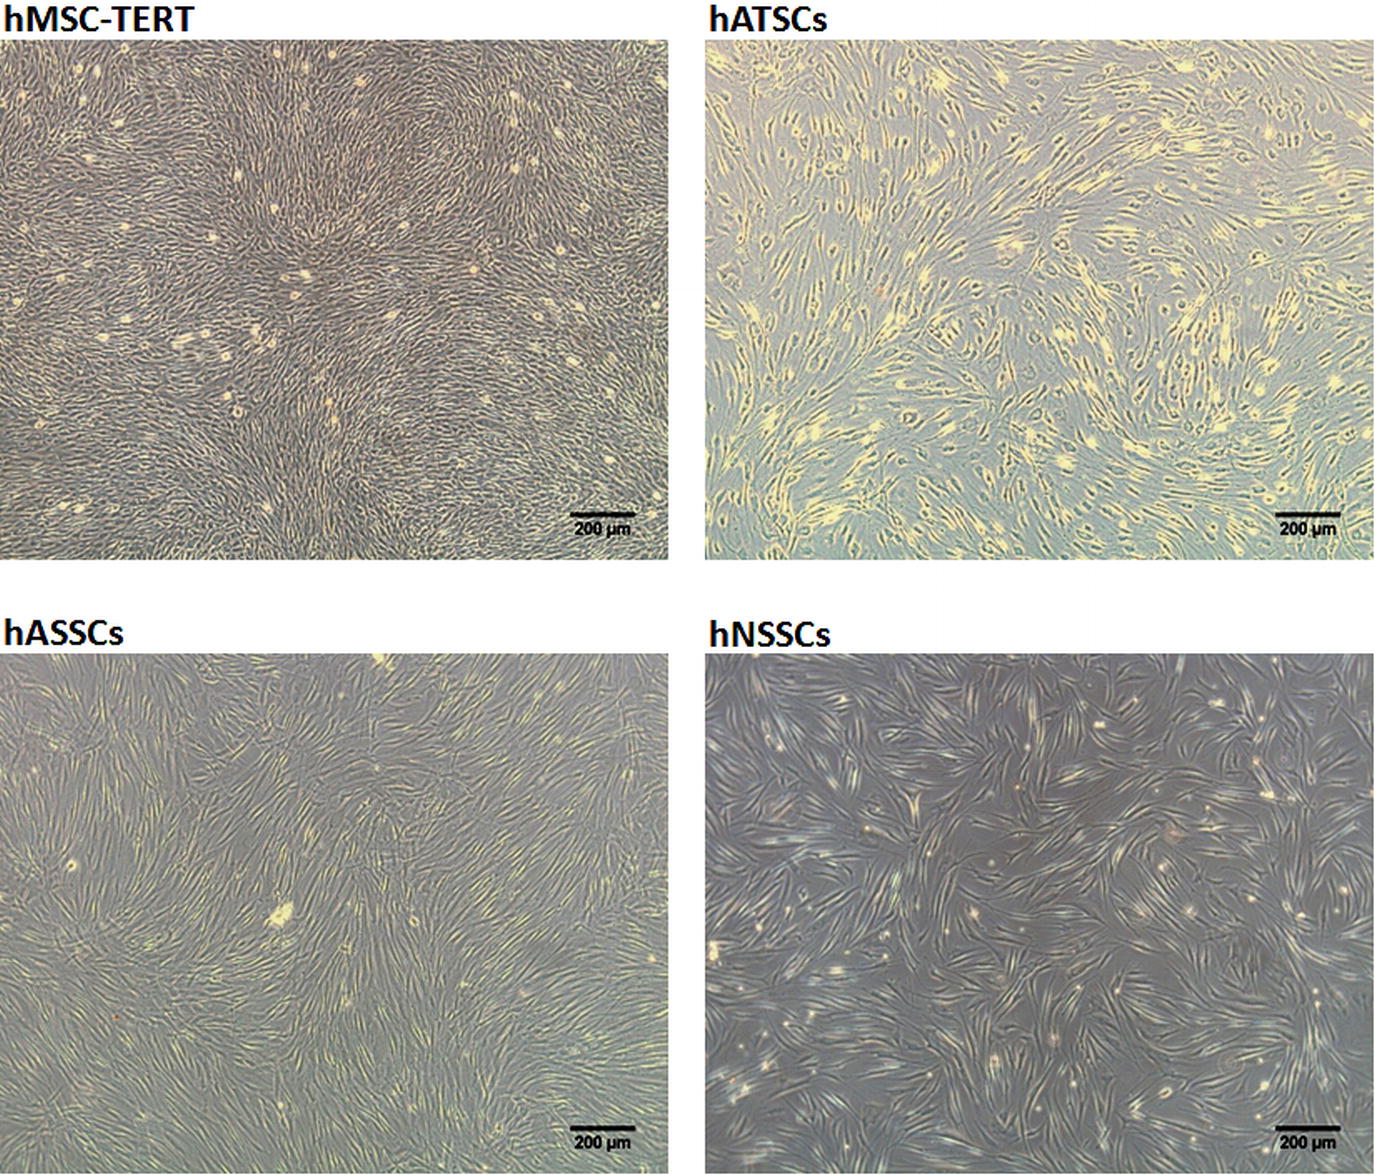
hATSCs, hASSCs and hNSSCs as well as hMSC-TERT exhibited fibroblast-like appearance with no distinct morphological differences (Supplementary Figure 1). Also, immunocytochemical staining for vimentin which a general marker for mesenchymal cells, demonstrated similar staining pattern among the four cell populations (Fig. 1b).
Fig. 1.
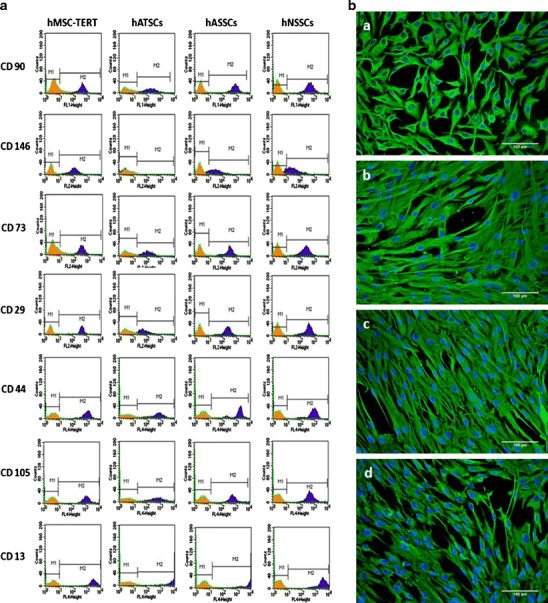
Phenotypic analysis hMSC-TERT, hATSCs, hASSCs and hNSSCs. The human bone marrow stromal (mesenchymal) stem cell (hMSC) immortalized with human telomerase reverse transcriptase gene (hMSC-TERT) and stromal cells derived from adipose tissue (hATSCs), adult dermal skin (hASSCs) and neonatal foreskin (hNSSCs) cells were cultured using plastic adherence. a Flow cytometry analysis of CD cell surface proteins. Filled histograms represent cells stained with the corresponding isotype control antibody. Five thousand events were collected and analyzed. b Immunofluorescence based detection of Vimentin expression and visualization of nuclei using DAPI
FACS Analysis for Surface Marker Expression
hATSCs, hASSCs and hNSSCs and hMSC-TERT were analyzed for expression of CD markers known to be expressed by MSC (Fig. 1a). All the cell populations were negative for the hematopoietic and endothelial lineage markers CD34, CD45, CD14, CD31, as well as for the MHC class II molecule: HLADR. The cell populations were positive for known hBM-MSC markers and the percentage of positive cells were similar in all four cell populations except for CD146 that was expressed at low levels (5 %) in hATSCs (Supplementary Table 1).
Cell Proliferation
Individual growth curves of hATSCs, hASSCs and hNSSCs cell strains and the mean values of growth rate as estimated by PD/day in each cell type are presented in Figs. 2a & b. As shown in Fig. 2b, hNSSCs exhibited a higher cell proliferation rate in long-term cultures compared with hASSCs and hATSCs as evidenced by mean PD rate of 0.78, 1.13 and 1.11 PD/day, respectively.
Fig. 2.

Proliferation potential of hATSCs, hASSCs and hNSSCs. Stromal cells derived from adipose tissue (hATSCs), adult dermal skin (hASSCs) and neonatal foreskin (hNSSCs) cells were cultured using plastic adherence. a hATSCs (n = 7), hASSCs (n = 5) and hNSSCs (n = 6) cumulative population doublings (PD) during long-term culture. b PD rate of hATSCs, hASSCs and hNSSCs. *p < 0.05
CFU-f Formation
hATSCs, hASSCs and hNSSCs were able to form colonies (supplementary Figure 2) and the number of colonies formed in hATSCs were lower than those formed in hASSCs and hNSSCs.
Cell Differentiation
Osteoblast Differentiation
hATSCs, hASSCs, hNSSCs and hMSC-TERT were exposed to 21-day in vitro osteoblast differentiation and time course expression of osteoblastic makers (ALP, osteocalcin and osteopontin) was determined (Fig. 3). Based on fold increase in expression of osteoblastic markers, induction of osteoblastic phenotype was most pronounced in hMSC-TERT. hATSCs, hNSSCs and hASSCs exhibited limited responses in expression of ALP and osteocalcin. Similar data were observed from ALP cytochemical staining where OB-induced hMSC-TERT exhibited the most intense staining followed by hATSCs and to lesser extent by hASSCs and hNSSCs (Supplementary Figure 3).
Fig. 3.
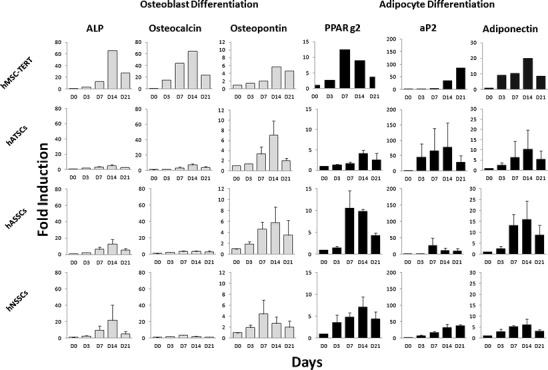
Gene expression of osteoblast and adipocyte markers during in vitro differentiation of hMSC-TERT, hATSCs, hASSCs and hNSSCs. The human bone marrow stromal (mesenchymal) stem cells (hMSC) immortalized with human telomerase reverse transcriptase gene (hMSC-TERT) and stromal cells derived from adipose tissue (hATSCs), adult dermal skin (hASSCs) and neonatal foreskin (hNSSCs) cells were cultured using plastic adherence and exposed to either osteoblast or adipocyte differentiation medium over a 21 day (D) period. Gene expression was normalized to beta-ACTIN and was represented as fold-change of non-induced D0 control cells. hMSC-TERT, hATSCs, hASSCs and hNSSCs data are shown as mean ± SD of three donor biological samples from at least two independent experiments. ALP = alkaline phosphatase, PPARg2 = Peroxisome proliferator-activated receptor gamma2, aP2 = adipocyte protein 2
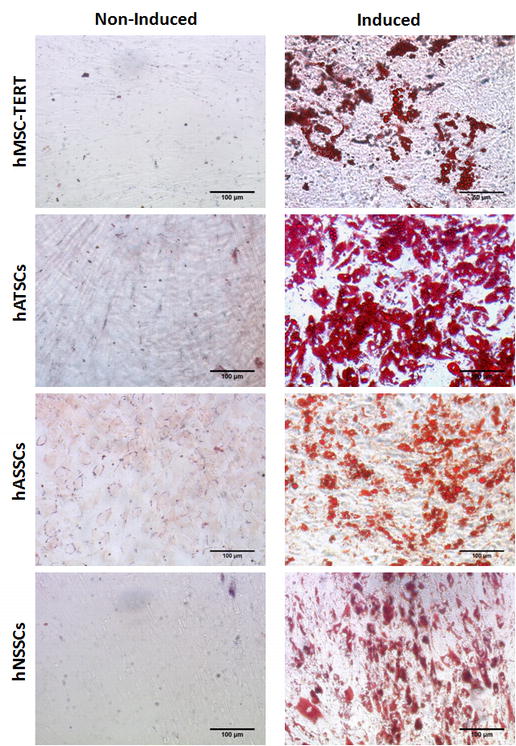
Adipocyte Differentiation
hATSCs, hASSCs and hNSSCs and hMSC-TERT were exposed to 21-day in vitro adipocyte differentiation and time course expression of adipocytic makers (PPARγ2, aP2 and adiponectin) was determined (Fig. 3). The four cell populations responded to adipocyte induction by up-regulation of adipocytic gene markers. Large inter-individual variation in the degree of adipogenic responses were observed among different cell strains obtained from different donors but all cell population formed lipid-filled adipcoytes. Adipocyte formation was most extensive in hATSCs (Supplementary Figure 4).
Microarray Analysis
In order to identify the molecular phenotype of hATSCs, hASSCs, hNSSCs and hMSC-TERT cells, microarray-based gene expression was carried out. Hierarchical clustering (Supplementary Figure 5A, B) and the correlation co-efficients-R2 (Supplementary Figure 5C) revealed that the transcriptome of hNSSCs is much closer to that of hMSC-TERT cells (R2 0.803–0.827), followed by hASSCs (R2 0.774–0.832), and then hATSCs cells (R2 0.641–0.791).
To enable a clear overview of the distinct and overlapping gene expression patterns between these cell populations, a Venn diagram was constructed based on genes detected as expressed within each cell type (Fig. 4a). Full details of these groups of genes and associated pathways are presented in supplementary Table 2. A vast number of genes (n = 6533) are expressed in common in all the cell types, a distinct feature of this signature is the expression of known MSC surface markers such as (CD29, CD44, CD73, CD90, CD63, CD71, CD105, CD304) and the lack of expression of prototypic hematopoietic antigens such as CD34, CD11a and CD45 (Table 1). An expanded list of the expression patterns of various cell surface markers is presented in Table 1. Most notable is the core expression of 36 cell surface markers (cluster I) which we refer to as a “common MSC molecular signature”. This cluster also includes CD29, CD44, CD73, CD90, CD63, CD71, CD105, CD304. This cluster is also expressed in primary bone marrow hMSC-STRO+ cells. Cluster II is composed of genes of cell surface markers that are not expressed in hMSC-TERT nor in hMSC-STRO+ including CD34, CD11a and CD45. We found that 72 out of 82 surface markers (cluster I and II) reveal the same expression pattern in hMSC-TERT and hMSC-STRO+. Ten surface markers are expressed in hMSC-TERT, hNSSCs, hATSCs and hASSCs but not in hMSC-STRO+ : cluster III: surface markers CD49b, CD49d, CD115, CD117, CD164, HLA-DRA. Finally, cluster IV is composed of surface markers CD14, CD15, CD102 which are expressed in hMSC-STRO+, hNSSCs, hATSCs and hASSCs but not in hMSC-TERT. None of these surface markers were expressed in HFF and in BJ cell line only CD104 was expressed.
Fig. 4.
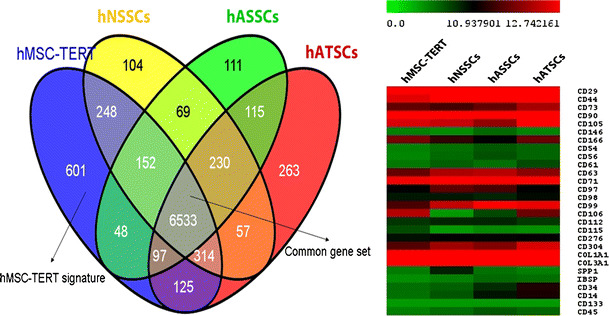
Microarray-based gene expression analysis of hMSC-TERT, hATSCs, hASSCs and hNSSCs. The human bone marrow stromal (mesenchymal) stem cells (hMSC) immortalized with human telomerase reverse transcriptase gene (hMSC-TERT) and stromal cells isolated from adipose tissue (hATSCs), adult dermal skin (hASSCs) and neonatal foreskin (hNSSCs) cells were cultured using plastic adherence. Total RNA was isolated and microarray analysis was carried out. a Venn diagram representing distinct and overlapping gene expression patterns between these cell populations. b Heat-map of a number of CD markers representing a common MSC molecular signature
Table 1.
A list of the expression patterns of various cell surface markers expressed in the human bone marrow stromal (mesenchymal) stem cells (hMSC) immortalized with human telomerase reverse transcriptase gene (hMSC-TERT), non-immortalized hMSCs sorted for the marker STRO-1 (hMSC-STRO+), stromal cells isolated from adipose tissue (hATSCs), adult dermal skin (hASSCs) and neonatal foreskin (hNSSCs) and fibroblasts cell lines HFF and BJ. Cluster I: expressed in hMSC-TERT and hMSC-STRO+, cluster II: not expressed in hMSC-TERT and hMSC-STRO+, cluster III: only expressed in hMSC-TERT, cluster IV: only expressed in hMSC-STRO+. + = gene expression detected, − = gene expression was absent
| Gene name | Marker | hMSC-TERT | hMSC-STRO+ | hATSCs | hNSSCs | hASSCs | HFF | BJ | Cluster |
|---|---|---|---|---|---|---|---|---|---|
| ALCAM | CD166 | + | + | + | + | + | − | − | I |
| ANPEP | CD13 | + | + | + | + | + | − | − | |
| B2M | B2M | + | + | + | + | + | − | − | |
| CD276 | CD276 | + | + | + | + | + | − | − | |
| CD44 | CD44 | + | + | + | + | + | − | − | |
| CD58 | CD58 | + | + | + | + | + | − | − | |
| CD63 | CD63 | + | + | + | + | + | − | − | |
| CD82 | CD82 | + | + | + | + | + | − | − | |
| CD97 | CD97 | + | + | + | + | + | − | − | |
| CD99 | CD99 | + | + | + | + | + | − | − | |
| COL1A1 | COL1A1 | + | + | + | + | + | − | − | |
| COL3A1 | COL3A1 | + | + | + | + | + | − | − | |
| ENG | CD105 | + | + | + | + | + | − | − | |
| HLA-A | HLA-A | + | + | + | + | + | − | − | |
| ICAM3 | CD50 | + | + | + | + | + | − | − | |
| IFNGR1 | CD119 | + | + | + | + | + | − | − | |
| IL1R1 | CD121a | + | + | + | + | + | − | − | |
| ITGA1 | CD49a | + | + | + | + | + | − | − | |
| ITGA3 | CD49c | + | + | + | + | + | − | − | |
| ITGA5 | CD49e | + | + | + | + | + | − | − | |
| ITGAE | CD103 | + | + | + | + | + | − | − | |
| ITGAV | CD51 | + | + | + | + | + | − | − | |
| ITGB1 | CD29 | + | + | − | + | + | − | − | |
| ITGB2 | CD18 | + | + | + | − | + | − | − | |
| NCAM1 | CD56 | + | + | + | + | + | − | − | |
| NRP1 | CD304 | + | + | + | + | + | − | − | |
| NT5E | CD73 | + | + | + | + | + | − | − | |
| PDGFRA | CD140a | + | + | + | + | + | − | − | |
| PVRL2 | CD112 | + | + | + | + | + | − | − | |
| PVRL3 | CD113 | + | + | + | + | + | − | − | |
| RUNX2 | RUNX2 | + | + | − | − | − | − | − | |
| SLC3A2 | CD98 | + | + | + | + | + | − | − | |
| TFRC | CD71 | + | + | + | + | + | − | − | |
| THY1 | CD90 | + | + | + | + | + | − | − | |
| TNFRSF1A | CD120a | + | + | + | + | + | − | − | |
| VCAM1 | CD106 | + | + | + | − | + | − | − | |
| BGLAP | BGLAP | − | − | − | − | − | − | − | II |
| CD109 | CD110 | − | − | + | + | + | − | − | |
| CD34 | CD34 | − | − | − | − | − | − | − | |
| CD36 | CD36 | − | − | − | − | − | − | − | |
| CD38 | CD38 | − | − | − | − | − | − | − | |
| CD4 | CD4 | − | − | − | − | − | − | − | |
| CD9 | CD9 | − | − | + | + | + | − | − | |
| FLT1 | FLT2 | − | − | − | − | − | − | − | |
| HLA-DRB1 | HLA-DRB1 | − | − | − | − | − | − | − | |
| HLA-DRB3 | HLA-DRB3 | − | − | − | − | − | − | − | |
| HLA-DRB4 | HLA-DRB4 | − | − | − | − | − | − | − | |
| HLA-DRB5 | HLA-DRB5 | − | − | − | − | − | − | − | |
| HLA-DRB6 | HLA-DRB6 | − | − | − | − | − | − | − | |
| IBSP | IBSP | − | − | − | − | − | − | − | |
| ICAM1 | CD54 | − | − | − | − | − | − | − | |
| IL1R2 | CD121b | − | − | − | − | − | − | − | |
| IL2RA | CD25 | − | − | − | − | − | − | − | |
| IL2RB | CD122 | − | − | − | − | − | − | − | |
| IL3RA | CD123 | − | − | − | − | − | − | − | |
| IL4R | CD124 | − | − | − | − | − | − | − | |
| IL6R | CD126 | − | − | − | − | − | − | − | |
| IL7R | CD127 | − | − | − | − | − | − | − | |
| ITGAL | CD11a | − | − | − | − | − | − | − | |
| ITGB3 | CD61 | − | − | − | − | + | − | − | |
| ITGB4 | CD104 | − | − | − | − | − | − | + | |
| KDR | CD309 | − | − | − | − | − | − | − | |
| MCAM | CD146 | − | − | − | − | − | − | − | |
| MME CD10 | − | − | + | − | − | − | − | ||
| NGFR | CD271 | − | − | − | − | − | − | − | |
| PECAM1 | CD31 | − | − | − | − | + | − | − | |
| PROM1 | CD133 | − | − | − | − | − | − | − | |
| PTPRCAP | CD45 | − | − | − | − | − | − | − | |
| SELE | CD62e | − | − | − | − | − | − | − | |
| SELL | CD62l | − | − | − | − | − | − | − | |
| SELP | CD62p | − | − | − | − | − | − | − | |
| TNFRSF1B | CD120b | − | − | − | − | + | − | − | |
| CD164 | CD164 | + | − | + | + | + | − | − | III |
| CSF1R | CD115 | + | − | − | − | − | − | − | |
| HLA-DRA | HLA-DRA | + | − | − | − | + | − | − | |
| ITGA2 | CD49b | + | − | + | + | + | − | − | |
| ITGA4 | CD49d | + | − | + | + | − | − | − | |
| KIT | CD117 | + | − | + | + | − | − | − | |
| SPP1 | SPP1 | + | − | + | − | − | − | − | |
| CD14 | CD14 | − | + | + | + | + | − | − | IV |
| IV FUT4 | CD15 | − | + | + | + | + | − | − | |
| ICAM2 | CD102 | − | + | + | − | + | − | − |
A distinct set of 601 genes was found to be expressed exclusively in the MSC-TERT cells, amongst these genes are BGLAP, CD115/CSF1R, DLX5 and RUNX2. BGLAP (bone γ-carboxyglutamate (Gla) protein) encodes for osteocalcin, whilst DLX5 and RUNX2 are transcription factors involved in osteoblast differentiation and bone development. The hATSCs-specific gene is of 263, includes the cell surface markers, CD31, CD61 and CD120b, whilst 104 and 111 genes specify the cellular identity of hNSSCs and hASSCs cells respectively. The corresponding signaling and metabolic pathways associated with these cell type-specific gene signatures are presented in supplementary Table 2. The signaling pathways enriched in hMSC-TERT included pathways involved in bone formation e.g. Wnt, TGF-B and MAPK signaling while signaling pathways enriched in hATSCs belonged to adipocyte-relevant metabolic functions e.g. steroid hormone biosynthesis and Linoleic acid metabolism.
Discussion
In the present study we performed side-by-side comparison of 4 populations of stromal cells derived from adipose tissue, skin and bone marrow. While stromal cell populations can be defined by common set of CD markers, significant differences exist in the growth rate, differentiation potential and molecular signature of these cells.
The bona fide hMSC is derived from bone marrow and generally defined by a set of CD markers and multifunctional differentiation capacity as documented by several studies [19–21]. Our data corroborate the presence of a common set of CD markers expressed in stromal cells from adipose tissue, skin and bone marrow e.g. CD 90, CD73, CD29, CD44, CD105, CD13 and that MSC are negative for hemaptopoietic cell markers: CD45, CD34, CD14, and HLA-DR.
We found differences in the expression of CD146 between stromal cell populations with low levels of expression in adipose tissue MSC compared to skin and bone marrow MSC. CD146 has been identified as a marker for stromal stem cells (MSC) in bone marrow [4]. CD146 defines a population of perivascular and subendothelial cells that is present in different tissues [22]. However, clonal MSC is also present in CD146- bone marrow stromal cell fractions and differences between CD146+and CD146- may be related to variation in their functions [23]
We observed significant differences in the growth rates between stromal cells from skin and adipose tissue where hNSSCs exhibited the highest growth rate. These differences may not reflect compartment specific characteristics but most probably reflect differences in donor age: newborn versus adult donors [5]. Alternatively, differences in growth rate may reflect culture heterogeneity with variable proportion of self-renewing versus lineage-committed cells in different stromal cell compartment [24, 25].
Stromal cells from different compartment have been demonstrated in a large number of studies to differentiate into cells in the mesodermal lineages e.g. osteoblasts and adipocytes [6–8, 10–15, 20, 21, 26]. Our results demonstrate that there exist quantitative differences between different stromal cells with respect to their differentiation potential. Bone marrow stromal cells differentiated readily into osteoblastic cells and adipose stromal cells into adipocytes. Skin stromal cells differentiated better to adipocytes than osteoblasts. This suggests the presence of a lineage “imprinting” in different stromal cell compartments that influences the differentiation potential of MSC [27, 28]. Alternatively, we have previously demonstrated that MSC cultures are heterogenous and contains populations of pre-osteoblastic and pre-adipcytic cell populations in bone marrow stromal cultures in addition to the multipotent MSC [24]. The presence of variable number of these committed pre-osteoblastic vs pre-adipocytic cell population may be a factor determining the outcome of in vitro differentiation assays. Further studies of clonal analysis of MSC from different compartment are needed to corroborate this hypothesis.
Molecular profiling based on microarray analysis of steady state gene expression provides insight into the molecular phenotype of the cells and have been used previously in defining the identity of a number of stem cells including MSC and embryonic stem cells [25, 29]. We observed significant differences in the molecular profiling of stromal cells from different compartments, which support the presence of differences in their in vitro growth and differentiation. Interestingly, we found that the 4 stromal cell populations share a common CD marker signature that includes known CD markers of hBM-MSCs. However, this common “public” signature, although it is widely used by different investigators to define the cultured MSC phenotype is not predictive for their in vitro or in vivo behavior [25] and thus cannot be used prospectively to define the nature of the cultured cells [1]. Interestingly, microarray studies revealed the presence of a “private” signature that defines the stromal cells of each compartment and most probably determines their biological behavior. For examples, bone marrow MSC molecular signature was enriched in genes involved in genetic pathways important for bone formation e.g. Wnt and MAPK signaling whereas hATSCs were enriched for genes involved in fatty acid metabolism. Further studies are needed for examining the predictive value of the “private” molecular signature in defining the biological behavior of MSC. The validity of our findings is demonstrated by comparing the molecular phenotype of cell strains with that of primary cells. We have employed hMSC-TERT is an immortalized cell line as a representative model for human bone marrow derived MSC and due to its stable phenotype. Side-by-side comparsion of hMSC-TERT with primary hMSC-STRO + revealed greater similarity between the two cell populations and that they shared 83 % of the expressed genes including similar surface marker phenotype (supplementary figure 6). Similarly, we included two primary fibroblastic cells HFF1 and BJ, which in spite of their fibroblastic nature lacked the expression of the core markers of MSC phenotype.
Our findings have relevance in regenerative medicine. Bone marrow stromal cells have been utilized for their ability for bone tissue replacement and for their immune modulatory effects. However, our findings suggest that stromal cells from other compartments may not be able to replace bone marrow stromal cells in clinical protocols due to the presence of significant differences in their molecular phenotype and differentiation capacity. Thus, the choice of cell source should be based on the aim of clinical application and not on the accessibility of patients’ samples. In this context, the identification of compartment specific MSC molecular signature may help in developing a set of molecular markers that are predictive of the in vivo biological behavior of MSC and that can be used in screening of cultured MSC prior to their clinical use.
Electronic supplementary material
Below is the link to the electronic supplementary material.
Morphological characteristics of hMSC-TERT, hATSCs, hASSCs and hNSSCs. The human bone marrow stromal (mesenchymal) stem cells (hMSC) immortalized with human telomerase reverse transcriptase gene (hMSC-TERT) and stromal cells isolated from adipose tissue (hATSCs), adult dermal skin (hASSCs) and neonatal foreskin (hNSSCs) cells were cultured using plastic adherence and examined by phase contrast microscopy (bar = 200 μm). (JPEG 347 kb)
Colony forming Unit-fibroblast (CFU-F) formation. Stromal cells isolated from adipose tissue (hATSCs) (a), adult dermal skin (hASSCs) (b) and neonatal foreskin (hNSSCs) (c) were cultured using plastic adherence for 15 days. Colonies were defined as a well-defined group of cells (>40 cells). The number of colonies were determined manually (d). (JPEG 173 kb)
Staining for osteoblast with alkaline phosphatase. The human bone marrow stromal (mesenchymal) stem cells (hMSC) immortalized with human telomerase reverse transcriptase gene (hMSC-TERT) and stromal cells isolated from adipose tissue (hATSCs), adult dermal skin (hASSCs) and neonatal foreskin (hNSSCs) cells were cultured using plastic adherence and in the presence of osteoblast differentiation medium (OB differentiated) or under control conditions (control). Osteoblastic cells were visualized by positive staining for alkaline phosphatase (bar = 200 μm). (JPEG 74 kb)
Staining for adipocytes with Oil red O. The human bone marrow stromal (mesenchymal) stem cells (hMSC) immortalized with human telomerase reverse transcriptase gene (hMSC-TERT) and stromal cells isolated from adipose tissue (hATSCs), adult dermal skin (hASSCs) and neonatal foreskin (hNSSCs) cells were cultured using plastic adherence and in the presence of adipocyte induction medium (AD differentiated) or under control conditions (control). Adipocyte differentiated was demonstrated by staining with Oil red O (bar = 200 μm). (JPEG 99 kb)
Microarray-based analysis of hMSC-TERT, hATSCs, hASSCs and hNSSCs. The human bone marrow stromal (mesenchymal) stem cells (hMSC) immortalized with human telomerase reverse transcriptase gene (hMSC-TERT) and stromal cells isolated from adipose tissue (hATSCs), adult dermal skin (hASSCs) and neonatal foreskin (hNSSCs) cells were cultured through plastic adherence. RNA was isolated from (hMSC-TERT) and stromal cells derived from adipose tissue (hATSCs), adult dermal skin (hASSCs) and neonatal foreskin (hNSSCs) cells were subjected to microarray analysis. Additionally, we included normal primary bone marrow hMSC isolated by Stro-1 antibody immune magenetic panning (hMSC-STRO basal) and two commercial fibroblastic cell lines: neonatal foreskin fibroblasts BJ and HFF1. (A, B) Hierarchical clustering of the distinct cell populations. (C) Table showing correlation co-efficients-R2 between the different cell populations. (JPEG 158 kb)
Transcriptional similarity between hMSC-TERT and hMSC-STRO+ basal. The molecular phenotype of the human bone marrow stromal (mesenchymal) stem cells (hMSC) immortalized with human telomerase reverse transcriptase gene (hMSC-TERT) was compared to normal primary bone marrow hMSC isolated by Stro-1 antibody (hMSC-STRO). Venn diagram showing the distinct and overlapping gene signatures of hMSC-TERT and hMSC-STRO. The majority of transcripts were common to both cell types (6895 corresponding to 83 % of the total). (JPEG 29 kb)
Mean levels of stromal cells-associated, hematopoietic and endothelial markers expression on different cell population. (DOC 38 kb)
Spreadsheet 1: List of genes specific for hMSC-TERT. Spreadsheet 2: List of genes specific for hNSSCs. Spreadsheet 3: List of genes specific for hASSCs. Spreadsheet 4: List of genes specific for hATSCs. Spreadsheet 5: List of genes in common between hMSC-TERT and hNSSCs. Spreadsheet 6: List of genes in common between hMSC-TERT and hASSCs. Spreadsheet 7: List of genes in common between hMSC-TERT and hATSCs. Spreadsheet 8: List of genes in common between all samples expect for hATSCs. Spreadsheet 9: List of genes in common between all samples (XLS 397 kb)
Acknowledgment
This work was supported by grant from King Abdulaziz City for Science and Technology (09-BIO740-02). AP, MG and JA were supported by the Max Planck Society. We thank Dr. Abdulrahman Alzahem from pediatric department of King Khaled University Hospital for providing new born foreskin samples. We are grateful to Dr Emmajayne Kingham and Professor Richard Oreffo, University of Southampton, UK, for provision of STRO-1 positive cell populations and for helpful discussions.
Author Disclosure Statement
No competing financial interests exist.
Open Access
This article is distributed under the terms of the Creative Commons Attribution License which permits any use, distribution, and reproduction in any medium, provided the original author(s) and the source are credited.
Footnotes
May Al-Nbaheen and Radhakrishnan vishnubalaji contributed equally to this paper.
Contributor Information
May Al-Nbaheen, Email: malnbaheen@ksu.edu.sa.
Radhakrishnan vishnubalaji, Email: vishnubalaji_lr@yahoo.co.in.
Dalia Ali, Email: dawali@hotmail.com.
Amel Bouslimi, Email: amel_bouslimi@yahoo.fr.
Fawzi Al-Jassir, Email: aljassir@hotmail.com.
Matthias Megges, Email: megges@molgen.mpg.de.
Alessandro Prigione, Email: prigione@molgen.mpg.de.
James Adjaye, Email: adjaye@molgen.mpg.de.
Moustapha Kassem, Email: mkassem@health.sdu.dk.
Abdullah Aldahmash, Email: dahmash@ksu.edu.sa.
References
- 1.Kassem, M., Al-Nbaheen, M., Ali, D., & Aldahmash, A. (2010). Human Mesenchymal (skeletal) stem cells and clinical applications for bone tissue regeneration. In A. Bongso & E. H. Lee (Eds.), Stem Cells: From bench to bedside, 2nd edn (pp. 457–475). Singapore: World Scientific publishing co. pte. Ltd.
- 2.Abdallah BM, Kassem M. Human mesenchymal stem cells: from basic biology to clinical applications. Gene Therapy. 2008;15:109–116. doi: 10.1038/sj.gt.3303067. [DOI] [PubMed] [Google Scholar]
- 3.Le Blanc K, Frassoni F, Ball L, Locatelli F, Roelofs H, Lewis I, et al. Mesenchymal stem cells for treatment of steroid-resistant, severe, acute graft-versus-host disease: a phase II study. Lancet. 2008;371:1579–1586. doi: 10.1016/S0140-6736(08)60690-X. [DOI] [PubMed] [Google Scholar]
- 4.Sacchetti B, Funari A, Michienzi S, Di Cesare S, Piersanti S, Saggio I, et al. Self-renewing osteoprogenitors in bone marrow sinusoids can organize a hematopoietic microenvironment. Cell. 2007;131:324–336. doi: 10.1016/j.cell.2007.08.025. [DOI] [PubMed] [Google Scholar]
- 5.Stenderup K, Justesen J, Clausen C, Kassem M. Aging is associated with decreased maximal life span and accelerated senescence of bone marrow stromal cells. Bone. 2003;33:919–926. doi: 10.1016/j.bone.2003.07.005. [DOI] [PubMed] [Google Scholar]
- 6.Zuk PA, Zhu M, Ashjian P, De Ugarte DA, Huang JI, Mizuno H, et al. Human adipose tissue is a source of multipotent stem cells. Molecular Biology of the Cell. 2002;13:4279–4295. doi: 10.1091/mbc.e02-02-0105. [DOI] [PMC free article] [PubMed] [Google Scholar]
- 7.Toma JG, McKenzie IA, Bagli D, Miller FD. Isolation and characterization of multipotent skin-derived precursors from human skin. Stem Cells. 2005;23:727–737. doi: 10.1634/stemcells.2004-0134. [DOI] [PubMed] [Google Scholar]
- 8.Campagnoli C, Roberts IA, Kumar S, Bennett PR, Bellantuono I, Fisk NM. Identification of mesenchymal stem/progenitor cells in human first-trimester fetal blood, liver, and bone marrow. Blood. 2001;98:2396–2402. doi: 10.1182/blood.V98.8.2396. [DOI] [PubMed] [Google Scholar]
- 9.Rosada C, Justesen J, Melsvik D, Ebbesen P, Kassem M. The human umbilical cord blood: a potential source for osteoblast progenitor cells. Calcified Tissue International. 2003;72:135–142. doi: 10.1007/s00223-002-2002-9. [DOI] [PubMed] [Google Scholar]
- 10.Perry BC, Zhou D, Wu X, Yang FC, Byers MA, Chu TM, et al. Collection, cryopreservation, and characterization of human dental pulp-derived mesenchymal stem cells for banking and clinical use. Tissue Engineering. Part C, Methods. 2008;14:149–156. doi: 10.1089/ten.tec.2008.0031. [DOI] [PMC free article] [PubMed] [Google Scholar]
- 11.Seeberger KL, Eshpeter A, Korbutt GS. Isolation and culture of human multipotent stromal cells from the pancreas. Methods in Molecular Biology. 2011;698:123–140. doi: 10.1007/978-1-60761-999-4_10. [DOI] [PubMed] [Google Scholar]
- 12.Wenceslau CV, Miglino MA, Martins DS, Ambrosio CE, Lizier NF, Pignatari GC, et al. Mesenchymal progenitor cells from canine fetal tissues: yolk sac, liver, and bone marrow. Tissue Engineering. Part A. 2011;17:2165–176. doi: 10.1089/ten.tea.2010.0678. [DOI] [PubMed] [Google Scholar]
- 13.De Ugarte DA, Morizono K, Elbarbary A, Alfonso Z, Zuk PA, Zhu M, et al. Comparison of multi-lineage cells from human adipose tissue and bone marrow. Cells, Tissues, Organs. 2003;174:101–109. doi: 10.1159/000071150. [DOI] [PubMed] [Google Scholar]
- 14.Lorenz K, Sicker M, Schmelzer E, Rupf T, Salvetter J, Schulz-Siegmund M, et al. Multilineage differentiation potential of human dermal skin-derived fibroblasts. Experimental Dermatology. 2008;17:925–932. doi: 10.1111/j.1600-0625.2008.00724.x. [DOI] [PubMed] [Google Scholar]
- 15.Shi CM, Cheng TM. Differentiation of dermis-derived multipotent cells into insulin-producing pancreatic cells in vitro. World Journal of Gastroenterology. 2004;10:2550–2552. doi: 10.3748/wjg.v10.i17.2550. [DOI] [PMC free article] [PubMed] [Google Scholar]
- 16.Bi D, Chen FG, Zhang WJ, Zhou GD, Cui L, Liu W, et al. Differentiation of human multipotent dermal fibroblasts into islet-like cell clusters. BMC Cell Biology. 2010;11:46. doi: 10.1186/1471-2121-11-46. [DOI] [PMC free article] [PubMed] [Google Scholar]
- 17.Simonsen JL, Rosada C, Serakinci N, Justesen J, Stenderup K, Rattan SI, et al. Telomerase expression extends the proliferative life-span and maintains the osteogenic potential of human bone marrow stromal cells. Nature Biotechnology. 2002;20:592–596. doi: 10.1038/nbt0602-592. [DOI] [PubMed] [Google Scholar]
- 18.Abdallah BM, Haack-Sorensen M, Burns JS, Elsnab B, Jakob F, Hokland P, et al. Maintenance of differentiation potential of human bone marrow mesenchymal stem cells immortalized by human telomerase reverse transcriptase gene despite [corrected] extensive proliferation. Biochemical and Biophysical Research Communications. 2005;326:527–538. doi: 10.1016/j.bbrc.2004.11.059. [DOI] [PubMed] [Google Scholar]
- 19.Dominici M, Le Blanc K, Mueller I, Slaper-Cortenbach I, Marini F, Krause D, et al. Minimal criteria for defining multipotent mesenchymal stromal cells. The International Society for Cellular Therapy position statement. Cytotherapy. 2006;8:315–317. doi: 10.1080/14653240600855905. [DOI] [PubMed] [Google Scholar]
- 20.Kern S, Eichler H, Stoeve J, Kluter H, Bieback K. Comparative analysis of mesenchymal stem cells from bone marrow, umbilical cord blood, or adipose tissue. Stem Cells. 2006;24:1294–1301. doi: 10.1634/stemcells.2005-0342. [DOI] [PubMed] [Google Scholar]
- 21.Rojewski MT, Weber BM, Schrezenmeier H. Phenotypic characterization of mesenchymal stem cells from various tissues. Transfus Med Hemother. 2008;35:168–184. doi: 10.1159/000129013. [DOI] [PMC free article] [PubMed] [Google Scholar]
- 22.Crisan M, Yap S, Casteilla L, Chen CW, Corselli M, Park TS, et al. A perivascular origin for mesenchymal stem cells in multiple human organs. Cell Stem Cell. 2008;3:301–313. doi: 10.1016/j.stem.2008.07.003. [DOI] [PubMed] [Google Scholar]
- 23.Tormin A, Li O, Brune JC, Walsh S, Schutz B, Ehinger M, et al. CD146 expression on primary nonhematopoietic bone marrow stem cells is correlated with in situ localization. Blood. 2011;117:5067–5077. doi: 10.1182/blood-2010-08-304287. [DOI] [PMC free article] [PubMed] [Google Scholar]
- 24.Post S, Abdallah BM, Bentzon JF, Kassem M. Demonstration of the presence of independent pre-osteoblastic and pre-adipocytic cell populations in bone marrow-derived mesenchymal stem cells. Bone. 2008;43:32–39. doi: 10.1016/j.bone.2008.03.011. [DOI] [PubMed] [Google Scholar]
- 25.Larsen KH, Frederiksen CM, Burns JS, Abdallah BM, Kassem M. Identifying a molecular phenotype for bone marrow stromal cells with in vivo bone-forming capacity. Journal of Bone and Mineral Research. 2010;25:796–808. doi: 10.1359/jbmr.091018. [DOI] [PubMed] [Google Scholar]
- 26.Zhang X, Hirai M, Cantero S, Ciubotariu R, Dobrila L, Hirsh A, et al. Isolation and characterization of mesenchymal stem cells from human umbilical cord blood: reevaluation of critical factors for successful isolation and high ability to proliferate and differentiate to chondrocytes as compared to mesenchymal stem cells from bone marrow and adipose tissue. Journal of Cellular Biochemistry. 2011;112:1206–1218. doi: 10.1002/jcb.23042. [DOI] [PubMed] [Google Scholar]
- 27.Charbord P, Livne E, Gross G, Haupl T, Neves NM, Marie P, et al. Human bone marrow mesenchymal stem cells: a systematic reappraisal via the genostem experience. Stem Cell Reviews. 2011;7:32–42. doi: 10.1007/s12015-010-9125-6. [DOI] [PMC free article] [PubMed] [Google Scholar]
- 28.Satomura K, Krebsbach P, Bianco P, Gehron Robey P. Osteogenic imprinting upstream of marrow stromal cell differentiation. Journal of Cellular Biochemistry. 2000;78:391–403. doi: 10.1002/1097-4644(20000901)78:3<391::AID-JCB5>3.0.CO;2-E. [DOI] [PubMed] [Google Scholar]
- 29.Jozefczuk J, Prigione A, Chavez L, Adjaye J. Comparative analysis of human embryonic stem cell and induced pluripotent stem cell-derived hepatocyte-like cells reveals current drawbacks and possible strategies for improved differentiation. Stem Cells and Development. 2011;20:1259–1275. doi: 10.1089/scd.2010.0361. [DOI] [PubMed] [Google Scholar]
Associated Data
This section collects any data citations, data availability statements, or supplementary materials included in this article.
Supplementary Materials
Morphological characteristics of hMSC-TERT, hATSCs, hASSCs and hNSSCs. The human bone marrow stromal (mesenchymal) stem cells (hMSC) immortalized with human telomerase reverse transcriptase gene (hMSC-TERT) and stromal cells isolated from adipose tissue (hATSCs), adult dermal skin (hASSCs) and neonatal foreskin (hNSSCs) cells were cultured using plastic adherence and examined by phase contrast microscopy (bar = 200 μm). (JPEG 347 kb)
Colony forming Unit-fibroblast (CFU-F) formation. Stromal cells isolated from adipose tissue (hATSCs) (a), adult dermal skin (hASSCs) (b) and neonatal foreskin (hNSSCs) (c) were cultured using plastic adherence for 15 days. Colonies were defined as a well-defined group of cells (>40 cells). The number of colonies were determined manually (d). (JPEG 173 kb)
Staining for osteoblast with alkaline phosphatase. The human bone marrow stromal (mesenchymal) stem cells (hMSC) immortalized with human telomerase reverse transcriptase gene (hMSC-TERT) and stromal cells isolated from adipose tissue (hATSCs), adult dermal skin (hASSCs) and neonatal foreskin (hNSSCs) cells were cultured using plastic adherence and in the presence of osteoblast differentiation medium (OB differentiated) or under control conditions (control). Osteoblastic cells were visualized by positive staining for alkaline phosphatase (bar = 200 μm). (JPEG 74 kb)
Staining for adipocytes with Oil red O. The human bone marrow stromal (mesenchymal) stem cells (hMSC) immortalized with human telomerase reverse transcriptase gene (hMSC-TERT) and stromal cells isolated from adipose tissue (hATSCs), adult dermal skin (hASSCs) and neonatal foreskin (hNSSCs) cells were cultured using plastic adherence and in the presence of adipocyte induction medium (AD differentiated) or under control conditions (control). Adipocyte differentiated was demonstrated by staining with Oil red O (bar = 200 μm). (JPEG 99 kb)
Microarray-based analysis of hMSC-TERT, hATSCs, hASSCs and hNSSCs. The human bone marrow stromal (mesenchymal) stem cells (hMSC) immortalized with human telomerase reverse transcriptase gene (hMSC-TERT) and stromal cells isolated from adipose tissue (hATSCs), adult dermal skin (hASSCs) and neonatal foreskin (hNSSCs) cells were cultured through plastic adherence. RNA was isolated from (hMSC-TERT) and stromal cells derived from adipose tissue (hATSCs), adult dermal skin (hASSCs) and neonatal foreskin (hNSSCs) cells were subjected to microarray analysis. Additionally, we included normal primary bone marrow hMSC isolated by Stro-1 antibody immune magenetic panning (hMSC-STRO basal) and two commercial fibroblastic cell lines: neonatal foreskin fibroblasts BJ and HFF1. (A, B) Hierarchical clustering of the distinct cell populations. (C) Table showing correlation co-efficients-R2 between the different cell populations. (JPEG 158 kb)
Transcriptional similarity between hMSC-TERT and hMSC-STRO+ basal. The molecular phenotype of the human bone marrow stromal (mesenchymal) stem cells (hMSC) immortalized with human telomerase reverse transcriptase gene (hMSC-TERT) was compared to normal primary bone marrow hMSC isolated by Stro-1 antibody (hMSC-STRO). Venn diagram showing the distinct and overlapping gene signatures of hMSC-TERT and hMSC-STRO. The majority of transcripts were common to both cell types (6895 corresponding to 83 % of the total). (JPEG 29 kb)
Mean levels of stromal cells-associated, hematopoietic and endothelial markers expression on different cell population. (DOC 38 kb)
Spreadsheet 1: List of genes specific for hMSC-TERT. Spreadsheet 2: List of genes specific for hNSSCs. Spreadsheet 3: List of genes specific for hASSCs. Spreadsheet 4: List of genes specific for hATSCs. Spreadsheet 5: List of genes in common between hMSC-TERT and hNSSCs. Spreadsheet 6: List of genes in common between hMSC-TERT and hASSCs. Spreadsheet 7: List of genes in common between hMSC-TERT and hATSCs. Spreadsheet 8: List of genes in common between all samples expect for hATSCs. Spreadsheet 9: List of genes in common between all samples (XLS 397 kb)