

Abstract
Dissecting the genetic basis for the evolution of species differences requires a combination of phylogenetic and molecular genetic perspectives. By mapping the genetic changes and their phenotypic effects onto the phylogeny, it is possible to distinguish changes that may have been directly responsible for a new character state from those that fine tune the transition. Here, we use phylogenetic and functional methods to trace the evolution of substrate specificity in dihydroflavonol-4-reductase (Dfr), an anthocyanin pathway gene known to be involved in the transition from blue to red flowers in Iochroma. Ancestral state reconstruction indicates that three substitutions occurred during the flower color transition, whereas several additional substitutions followed the transition. Comparisons of enzymatic function between ancestral proteins in blue- and red-flowered lineages and proteins from present-day taxa demonstrate that evolution of specificity for red pigment precursors was caused by the first three substitutions, which were fixed by positive selection and which differ from previously documented mutations affecting specificity. Two inferred substitutions subsequent to the initial flower color transition were also adaptive and resulted in an additional increase in specificity for red precursors. Epistatic interactions among both sets of substitutions may have limited the order of substitutions along branches of the phylogeny leading from blue-pigmented ancestors to the present-day red-flowered taxa. These results suggest that the species differences in DFR specificity may arise by a combination of selection on flower color and selection for improved pathway efficiency but that the exact series of genetic changes resulting in the evolution of specificity is likely to be highly contingent on the starting state.
Keywords: ancestral state reconstruction, anthocyanins, dihydroflavonol-4-reductase, flower color, Iochroma
Introduction
Elucidating the genetic basis of adaptive divergence across species requires connecting phenotypic evolution to differences in gene regulation and function, and ultimately, to individual nucleotide substitutions. Knowledge of the specific contributions of individual nucleotides is necessary, for example, to determine whether new phenotypes can arise by a single mutation (Newcomb et al. 1997; Hoballah et al. 2007) or require multiple substitutions (Peichel et al. 2001; Steiner et al. 2008). These mutations may act additively, following the classic Fisherian model of adaptation (Fisher 1930), or may interact with each other epistatically, that is, may result in different effects depending on the state of other sites (Lynch and Walsh 1998; Phillips 2008). Epistatic interactions can have important consequences for shaping evolutionary trajectories (Whitlock et al. 1995; Ostman et al. 2012). For example, negative epistasis, a commonly observed pattern in which one mutation reduces the phenotypic effect of other mutations, helps to explain diminishing rates of adaptation over time in response to selection (Chou et al. 2011; Khan et al. 2011; Rokyta et al. 2011). In addition to affecting rates of adaptation, epistatic interactions can constrain the specific pathways accessible via selection. In particular, sign epistasis, in which the effect of mutation can be positive or negative depending on other mutations present, has been shown to limit the order of mutations during evolutionary transitions (Weinreich et al. 2005). Although several experimental evolution studies have documented sign epistasis for mutations within a single gene and for multiple loci (Weinreich et al. 2006; Kvitek and Sherlock 2011), this form of epistasis may be less common than magnitude (positive or negative) epistasis (Betancourt 2010; Khan et al. 2011). Beyond experimental studies in microbial and viral systems, an alternative approach to understanding the evolutionary importance of sign epistasis is the use of phylogenetic and functional methods to trace the order and effects of substitutions fixed during an adaptive transition and compare the inferred pathway with other possible trajectories (Dean and Thornton 2007). Although this approach has been employed in only a handful of studies of physiological traits, the results implicate a major role for sign epistasis in constraining the evolution of protein function (Ortlund et al. 2007; Bridgham et al. 2009).
Here, we apply phylogenetic and functional methods to examine the history of protein evolution and the prevalence of epistatic interactions during an evolutionary transition in an ecologically important morphological trait, flower color. Our previous studies documented the genetic basis for the evolution of red flowers from a blue ancestral state in the Andean genus Iochroma (Solanaceae) via changes in the anthocyanin pathway, part of the larger flavonoid biosynthetic pathway. In Iochroma, as well as in many other flowering plant clades, blue flowers produce blue delphinidin-derived anthocyanin pigments, whereas red flowers produce red pelargonidin-derived anthocyanins (fig. 1). From an analysis of reciprocal backcrosses between a blue species (Iochroma cyaneum) and a red species (I. gesnerioides), we demonstrated that the flower color difference was due to three genetic changes in the anthocyanin pathway: the downregulation of flavonoid-3’ hydroxylase (F3’h), the deletional inactivation of flavonoid 3’5’ hydroxylase (F3’5’h), and changes in the coding sequence of dihydroflavonol-4-reductase (Dfr) (fig. 1). These coding sequence differences at Dfr have clear functional consequences as the Dfr copies from the two species have markedly different substrate specificities (Smith and Rausher 2011). The copy from the red-flowered I. gesnerioides has significantly greater activity on dihydrokaempferol (DHK), the precursor of red pelargonidin pigments, and weak activity on the blue and purple pigment precursors, dihydromyricetin (DHM) and dihydroquercetin (DHQ). Conversely, the copy from the blue-flowered I. cyaneum has greatest activity on DHM and DHQ and significantly lower activity on DHK.
Fig. 1.

Changes in the anthocyanin pathway responsible for the evolution of red flowers in Iochroma. Pathway enzymes (circled) include flavanone 3-hydroxylase (F3H), flavonoid 3’-hydroxylase (F3’H), flavonoid 3’,5’-hydroxylase (F3’5’H), dihydroflavonol reductase (DFR), and anthocyanidin synthase (ANS) (Holton and Cornish 1995). DFR converts dihydroflavonols (DHK, DHQ, and DHM) into leucoanthocyanidins (e.g., leucopelargonidin, LCP), which are subsequently modified to form three colored anthocyanidins (pelargonidin, cyanidin, and delphinidin). These three can be converted into other anthocyanidins (e.g., peonidin and malvidin; not shown). Finally, anthocyanidins are modified by the addition of sugars and other moieties to form anthocyanins. Three pathway changes were involved in the evolutionary transition from blue flowers with delphinidin-derived pigments to red flowers with pelargonidin-derived pigments: the deletion of the F3’5’h gene (indicated with the gray X), the downregulation of F3’h (indicated with the gray arrow), and a shift in DFR substrate specificity (indicated with the bold oval).
Although these previous studies show that the DFR substrate specificity contributes to the present-day difference in pigment production in the red- and blue-flowered species in Iochroma, it remains unclear whether changes at this locus were directly involved in the flower color transition. Although the changes at the two other loci (F3’h and F3’5’h) were necessary for the evolution of red flowers, the shift in DFR function was not (Smith and Rausher 2011). Specifically, the change in DFR substrate specificity would only cause a change in flower color if it occurred before changes at the other two loci. However, if the change at DFR arose after changes at the other loci, it would not have resulted in a change in flower color. In this case, the shift in substrate specificity could have been selected for improving pathway efficiency.
Distinguishing these two scenarios requires reconstructing the history of amino acid substitutions and functional evolution at the Dfr locus. Any substitutions that were directly involved in flower color evolution must map to the branch of the Iochroma phylogeny where the transition from blue to red flowers occurred and should show evidence of positive selection if they were adaptive due to their effects on flower color. Moreover, if their effect is mediated by a change in substrate specificity, we expect them to cause an increase in relative activity (RA) on red precursors relative to the ancestral state. By contrast, adaptive substitutions that occur after the appearance of red flowers (and necessarily after the changes at F3’h and F3’5’h) are most likely to have been selected for improved efficiency of the pigment pathway. These would similarly be expected to improve RA on the precursors of red pigments. Substitutions that occurred before the flower color transition may have been selected due to advantageous pleiotropic effects on flavonoid composition, but they would not be implicated in origin of red flowers.
In this study, we combine ancestral state reconstruction and in vitro assays of enzyme function to trace the history of DFR evolution during the transition from blue to red flowers in Iochroma. Given that the functionally distinct Dfr copies from I. cyaneum and I. gesnerioides differ by 12 amino acids (Smith and Rausher 2011), this phylogenetic approach will allow us to distinguish which of these substitutions may have played a role in flower color evolution. Specifically, we aim to address the following questions: 1) Which Dfr mutations coincide with the flower color transition (i.e., map to the branch of the phylogeny where flower color changed) and which occurred subsequent to the transition (i.e., are within red-flowered lineages)? 2) Which, if any, of these mutations were subject to positive selection? 3) Of those subject to positive selection, are they associated with detectable differences in substrate specificity? 4) Do selected mutations with functional effects show epistatic interactions with respect to substrate specificity? Functionally significant mutations that occurred during the transition and that were positively selected become candidates for causing the flower color change, whereas those that were fixed following the transition point to alternative selective forces acting on DFR function. Significant epistatic interactions among these functional mutations would imply that certain mutational pathways may be favored during the evolution of substrate specificity in DFR.
Materials and Methods
Taxon Sampling and Data Collection
For ancestral state reconstruction and analyses of molecular evolution, we examined the Dfr sequence in the two red-flowered, pelargonidin-producing species of Iochroma (I. gesnerioides and I. fuchsioides) and their blue-flowered, delphinidin-producing sister species (I. baumii and I. calycinum) (Smith and Baum 2006). We sampled six additional species in the subtribe Iochrominae, representing each of the major clades (supplementary table S1, Supplementary Material online). Two of these species (I. loxense and D. solanacea) do not produce anthocyanin pigments in their corollas but are likely to have maintained DFR for producing pigments in other tissues. We also included six other Solanaceae, spanning both close and distant relatives of Iochrominae (Olmstead et al. 1999, 2008). Finally, as outgroup taxa, we added Dfr sequences from Evolvulus (in the sister family, Convolvulaceae) and from Gentiana, a more distantly related member of the Asterids (Bremer et al. 2002).
Full coding sequences of the single-copy Dfr were amplified from floral bud cDNA or genomic DNA from each sampled species of Iochrominae following Smith and Rausher (2011). Two Iochrominae-specific primers (DFR73F 5’-TCTGAAAATGGCAAGTGAAG and DFR1275R 5’-GAAGCAAACATTATCGCTAGGCAAGCT) were used for amplification, and two additional primers (DFR570F 5’-GCTAAGAAGATGACAGGATGG and DFR778R 5’-GKGGRAAYGTAGGTGTGATGA) were used in sequencing. Primer numbers refer to their position in Petunia hybrida Dfr (Genbank X15537). Polymerase chain reaction products were cloned using the pGEM-T Easy vector system (Promega, Madison, WI), and eight clones were sequenced per product. Distinct alleles recovered from heterozygous individuals during the cloning were retained in the data set for downstream analyses (supplementary table S1, Supplementary Material online).
Ancestral State Reconstruction
The evolution of the DFR protein in Iochroma was reconstructed using the codeml program in PAML 4.2b (Yang 2007). We specifically aimed to infer the amino acid sequence of the most recent common ancestor of the blue and red Iochroma (Blue Ancestor in fig. 2C) and the common ancestor of the two red species, I. gesnerioides and I. fuchsioides (Red Ancestor in fig. 2C). The change in flower color is inferred to have occurred between these two nodes of the tree, and thus, any sequence differences between these nodes could be involved in the color transition. The JTT + G model of amino acid evolution (Jones et al. 1992) was applied to estimate ancestral sequences using two phylogenies: the species phylogeny from the literature based on multiple plastid and nuclear markers (Smith and Baum 2006; Olmstead et al. 2008) and the maximum likelihood Dfr gene tree, inferred with a GTR + Γ + I model of evolution in RAxML 7.04 (Stamatakis 2006). We also examined the credibility of the relationships in the Dfr tree using a Bayesian analysis, run with the same model of evolution in MrBayes 3.1.2 (Ronquist and Huelsenbeck 2003) with 2 million generations, where convergence was reached after 200,000 generations as judged by average standard deviation of split frequencies less than 0.01. The topologies from maximum likelihood gene tree and species tree were very similar, both showing the red-flowered clade of I. fuchsioides and I. gesnerioides as sister to two blue-flowered species, I. baumii and I. calycinum with high posterior probability (PP; fig. 2A). However, in the Dfr gene tree, one of the I. fuchsioides alleles appears more closely related to I. gesnerioides (supplementary fig. S1, Supplementary Material online). The full Dfr sequence alignment and the two phylogenies are available through Treebase.org (Study No. 11848).
Fig. 2.

DFR sequence evolution in Iochroma. (A) Maximum likelihood phylogeny of Dfr. Taxon sampling within Iochrominae includes eight Iochroma species (I.) and two species of Dunalia (D.); two outgroups (Evolvulus and Gentiana) have been pruned. Also, one of the two alleles was randomly pruned from heterozygous individuals (supplementary table S1, Supplementary Material online). Red-flowered species and lineages are in bold. Branches with greater than 95% PP are indicated with an asterisk. (B) Structure of DFR protein, with numbering based on Vitis vinifera (Petit et al. 2007). Sites important for substrate binding based on the V. vinifera crystal structure are indicated with an asterisk along the top. The shaded region (positions 131 − 156) is an area thought to be important for substrate specificity (Johnson et al. 2001). Locations of mutations involved in the evolution of substrate specificity in Iochroma are shown with arrows below. (C) A reduced phylogeny showing the evolution of substrate specificity in the red-flowered lineages. Pie charts indicate the relative activity of each present-day or ancestral protein sequence on the three substrates (DHM, DHQ, and DHK, fig. 1). The most recent common ancestor of the red- and blue-flowered species (Blue Ancestor, BA) and the common ancestor of the red-flowered species (Red Ancestor, RA) are labeled. The five amino acid substitutions between the Blue Ancestor and red-flowered Iochroma gesnerioides lineage are shown with single-letter abbreviations and their position in the sequence (substitutions along other branches of the tree are not listed). The corresponding positions in V. vinifera (Vv) are also noted in parentheses.
To relate differences between the blue ancestral sequences and red derived sequences to the DFR molecule, we mapped the inferred substitutions to the crystal structure from Vitis (Petit et al. 2007). The structure was downloaded from www.pdb.org and viewed with Swiss-PdbViewer v.4.04 (Guex and Peitsch 1997). The position of each substitution in Iochroma DFR was identified by alignment to the Vitis protein sequences.
Tests for Selection
Codon-based maximum likelihood methods, implemented in PAML 4.2b (Yang 2007), were used to test for evidence of positive selection on DFR and in particular along the branches leading to the red-flowered species. These methods estimate the ratio of nonsynonymous to synonymous substitution rates (dN/dS or ω) as a measure of selection where values of 1 indicate neutral evolution, less than 1 indicate purifying selection, and greater than 1 indicates positive selection. To determine whether changes in DFR were positively selected during the color transition, we used two sets of models: branch based and branch-site based. In the first branch based set, we compared model L0, in which all lineages share a single value for ω, to model L1, in which the value of ω is allowed to differ between the background (blue pigmented) and foreground (red pigmented) branches (Yang 1998).
Next, to identify sites in the foreground branches potentially under positive selection, we compared two branch-site models, model A and a null model (Yang and Nielsen 2002). The positive-selection model (model A) has four classes of sites: site class “0” where sites are constrained (ω < 1) across all branches, site class “1” where sites are evolving neutrally across all branches (ω = 1), site class “2a” where sites are constrained in the background but positively selected (ω > 1) in the foreground, and site class “2b” where sites are neutral in the background but positively selected in the foreground. The null model comprises the same four classes but restricts ω to 1 in the foreground branches for the last two site classes (2a and 2b). In both cases, PAML provides maximum likelihood estimates for the proportion of sites falling into each of the classes and the values for ω (unless fixed to 1).
All model comparisons in PAML were carried out on both 18-taxon phylogenies (the species tree and the maximum likelihood Dfr gene tree). However, as both gave nearly identical results in terms of estimates of ω, levels of significance for likelihood ratio tests, and posterior probabilities for selected sites, only the results with the species tree are presented below.
Site-Directed Mutagenesis and Enzyme Assays
To examine the effects of the inferred substitutions on enzyme function, we used site-directed mutagenesis to generate Dfr alleles corresponding to ancestral sequences. Specifically, we created sequences for the Blue and Red ancestors by introducing mutations into the red I. gesnerioides sequence. These ancestral sequences were unambiguously reconstructed from present-day taxa (supplementary fig. S1, Supplementary Material online). In addition, we created all six possible intermediate sequences involving the three mutations (M1–M3) that occur on the branch from the Blue ancestor to the Red ancestor, as well as the two possible intermediate sequences involving the two mutations (M4 and M5) that distinguish the Red ancestor from I. gesnerioides. This set of mutated sequences is described in supplementary table S2, Supplementary Material online. Mutagenesis was performed with the GeneTailor site-directed mutagenesis system (Invitrogen, Carlsbad, CA). Resulting alleles were recombined into the pDEST 14 expression vector (Invitrogen).
To assay enzyme activity, the expression vector containing a particular Dfr sequence was transformed into BL21 Star (DE3) Escherichia coli cells (Invitrogen), and the protein was expressed and harvested as described previously (Smith and Rausher 2011). For each assay, 375 μl of the enzyme suspension was divided equally among into three separate reactions, one for each substrate (DHK, DHQ, and DHM, fig. 1). Each 0.5 ml reaction contained 0.5 μmol substrate along with buffer and cofactors following Stafford and Lester (1982). Substrates were obtained from TransMIT (Marburg, Germany), Sigma (St. Louis, MO), and Apin Chemicals (Abingdon, UK), respectively. Raw activity was measured as μmoles product produced. For analysis, these values were converted to RA by dividing each value by the sum of the values for the three substrates. High RA on one particular substrate indicates high specificity for that substrate, whereas equal RA on all three substrates indicates low substrate specificity. Three full replicates (i.e., resulting from three separate expression reactions) were run for each Dfr sequence.
Statistical Analyses
Differences in RA across sequences were tested by analysis of variance using the GLM procedure in SAS version 9.2 (SAS Institute, Inc., Cary, NC). Contrast statements were used to test for differences between specific sequences. The Wilk’s λ statistic and its F approximation were used for evaluation of statistical significance in the multivariate case. We also used univariate analyses to compare RA on each substrate. For these analyses, probability levels associated with F values were adjusted using a Bonferroni correction by dividing the significance criterion by the total number of univariate effects evaluated in an analysis. All RA values were arcsin-square root transformed for analyses of statistical significance but not when estimating activity means or differences.
Results
Ancestral State Reconstruction
We applied maximum likelihood ancestral state reconstruction methods to infer the series of amino acid substitutions that occurred during the transition from blue to red flowers in Iochroma. Codon-based reconstructions indicated that three substitutions (M1–M3) occurred along the branch leading from the Blue Ancestor to the Red Ancestor (fig. 2C). All three substitutions were estimated with 100% PP, regardless of whether the species tree or the gene tree was used (supplementary fig. S1, Supplementary Material online). An additional pair of substitutions (M4 and M5) was inferred along the branch leading from the Red Ancestor to I. gesnerioides (fig. 2C). Any of these substitutions, unique to the red-flowered lineage, may have contributed to the previously documented difference in substrate specificity between blue and red Iochroma species. Mapping these substitutions to the DFR crystal structure from Vitis indicated that four of the five substitutions (M1–M4) occurred near the active site of the enzyme (supplementary fig. S2, Supplementary Material online), and one of them (M2) corresponds directly to a residue in Vitis (227) that binds to the region of the substrate which distinguishes DHK from DHM and DHQ. The final mutation (M5) is located in a highly variable region near the C-terminus, distant from the active site (fig. 2B, supplementary fig. S2, Supplementary Material online).
Analysis of Positive Selection
Maximum likelihood methods were also used to test whether the mutations in DFR were fixed by positive selection during and following the transition to red flowers. We first compared two branch-based models, model L0 with a single ω and model L1 with two different ω values for the blue and red branches of the phylogeny (bold branches in fig. 2A and C). Model L0 estimated a ω of 0.184 across all the branches, indicating an overall pattern of purifying selection on DFR (table 1). However, model L1 had a significantly higher likelihood than model L0, suggesting that ω differs between the background (blue) lineages and the foreground (red) lineages. Although there was purifying selection on the background branches (ω = 0.178), there was strong positive selection on the foreground branches (ω = ∞, due to the absence of synonymous substitutions on these branches) in model L1.
Table 1.
Maximum Likelihood Tests for Positive Selection on DFR.
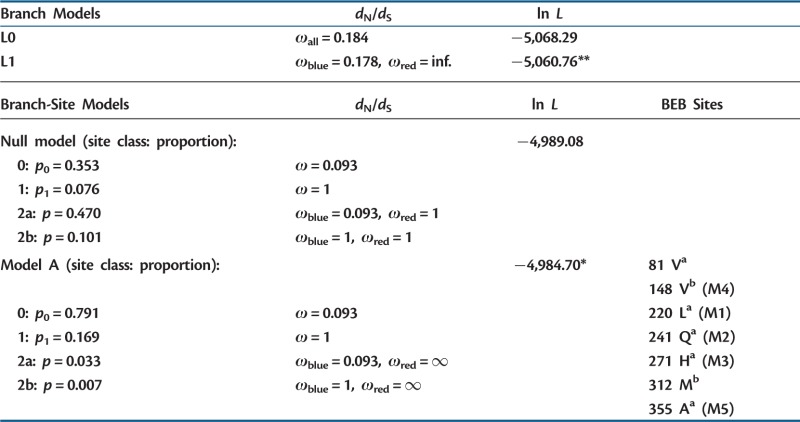 |
Note.—Models are described in the text. Likelihood values were compared with a likelihood ratio test with one degree of freedom (Yang 1998; Yang and Nielsen 2002). When the BEB sites (listed as position and single letter amino acid code) correspond to mutations investigated functionally, the mutation number is given in parentheses. The species tree was used as the phylogeny in all tests.
Sites inferred to be under positive selection (Bayes Empirical Bayes or BEB sites) are listed with a and b indicating greater than 99% and 95% PP, respectively.
*P value < 0.01.
**P value < 0.001.
We also employed branch-site models to determine which, if any, of the mutations along the red-flowered lineages were under positive selection. We compared two branch-site models, model A and the null model (Yang and Nielsen 2002). Both allow sites to vary between the foreground and background branches although only model A allows for some sites to experience positive selection in the foreground (red) branches. Model A resulted in a significantly higher likelihood (table 1), suggesting that a subset of sites is under positive selection in the red-flowered lineages. Moreover, the Bayesian estimation of positively selected sites (with ω > 1) included all three of the sites that exhibited amino-acid substitutions (M1–M3) associated with the change in substrate specificity and the two changes (M4 and M5) specific to the I. gesnerioides lineage. These analyses indicate that the five substitutions are likely to reflect adaptations associated with the transition from a DFR enzyme that was specialized on the substrate DHM, the precursor of blue delphinidin pigments, to one that is specialized on DHK, the precursor of red pelargonidin pigments. The two additional sites identified as having moderate to strong evidence of positive selection (81 V and 312 M, table 1) reflect substitutions along red-flowered I. fuchsioides lineage (supplementary fig. S1, Supplementary Material online), which may have similarly brought about additional improvement in activity on DHK as observed with I. gesnerioides (see later).
Changes in Substrate Specificity
The finding that all five amino acid substitutions M1–M5 were fixed by positive selection implies that each substitution had an effect on enzyme function. An analysis of variance of RA on the three substrates supports this inference. We first performed a factorial multivariate analysis of variance with mutations M1–M3 that occurred along the branch from the Blue Ancestor to the Red Ancestor as the factors to test the significance of their effects on RA (supplementary table S3, Supplementary Material online). In this analysis, the main effects of all three mutations were highly significant (table 2), indicating that each mutation affected RA. In addition, all two-way, as well as the three-way, interactions were highly significant, indicating that the effects of each of these mutations on substrate specificity are epistatic. Examination of RA on particular substrates suggests that there is sign epistasis of the type that could restrict the order in which these mutations accumulated (fig. 3). For example, mutation M2 increases RA on DHK if it occurs first but decreases RA if mutation M1 occurs before it (fig. 3A). Similarly, M3 decreases RA on DHM if it occurs first but increases it if it occurs after M1. Despite this epistasis, there is at least one sequence of substitutions (M3 followed by M1 followed by M2) in which the RA on DHK increases significantly with each substitution (fig. 3A and supplementary table S4A, Supplementary Material online), as would be expected if each substitution contributes to a gradual shift to specialization on that substrate.
Table 2.
Analysis of Variance for Effects of Mutations on RA of DFR on Different Substrates.
| Source | Multivariate Analysis | Univariate Analysis |
||||||||||
|---|---|---|---|---|---|---|---|---|---|---|---|---|
| DHK |
DHQ |
DHM |
||||||||||
| Wilks’ λ | F | P | F | P | B | F | P | B | F | P | B | |
| Mutations M1–M3 occurring between the Blue Ancestor and the Red Ancestor (A) | ||||||||||||
| M1 | 0.0532 | 83.03 | <0.0001 | 231.20 | <0.0001 | ** | 7.48 | 0.0147 | 127.51 | <0.0001 | ** | |
| M2 | 0.0218 | 209.15 | <0.0001 | 255.50 | <0.0001 | ** | 150.57 | <0.0001 | ** | 0.48 | 0.4976 | |
| M3 | 0.1686 | 23.01 | <0.0001 | 21.49 | 0.0003 | ** | 31.62 | <0.0001 | ** | 0.014 | 0.716 | |
| M1 × M2 | 0.0567 | 77.60 | <0.0001 | 227.70 | <0.0001 | ** | 9.91 | 0.0062 | 118.74 | <0.0001 | ** | |
| M1 × M3 | 0.1635 | 23.88 | <0.0001 | 57.14 | <0.0001 | ** | 6.12 | 0.025 | 17.96 | 0.0006 | * | |
| M2 × M3 | 0.1806 | 21.18 | <0.0001 | 0.07 | 0.7898 | 13.52 | 0.002 | * | 9.32 | 0.0076 | ||
| M1 × M2 × M3 | 0.1092 | 38.08 | <0.0001 | 88.47 | <0.0001 | ** | 6.37 | 0.0226 | 33.78 | <0.0001 | ** | |
| Mutations M4 and M5 occurring between the Red Ancestor and I. gesnerioides (B) | ||||||||||||
| M4 | 0.2117 | 13.03 | 0.0044 | 25.56 | 0.001 | * | 24.25 | 0.0012 | * | 2.4 | 0.1559 | |
| M5 | 0.2186 | 12.51 | 0.0049 | 8.14 | 0.0214 | 2.02 | 0.1926 | 28.24 | 0.0007 | ** | ||
| M4 × M5 | 0.3481 | 6.55 | 0.0249 | 13.32 | 0.0065 | 2.26 | 0.1708 | 10.79 | 0.0111 | |||
Note.—The multivariate analysis considers all three substrates together, whereas the univariate analysis considers each individually. F is the F-statistic. For multivariate analyses, degrees of freedom are 3 and 14 for (A) and 2 and 7 for (B). For univariate analyses, numerator df are 1 for all effects, whereas denominator df are 16 and 11 for (A) and (B), respectively. P is the nominal significance level associated with the effect.
B is the significance level adjusted by Bonferroni correction: *P < 0.05, **P < 0.01.
Fig. 3.

Relative activities of DFR on the three substrates for different combinations of mutations. 0 indicates mutation absent, 1 indicates mutation present. (A) Relative activity on DHM, DHQ, and DHK for combinations of mutations M1–M3. (0,0,0) corresponds to Blue Ancestor (BA) sequence and (1,1,1) corresponds to the Red Ancestor (RA) sequence. Moving from (0,0,0) to (1,1,1), solid gray lines indicate a significant increase in relative activity on DHK based on the ANOVA results (supplementary table S4, Supplementary Material online). Dashed black lines indicate a significant decrease in DHK activity, whereas dashed gray lines indicate a nonsignificant change in DHK activity. Each pie graph shows the relative activity for a given DFR sequence on each of the three pigment precursors (DHM, DHQ, and DHK). Values are based on least square means from analyses of variance; the value for relative activity on DHK is given inside each pie chart. (B) Relative activity for combinations of mutations M4 and M5. Interpretation of lines, pie graphs, and values as in (A).
A similar pattern was exhibited by the two mutations (M4 and M5) that occurred on the branch from the Red Ancestor to I. gesnerioides. Both mutations showed significant main effects and individually resulted in increases in RA on DHK relative to the Red Ancestor background (table 2). Unlike mutations M1–M3, however, once either M4 or M5 were fixed, the other had no detectable effect on RA on any of the substrates (fig. 3B, supplementary table S4B, Supplementary Material online). Thus, neither order of substitutions (M4 then M5 or M5 then M4) would result in a stepwise increase in RA on DHK.
By comparing the relative activities of the Blue Ancestor, Red Ancestor, and I. gesnerioides copies of Dfr, the proportion of the total shift in substrate specificity that occurred from the Blue Ancestor to I. gesnerioides can be partitioned into two parts: one corresponding to the branch from Blue Ancestor to Red Ancestor and the other corresponding to the branch from Red Ancestor to I. gesnerioides (table 3). The substitutions along the first branch caused a significant increase in RA on DHK of 0.330 and significant decreases in RA on DHQ and DHM of 0.123 and 0.206, respectively. The substitutions along the second branch cause a further significant increase in RA on DHK of 0.0715 and a significant decrease in RA on DHM of 0.0465. Thus, the proportional increases in RA on DHK for the first and second branches, respectively, were 0.822 and 0.178, whereas the proportional decreases in RA on DHM were 0.816 and 0.184, respectively. In other words, the three substitutions along the branch from the Blue Ancestor to the Red Ancestor accounted for approximately 82% of the overall change in substrate specificity, whereas the remainder took place after the flower color transition.
Table 3.
Changes in DFR RA between Nodes on the Iochroma Phylogeny.
| Comparison | Multivariate Analysis | Univariate Analyses |
||||||||||||||
|---|---|---|---|---|---|---|---|---|---|---|---|---|---|---|---|---|
| DHK |
DHQ |
DHM |
||||||||||||||
| Wilks λ | F(3,8) | P | B | Effect | F(1,11) | P | B | Effect | F(1,11) | P | B | Effect | F(1,11) | P | B | |
| Red Ancestor vs. I. gesnerioides | 0.1372 | 16.76 | 0.0008 | ** | 0.0715 | 15.84 | 0.0026 | * | −0.0251 | 4.89 | 0.0515 | −0.0465 | 24.72 | 0.0006 | ** | |
| Blue Ancestor vs. Red Ancestor | 0.0224 | 116.28 | <0.0001 | *** | 0.3296 | 336.84 | <0.0001 | ** | −0.1232 | 97.86 | <0.0001 | ** | −0.2063 | 322.65 | <0.0001 | ** |
| Blue Ancestor vs. I. cyaneum | 0.2073 | 10.19 | 0.0042 | * | −0.0542 | 12.08 | 0.0060 | −0.0001 | 0.00 | 0.9945 | 0.0543 | 17.83 | 0.0018 | * | ||
| Blue Ancestor vs. I. baumii | 0.8848 | 0.35 | 0.7925 | 0.0144 | 0.73 | 0.4120 | −0.0144 | 1.23 | 0.2930 | −0.0001 | 0.00 | 0.9954 | ||||
Note.—The nodes corresponding the Blue and Red Ancestors are shown in figure 2C. The overall multivariate effect of node: Wilks λ = 0.0024, F (9, 14.753) = 17.99, P < 0.0001. Univariate effect of node highly significant (P < 0.0001) for RA on each substrate. For each of the three substrates (DHK, DHQ, and DHM), “effect” is RA on the indicated substrate for the second node listed under “Comparison” minus RA for first node. F is the F-statistic with degrees of freedom indicated in parentheses.
B is the probability level after Bonferroni correction: *P < 0.05, **P < 0.01, and ***P < 0.001.
To determine whether changes in RA occurred along the blue-flowered branches (i.e., before the transition to red flowers), we also compared the Blue Ancestor with two present-day blue-flowered species, I. baumii and I. cyaneum. Although the I. baumii DFR differs from the Blue Ancestor in only one site (position 107, N to Y substitution), I. cyaneum differs from the Blue Ancestor in seven sites spread across the molecule (Smith and Rausher 2011). The I. baumii sequence did not differ from the Blue Ancestor in RA on any of the three substrates (table 3), indicating that no significant change in substrate specialization resulted from that single substitution. However, there was a significant difference in RA on DHM of approximately 5% between the Blue Ancestor and I. cyaneum (table 3), suggesting either a change in substrate specificity along the branch subtending the Blue Ancestor or along the branches leading to I. cyaneum.
Discussion
Adaptive Fixation of Dfr Substitutions
A previous analysis of the genetic differences underlying the difference in flower color between I. cyaneum and I. gesnerioides revealed that the evolutionary transition from blue to red flowers in the I. gesnerioides lineage was accompanied by a marked shift in the substrate specificity of the enzyme DFR (Smith and Rausher 2011). In the blue-flowered I. cyaneum, DFR exhibits highest substrate specificity for DHM, the precursor of the blue anthocyanins produced in the flowers. In the red-flowered I. gesnerioides, on the other hand, DFR exhibits high substrate specificity for DHK, the precursor of the red floral anthocyanins produced by this species (Smith and Rausher 2011). The results of this study indicate that this overall shift in substrate specificity was accomplished by the accumulation of five apparently adaptive amino acid substitutions. Three of these substitutions (M1–M3) fall on the branch of the phylogeny where the blue-to-red flower color transition occurred (fig. 2C). Each of the first three substitutions individually causes a demonstrable change in substrate specificity and a significant increase in RA on the red pigment precursor DHK in the Blue Ancestor genetic background (fig. 3 and supplementary table S4, Supplementary Material online). However, these individual effects are modified by strong epistatic interactions with the substitutions at other sites. All the three substitutions (M1–M3) exhibit negative epistasis, resulting in smaller increases in RA on DHK if following one of the other substitutions (fig. 3). Moreover, the M2 and M3 mutations show evidence of sign epistasis given that they are positive in the Blue Ancestor background but can decrease in RA on DHK if other mutations have already occurred. Despite the possible constraints imposed by these epistatic interactions, there is at least one order of substitutions among the six possible trajectories connecting the Blue Ancestor to Red Ancestor in which each substitution increases activity on DHK, as would be expected if there was continued selection for specialization on that substrate. These findings are consistent with results from experimental evolution in microbial systems, which highlight the importance of negative epistasis and sign epistasis in shaping evolutionary trajectories (e.g., Khan et al. 2011; Tenaillon et al. 2012).
Along the branch from the Red Ancestor to I. gesnerioides, both mutations (M4 and M5) also increase specialization on DHK if they occur first. However, as with the M1–M3 mutations, the fixation of the first substitution alters the effect of the second mutation. After the M4 mutation occurs, the M5 results in no significant increase in RA on DHK, and similarly the M4 mutation will have no effect after M5 has been fixed. One possible explanation for the presence of both substitutions in I. gesnerioides is that the second mutation was fixed by drift as opposed to selection, despite the results of the PAML analysis. Alternatively, it may have been fixed by selection for increased absolute activity on DHK, which in theory could occur if the mutation increases absolute activity on all substrates to the same degree. With current information, we cannot distinguish between these possibilities. Nevertheless, our results across the functional assays of M1–M5 are consistent with the fixation of at least four of the five mutations having been adaptive because they increased substrate specialization on DHK.
Selection for Effects on Flower Color versus Effects on Enzyme Efficiency
One of the objectives of this investigation was to determine whether any of these substitutions could be ascribed unambiguously to selection for increased substrate specialization as opposed to selection due to its effect on flower color. This appears to be the case for at least one of the substitutions, M4 or M5, along the branch from the Red Ancestor to I. gesnerioides. We infer from our previous work that the Red Ancestor produces only pelargonidin-derived anthocyanins in flowers because both of the red-flowered species, I. gesnerioides and I. fuchsioides, do so (Smith 2006). We showed previously that this change in pigmentation required inactivation of the enzyme F3’5’H and down-regulation of the enzyme F3’H. In the absence of these two enzymes, only pelargonidin can be produced because these enzymes are required for producing DHQ and DHM, the precursors of purple cyanidin and blue delphinidin pigments (fig. 1). Thus, any mutations affecting DFR substrate specificity that occur after the loss of F3’H and F3’5’H activity (i.e., after the Red Ancestor) would not affect flower color. Any selective advantage of increased specialization on DHK must therefore be due to some other advantageous effect. The most likely such effect would appear to be selection for increased efficiency or rate of metabolizing DHK to produce pelargonidin given that it is now the sole substrate for DFR. Indeed, the two mutations subsequent to the flower color transition (M4 and M5) result in a 12% increase in RA on DHK relative to the Red Ancestor and 18% of the total change in RA since the Blue Ancestor. Thus, a substantial proportion of the functional change in Dfr may represent fine tuning of the enzyme’s kinetic properties following the evolutionary transition in flower color.
The selective advantage of mutations M1–M3 remains unclear because we cannot with current information determine the order of substitution of these mutations relative to each other or relative to the changes involving F3’H and F3’5’H. If substitutions M1–M3 occurred before changes at the other two loci, they would have altered flower color from blue to purple (Smith and Rausher 2011) and may thus have been selected as part of the transition toward red floral pigmentation. On the other hand, if the M1–M3 mutations occurred after the changes at the other two loci, the same reasoning used above for M4 and M5 would indicate that their selective advantage was due to something other than their effects on flower color. Distinguishing between these alternatives may be possible by determining which orders of substitution are selectively impermissible, that is, which orders do not produce an increase in the absolute activity on the appropriate substrate at each substitution. However, this approach would require characterizing of the absolute activities of DFR in addition to the relative activities measured here.
Although the effects of amino acid substitutions along the lineage from the Blue Ancestor to I. gesnerioides are not unexpected, it is surprising that RA on blue pigment precursor DHM was significantly greater for DFR from the blue-flowered I. cyaneum than for the Blue Ancestor, given that both produce principally delphinidin-derived pigments. This difference in RA could reflect either a decrease in RA on DHM along the branch between the Blue Ancestor and the common ancestor of I. cyaneum and I. gesnerioides or an increase along the I. cyaneum branch. The former scenario would be difficult to explain given that F3’H and F3’5’H must be present and active in these blue-flowered lineages, and their activity would make DHM the principal pigment precursor available. The latter scenario suggests that instead the DFR from I. cyaneum has improved its activity on DHM since its divergence from the clade containing I. gesnerioides. This points to the intriguing possibility that despite the long history of producing blue flower pigments, dating back at least to the origin of Iochrominae (∼12 Ma, Paape et al. 2008), activity on DHM had not previously reach its optimum. If this possibility is correct, it may provide an example of the rate of adaptation being limited by the rate at which adaptive mutations are produced. However, additional studies would be required to test mutation limitation and other competing evolutionary hypotheses, such as adaptive conflict and loss of beneficial mutations via drift (Schultz and Lynch 1997; Des Marais and Rausher 2008).
Convergence in DFR Evolution at the Molecular Level
The ability to identify the molecular basis for phenotypic differences has made it possible to address the extent to which similar phenotypic transitions are caused by similar developmental and genetic changes (Arendt and Reznick 2008; Manceau et al. 2010). In some cases, convergent phenotypes in different populations or species have arisen by changes in the same genes (Protas et al. 2006; Chan et al. 2010) and even by the same nucleotide substitutions (Rompler et al. 2006). Previous studies of DFR function have suggested that there are two regions of the enzyme that are associated with changes in enzyme specificity and that evolutionary change in specificity may involve substitutions in either or both of these regions. The first region, comprising a cluster of 15–26 amino acids centered at position 140 (fig. 2B), was initially identified using comparative studies of DFR sequences from species that varied in the type of anthocyanin pigment produced, for example, pelargonidin, cyanidin, or delphinidin (Beld et al. 1989). Functional studies have confirmed the importance of this region, which appears to underlie differences in substrate specificity across angiosperms, from Zea mays, to Arabidopsis, to Ipomoea (Johnson et al. 2001; Halbwirth et al. 2003; Xie et al. 2004; Des Marais and Rausher 2008; Leonard et al. 2008). Moreover, substitutions at a single position in this region (133 in Vitis) are sufficient to shift preference from DHM and DHQ to DHK in Petunia (Johnson et al. 2001). Examination of the crystal structure of DFR for Vitis vinifera (with DHQ as the substrate) revealed that this site (133) and nearby positions closely interact with the B-ring hydroxyl groups of the substrates, consistent with the importance of this region in determining substrate preference (Petit et al. 2007).
The second region thought to be involved in substrate specificity in DFR is clustered around position 227 in Vitis. As with position 133, this site interacts with the B-ring hydroxyl groups that distinguish the three anthocyanidins (Petit et al. 2007). Functional studies in Rosaceae point to the importance of the nearby position 243, which together with a few C-terminus sites constitute the only candidates for differences in DFR specificity between Malus and Pyrus (Fischer et al. 2003). Together, these studies suggest a second, less well-defined region between Vitis positions 227 and 243 where substitutions are expected to alter substrate specificity.
In Iochroma, substitutions affecting substrate specificity occurred in both of these regions. Substitution M2 occurred in the second region at a position homologous to position 227 in Vitis, consistent with the close interaction between this site and B-ring hydroxyl groups (fig. 2B, supplementary fig. S2, Supplementary Material online). Among the five substitutions (M1–M5), this change resulted in the largest increase in activity on DHK and the largest effect on RA overall, relative to the Blue Ancestor (table 2 and fig. 3A). The M4 substitution, at Vitis position 134, falls within the first region reported to be important for DFR specificity. Given its close proximity to position 133, it is not surprising that M4 causes a significant change on substrate specificity. However, this mutation occurred after the flower color transition and after the major shift to DHK specificity.
Unlike M2 and M4, the remaining mutations (M1, M3, and M5) do not sit in either of the previously identified regions although, at least in Iochroma, they have strong effects on substrate specificity. Thus, it is clear that significant shifts in DFR specialization can occur without mutations in the regions that control substrate specificity in other taxa. Coupled with previous studies, this pattern indicates that the evolution of DFR specialization is not constrained to occur by substitutions at a single site or cluster of sites but may proceed via a range of trajectories. This diversity of pathways for evolving a similar function may not be surprising given that each functional substitution in DFR is likely to alter the effect of subsequent substitutions via epistatic interactions. The prevalence of epistasis among DFR mutations suggests that independent lineages of flowering plants will achieve convergent shifts in DFR function through a unique series of substitutions, contingent on their individual evolutionary history.
Supplementary Material
Supplementary figures S1 and S2 and tables S1–S4 are available at Molecular Biology and Evolution online (http://www.mbe.oxfordjournals.org/).
Acknowledgments
The authors thank members of the Rausher laboratory for constructive comments on the manuscript and Rechelle Tull for assistance with data collection. This work was supported by a National Institutes of Health NRSA fellowship (F32GM080082) to S.D.S. and by National Science Foundation Grants DEB-0448889 and DEB-0841521 to M.D.R.
References
- Arendt J, Reznick D. Convergence and parallelism reconsidered: what have we learned about the genetics of adaptation? Trends Ecol Evol. 2008;23:26–32. doi: 10.1016/j.tree.2007.09.011. [DOI] [PubMed] [Google Scholar]
- Beld M, Martin C, Huits H, Stuitje AR, Gerats AGM. Flavonoid synthesis in Petunia hybrida—partial characterization of dihydroflavonol-4-reductase genes. Plant Mol Biol. 1989;13:491–502. doi: 10.1007/BF00027309. [DOI] [PubMed] [Google Scholar]
- Betancourt A. Lack of evidence for sign epistasis between beneficial mutations in an RNA bacteriophage. J Mol Evol. 2010;71:437–443. doi: 10.1007/s00239-010-9397-0. [DOI] [PubMed] [Google Scholar]
- Bremer B, Bremer K, Heidari N, Erixon P, Olmstead RG, Anderberg AA, Kallersjo M, Barkhordarian E. Phylogenetics of asterids based on 3 coding and 3 non-coding chloroplast DNA markers and the utility of non-coding DNA at higher taxonomic levels. Mol Phylogenet Evol. 2002;24:274–301. doi: 10.1016/s1055-7903(02)00240-3. [DOI] [PubMed] [Google Scholar]
- Bridgham JT, Ortlund EA, Thornton JW. An epistatic ratchet constrains the direction of glucocorticoid receptor evolution. Nature. 2009;461:515–519. doi: 10.1038/nature08249. [DOI] [PMC free article] [PubMed] [Google Scholar]
- Chan YF, Marks ME, Jones FC, et al. (16 co-authors) Adaptive evolution of pelvic reduction in sticklebacks by recurrent deletion of a Pitx1 enhancer. Science. 2010;327:302–305. doi: 10.1126/science.1182213. [DOI] [PMC free article] [PubMed] [Google Scholar]
- Chou HH, Chiu HC, Delaney NF, Segre D, Marx CJ. Diminishing returns epistasis among beneficial mutations decelerates adaptation. Science. 2011;332:1190–1192. doi: 10.1126/science.1203799. [DOI] [PMC free article] [PubMed] [Google Scholar]
- Dean AM, Thornton JW. Mechanistic approaches to the study of evolution: the functional synthesis. Nat Rev Genet. 2007;8:675–688. doi: 10.1038/nrg2160. [DOI] [PMC free article] [PubMed] [Google Scholar]
- Des Marais DL, Rausher MD. Escape from adaptive conflict after duplication in an anthocyanin pathway gene. Nature. 2008;454:762–765. doi: 10.1038/nature07092. [DOI] [PubMed] [Google Scholar]
- Fisher RA. The genetical theory of natural selection. Oxford (UK): Oxford University Press; 1930. [Google Scholar]
- Fischer TC, Halbwirth H, Meisel B, Stich K, Forkmann G. Molecular cloning, substrate specificity of the functionally expressed dihydroflavonol 4-reductases from Malus domestica and Pyrus communis cultivars and the consequences for flavonoid metabolism. Arch Biochem Biophys. 2003;412:223–230. doi: 10.1016/s0003-9861(03)00013-4. [DOI] [PubMed] [Google Scholar]
- Guex N, Peitsch MC. SWISS-MODEL and the Swiss-PdbViewer: an environment for comparative protein modeling. Electrophoresis. 1997;18:2714–2723. doi: 10.1002/elps.1150181505. [DOI] [PubMed] [Google Scholar]
- Halbwirth H, Martens S, Wienand U, Forkmann G, Stich K. Biochemical formation of anthocyanins in silk tissue of Zea mays. Plant Sci. 2003;164:489–495. [Google Scholar]
- Hoballah ME, Gubitz T, Stuurman J, Broger L, Barone M, Mandel T, Dell'Olivo A, Arnold M, Kuhlemeier C. Single gene-mediated shift in pollinator attraction in Petunia. Plant Cell. 2007;19:779–790. doi: 10.1105/tpc.106.048694. [DOI] [PMC free article] [PubMed] [Google Scholar]
- Holton TA, Cornish EC. Genetics and biochemistry of anthocyanin biosynthesis. Plant Cell. 1995;7:1071–1083. doi: 10.1105/tpc.7.7.1071. [DOI] [PMC free article] [PubMed] [Google Scholar]
- Johnson ET, Ryu S, Yi HK, Shin B, Cheong H, Choi G. Alteration of a single amino acid changes the substrate specificity of dihydroflavonol 4-reductase. Plant J. 2001;25:325–333. doi: 10.1046/j.1365-313x.2001.00962.x. [DOI] [PubMed] [Google Scholar]
- Jones DT, Taylor WR, Thornton JM. The rapid generation of mutation data matrices from protein sequences. Comput Appl Biosci. 1992;8:275–282. doi: 10.1093/bioinformatics/8.3.275. [DOI] [PubMed] [Google Scholar]
- Khan AI, Dinh DM, Schneider D, Lenski RE, Cooper TF. Negative epistasis between beneficial mutations in an evolving bacterial population. Science. 2011;332:1193–1196. doi: 10.1126/science.1203801. [DOI] [PubMed] [Google Scholar]
- Kvitek DJ, Sherlock G. Reciprocal sign epistasis between frequently experimentally evolved adaptive mutations causes a rugged fitness landscape. Plos Genet. 2011;7:e1002056. doi: 10.1371/journal.pgen.1002056. [DOI] [PMC free article] [PubMed] [Google Scholar]
- Leonard E, Yan Y, Chemler J, Matern U, Martens S, Koffas MAG. Characterization of dihydroflavonol 4-reductases for recombinant plant pigment biosynthesis applications. Biocatal Biotransfor. 2008;26:243–251. [Google Scholar]
- Lynch M, Walsh B. Sunderland (MA): Sinauer; 1998. Genetics and the analysis of quantitative traits. [Google Scholar]
- Manceau M, Domingues VS, Linnen CR, Rosenblum EB, Hoekstra HE. Convergence in pigmentation at multiple levels: mutations, genes and function. Philos Trans R Soc Lond B Biol Sci. 2010;365:2439–2450. doi: 10.1098/rstb.2010.0104. [DOI] [PMC free article] [PubMed] [Google Scholar]
- Newcomb RD, Campbell PM, Ollis DL, Cheah E, Russell RJ, Oakeshott JG. A single amino acid substitution converts a carboxylesterase to an organophosphorus hydrolase and confers insecticide resistance on a blowfly. Proc Natl Acad Sci U S A. 1997;94:7464–7468. doi: 10.1073/pnas.94.14.7464. [DOI] [PMC free article] [PubMed] [Google Scholar]
- Olmstead RC, Sweere JA, Spangler RE, Bohs L, Palmer JD. Phylogeny and provisional classification of the Solanaceae based on chloroplast DNA. In: Nee M, Symon DE, Lester RN, Jessop JP, editors. Solanaceae IV. Kew (United Kingdom): Royal Botanical Gardens; 1999. pp. 111–137. [Google Scholar]
- Olmstead RG, Bohs L, Migid HA, Santiago-Valentin E, Garcia VF, Collier SM. A molecular phylogeny of the Solanaceae. Taxon. 2008;57:1159–1181. [Google Scholar]
- Ortlund EA, Bridgham JT, Redinbo MR, Thornton JW. Crystal structure of an ancient protein: evolution by conformational epistasis. Science. 2007;317:1544–1548. doi: 10.1126/science.1142819. [DOI] [PMC free article] [PubMed] [Google Scholar]
- Ostman B, Hintze A, Adami C. Impact of epistasis and pleiotropy on evolutionary adaptation. Proc Biol Sci. 2012;279:247–256. doi: 10.1098/rspb.2011.0870. [DOI] [PMC free article] [PubMed] [Google Scholar]
- Paape T, Igic B, Smith SD, Olmstead R, Bohs L, Kohn JR. A 15-Myr-old genetic bottleneck. Mol Biol Evol. 2008;25:655–663. doi: 10.1093/molbev/msn016. [DOI] [PubMed] [Google Scholar]
- Peichel CL, Nereng KS, Ohgi KA, Cole BLE, Colosimo PF, Buerkle CA, Schluter D, Kingsley DM. The genetic architecture of divergence between threespine stickleback species. Nature. 2001;414:901–905. doi: 10.1038/414901a. [DOI] [PubMed] [Google Scholar]
- Petit P, Granier T, d'Estaintot BL, Manigand C, Bathany K, Schmitter JM, Lauvergeat V, Hamdi S, Gallois B. Crystal structure of grape dihydroflavonol 4-reductase, a key enzyme in flavonoid biosynthesis. J Mol Biol. 2007;368:1345–1357. doi: 10.1016/j.jmb.2007.02.088. [DOI] [PubMed] [Google Scholar]
- Phillips PC. Epistasis—the essential role of gene interactions in the structure and evolution of genetic systems. Nat Rev Genet. 2008;9:855–867. doi: 10.1038/nrg2452. [DOI] [PMC free article] [PubMed] [Google Scholar]
- Protas ME, Hersey C, Kochanek D, Zhou Y, Wilkens H, Jeffery WR, Zon LI, Borowsky R, Tabin CJ. Genetic analysis of cavefish reveals molecular convergence in the evolution of albinism. Nat Genet. 2006;38:107–111. doi: 10.1038/ng1700. [DOI] [PubMed] [Google Scholar]
- Rokyta DR, Joyce P, Caudle SB, Miller C, Beisel CJ, Wichman HA. Epistasis between beneficial mutations and the phenotype-to-fitness map for a ssDNA virus. Plos Genet. 2011;7:e1002075. doi: 10.1371/journal.pgen.1002075. [DOI] [PMC free article] [PubMed] [Google Scholar]
- Rompler H, Rohland N, Lalueza-Fox C, Willerslev E, Kuznetsova T, Rabeder G, Bertranpetit J, Schoneberg T, Hofreiter M. Nuclear gene indicates coat-color polymorphism in mammoths. Science. 2006;313:62–62. doi: 10.1126/science.1128994. [DOI] [PubMed] [Google Scholar]
- Ronquist F, Huelsenbeck JP. MrBayes 3: Bayesian phylogenetic inference under mixed models. Bioinformatics. 2003;19:1572–1574. doi: 10.1093/bioinformatics/btg180. [DOI] [PubMed] [Google Scholar]
- Schultz ST, Lynch M. Mutation and extinction: the role of variable mutational effects, synergistic epistasis, beneficial mutations, and degree of outcrossing. Evolution. 1997;51:1363–1371. doi: 10.1111/j.1558-5646.1997.tb01459.x. [DOI] [PubMed] [Google Scholar]
- Smith SD. 2006. Floral diversification and pollination biology of the Andean clade Iochrominae (Solanaceae) [PhD dissertation]. [Madison (WI)]: University of Wisconsin. [Google Scholar]
- Smith SD, Baum DA. Phylogenetics of the florally diverse Andean clade Iochrominae (Solanaceae) Am J Bot. 2006;93:1140–1153. doi: 10.3732/ajb.93.8.1140. [DOI] [PubMed] [Google Scholar]
- Smith SD, Rausher MD. Gene loss and parallel evolution contribute to species difference in flower color. Mol Biol Evol. 2011;28:2799–2810. doi: 10.1093/molbev/msr109. [DOI] [PMC free article] [PubMed] [Google Scholar]
- Stafford HA, Lester HH. Enzymic and non-enzymic reduction of (+)-dihydroquercetin to its 3,4-diol. Plant Physiol. 1982;70:695–698. doi: 10.1104/pp.70.3.695. [DOI] [PMC free article] [PubMed] [Google Scholar]
- Stamatakis A. RAxML-VI-HPC: maximum likelihood-based phylogenetic analyses with thousands of taxa and mixed models. Bioinformatics. 2006;22:2688–2690. doi: 10.1093/bioinformatics/btl446. [DOI] [PubMed] [Google Scholar]
- Steiner CC, Weber JN, Hoekstra HE. Adaptive variation in beach mice produced by two interacting pigmentation genes (vol 5, pg e219, 2007) Plos Biol. 2008;6:418–418. doi: 10.1371/journal.pbio.0050219. [DOI] [PMC free article] [PubMed] [Google Scholar]
- Tenaillon O, Rodriguez-Verdugo A, Gaut RL, McDonald P, Bennett AF, Long AD, Gaut BS. The molecular diversity of adaptive convergence. Science. 2012;335:457–461. doi: 10.1126/science.1212986. [DOI] [PubMed] [Google Scholar]
- Weinreich DM, Delaney NF, DePristo MA, Hartl DL. Darwinian evolution can follow only very few mutational paths to fitter proteins. Science. 2006;312:111–114. doi: 10.1126/science.1123539. [DOI] [PubMed] [Google Scholar]
- Weinreich DM, Watson RA, Chao L. Perspective: sign epistasis and genetic constraint on evolutionary trajectories. Evolution. 2005;59:1165–1174. [PubMed] [Google Scholar]
- Whitlock MC, Phillips PC, Moore FBG, Tonsor SJ. Multiple fitness peaks and epistasis. Annu Rev Ecol Syst. 1995;26:601–629. [Google Scholar]
- Xie DY, Jackson LA, Cooper JD, Ferreira D, Paiva NL. Molecular and biochemical analysis of two cDNA clones encoding dihydroflavonol-4-reductase from Medicago truncatula. Plant Physiol. 2004;134:979–994. doi: 10.1104/pp.103.030221. [DOI] [PMC free article] [PubMed] [Google Scholar]
- Yang ZH. Likelihood ratio tests for detecting positive selection and application to primate lysozyme evolution. Mol Biol Evol. 1998;15:568–573. doi: 10.1093/oxfordjournals.molbev.a025957. [DOI] [PubMed] [Google Scholar]
- Yang ZH. PAML 4: phylogenetic analysis by maximum likelihood. Mol Biol Evol. 2007;24:1586–1591. doi: 10.1093/molbev/msm088. [DOI] [PubMed] [Google Scholar]
- Yang ZH, Nielsen R. Codon-substitution models for detecting molecular adaptation at individual sites along specific lineages. Mol Biol Evol. 2002;19:908–917. doi: 10.1093/oxfordjournals.molbev.a004148. [DOI] [PubMed] [Google Scholar]
Associated Data
This section collects any data citations, data availability statements, or supplementary materials included in this article.