Abstract
Two-dimensional imaging of spontaneous ultra-weak photon emission was measured in the yeast cells, Arabidopsis plant and the human hand using highly sensitive charge coupled device (CCD) camera. For the first time, the detail analysis of measuring parameters such as accumulation time and binning is provided with the aim to achieve two-dimensional images of spontaneous ultra-weak photon emission of good quality. We present data showing that using a hardware binning with binning factor 4 × 4, the accumulation time decreases in the following order: yeast cells (30 min) > the human hand (20 min) > Arabidopsis plant (10 min). Analysis of measuring parameters provides a detailed description of standard condition to be used for two-dimensional spontaneous ultra-weak photon imaging in microbes, plants and animals. Thus, CCD imaging can be employed as a unique tool to examine the oxidative state of the living organism with the application in microbiological, plant and medical research.
Spontaneous ultra-weak photon emission in the order of 10−16 W/cm2 is known to be emitted from various living systems comprising of microbial, plant and animal species1,2,3,4. In the past decades, one-dimensional detection of ultra-weak photon emission was performed using low-noise photomultiplier tube (PMT)5,6,7,8. Current development in highly sensitive charge coupled device (CCD) camera allows two-dimensional imaging of spontaneous ultra-weak photon emission. Recently, the role of reactive oxygen species (ROS) in ultra-weak photon emission was reported employing CCD imaging5,6,7. It was shown that the topical application of ROS such as superoxide anion radical (O2·−), hydrogen peroxide (H2O2) and hydroxyl radical (HO·) on the human skin enhances ultra-weak photon emission7. The topical application of scavengers (ascorbate, glutathione, CoQ10 and α-tocopherol) on the human skin was demonstrated to suppress the ultra-weak photon emission8. Charge coupled device imaging has also been employed to image spontaneous ultra-weak photon emission displaying diurnal rhythms and to image metabolically active cells such as cancer cells in rats5,9. The results demonstrated that cancer cells have higher photon count rate compared to normal cells.
CCD camera comprising of metal oxide semiconductors is used for two-dimensional spatial and temporal imaging of ultra-weak photon emission from living systems comprising of charge coupled device detectors5,7,10,11,12. The light sensitive regions referred to as pixels capture and store the image information in the form of electrical charge. The photon incident on each pixel is accumulated and subsequently read out by a process called charge coupling13. The signal is multiplied either by optical (electron-multiplying CCD) or electronic (intensified CCD) amplifications14,15,16.
For the CCD camera used for capturing photon emission, the CCD chip should be cooled either by using a peltier system or a liquid nitrogen cooling system to decrease the thermal noise and enhance the S/N ratio17,18,19. CCD technology is basically designed for use in the fields of astronomy and physics but the availability of highly sensitive detectors has made possible the two-dimensional imaging of ultra-weak photon emission from the living systems5,7,20.
Quality of image is determined by intensity (z-axis) and spatial resolution (x-y axis). The intensity of image is determined by the detector sensitivity known to be dependent on the efficiency by which the photons are converted into photoelectron. Since the flux of photons spontaneously emitted by the living organisms is ultra-weak in nature, the associated photoelectron ejection is extremely low. The spatial resolution of present day CCD camera which is determined by the pixel size (several units to tens μm) ranges from 512 × 512 pixels up to 1800 × 1800 pixels5,7,8,20. To overcome the limitations in sensitivity, the prolongation of the accumulation time and the binning of pixels are frequently applied5,20. Binning is the combination of two or more image pixels to form a large pixel referred to as super pixel which can be either pre-processing or post-processing21,22. The pre-processing procedure is called hardware binning which comprises of the addition of electronic charges of several pixels generated during the read-out directly on the CCD chip. The charges combined are read only one time from the sensor output stage provides the in lower read-out noise. The post-processing procedure is referred to as software binning which comprises of the addition of adjacent pixel intensities in the image after the image acquisition. The addition of either electronic charge or pixel intensities increases the number of electrons on the image element and thus the signal to noise ratio is enhanced. As a drawback of the addition of electronic charges of several pixels or adjacent pixel intensities, the spatial resolution is decreased proportionally with increase in the intensity.
In our present study, two-dimensional imaging of spontaneous ultra-weak photon emission was measured in the yeast cells, the Arabidopsis plant and the human hand using variable measuring parameters such as accumulation time and binning. Detail analysis of measuring parameters shows that the accumulation time required for two-dimensional imaging of spontaneous ultra-weak photon emission of good quality decreases in the following order: yeast cells (30 min) > the human hand (20 min) > Arabidopsis plant (10 min). The study provides evidence for the use of two-dimensional imaging of spontaneous ultra-weak photon emission as an excellent non-invasive method for physiological and pathological state in microbiological, plant and medical research.
Results
Two-dimensional imaging of spontaneous ultra-weak photon emission from yeast cells
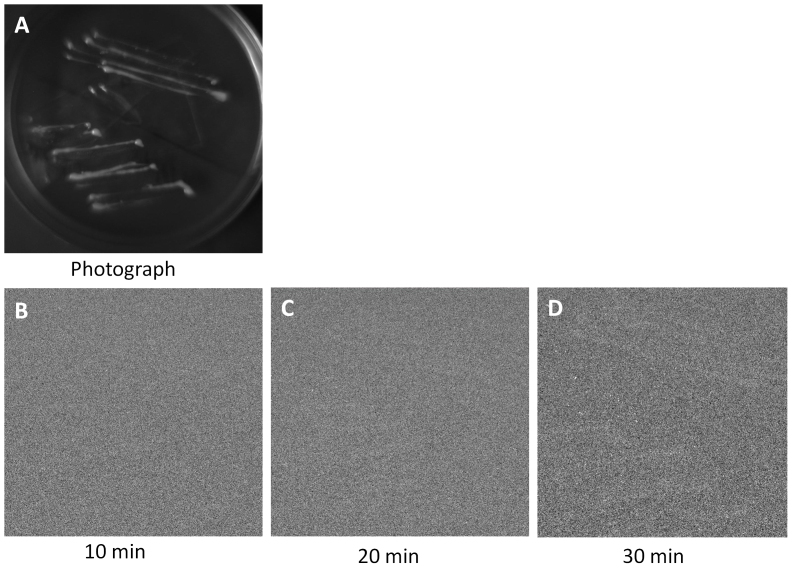
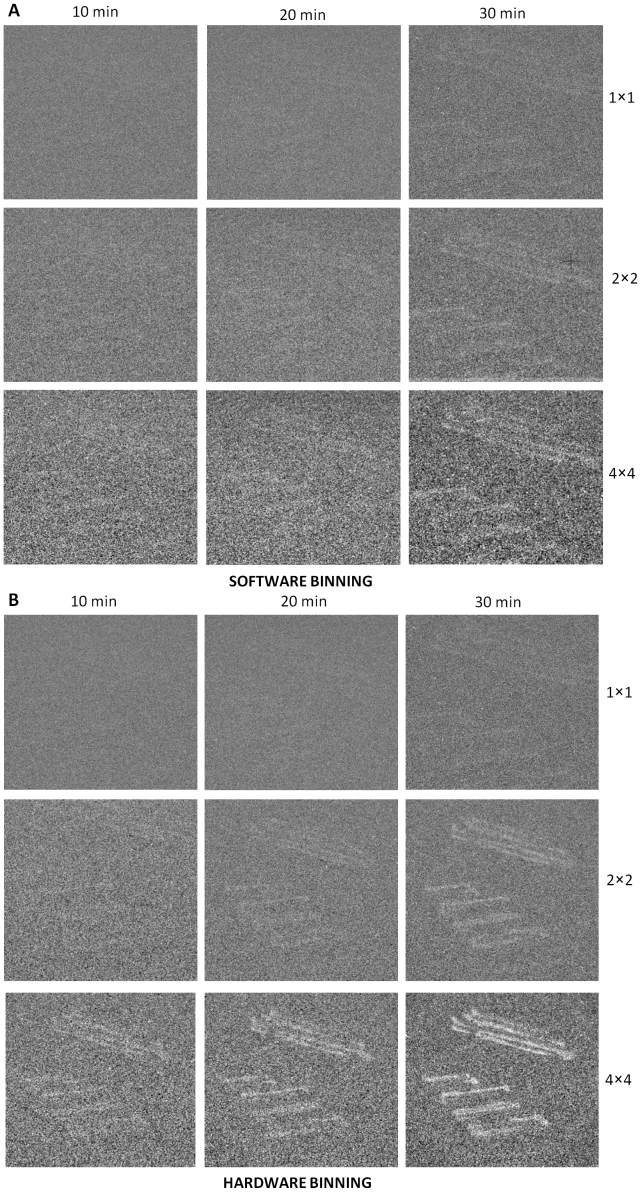
Two-dimensional imaging of spontaneous ultra-weak photon emission from a yeast cell culture (Saccharomyces cerevisiae) was measured using CCD camera with different accumulation times (Fig. 1). Fig. 1A represents the photograph of the yeast culture taken under weak-light illumination. The spontaneous ultra-weak photon emission was recorded with the accumulation time of 10 min, 20 min and 30 min as shown in Figs. 1B, 1C and 1D, respectively. As clearly evident from Fig. 1, the ultra-weak photon emission recorded with the accumulation time of 10 min, 20 min and 30 min was not clearly visible. To visualize and improve the intensity of images, software and hardware binning were applied. Fig. 2 shows the images taken with the accumulation time of 10 min, 20 min and 30 min obtained using software and hardware binning with a binning factor of 2 × 2 and 4 × 4. The image obtained using software binning with binning factor of 4 × 4 after 30 min of accumulation time is visible while the images with low accumulation time were difficult to visualize. Similarly in Fig. 2B, when hardware binning with binning factor of 2 × 2 was applied, the ultra-weak photon image become partially visible at the accumulation time of 20 min. However, when hardware binning with binning factor of 4 × 4 was applied with the accumulation time of 30 min, the image intensity was considerably enhanced. Thus, for two-dimensional imaging of spontaneous ultra-weak photon emission from yeast cells, a minimum accumulation time of 30 min using hardware binning with binning factor 4 × 4 is required.
Figure 1. Two-dimensional imaging of spontaneous ultra-weak photon emission from yeast cells (Saccharomyces cereviseae).
The photograph (A) and the corresponding two-dimensional images of spontaneous ultra-weak photon emission measured with variable accumulation time of 10 min (B), 20 min (C) and 30 min (D). The yeast culture plate was distanced at 30 cm from CCD camera window.
Figure 2. Two-dimensional imaging of spontaneous ultra-weak photon emission from yeast cells (Saccharomyces cereviseae) using software and hardware binning.
(A), Two dimensional imaging of spontaneous ultra-weak photon emission measured using software binning mode with a binning factor of 1 × 1, 2 × 2 and 4 × 4 and variable accumulation time of 10 min, 20 min and 30 min. (B), Two-dimensional imaging of ultra-weak photon emission images measured with hardware binning mode using a binning factor of 1 × 1, 2 × 2 and 4 × 4 and variable accumulation time of 10 min, 20 min and 30 min. The accumulation time (x-axis) versus the binning factor (y-axis) were analyzed.
Two-dimensional imaging of spontaneous ultra-weak photon emission Arabidopsis plant
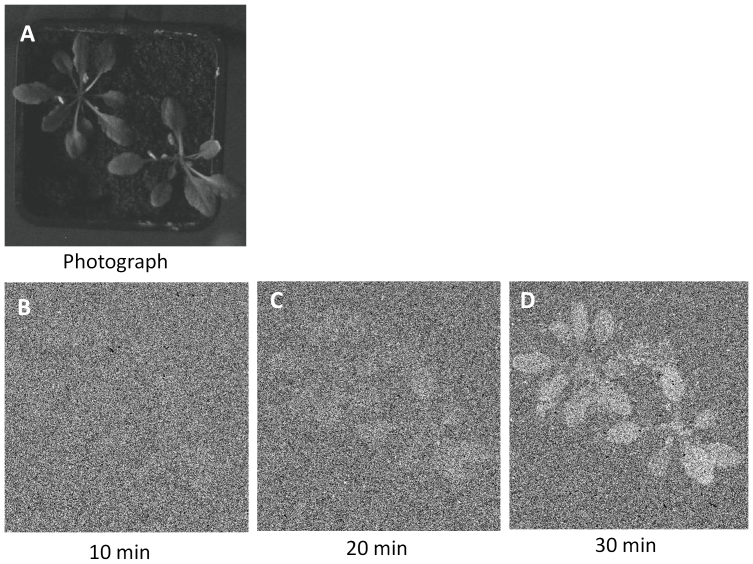
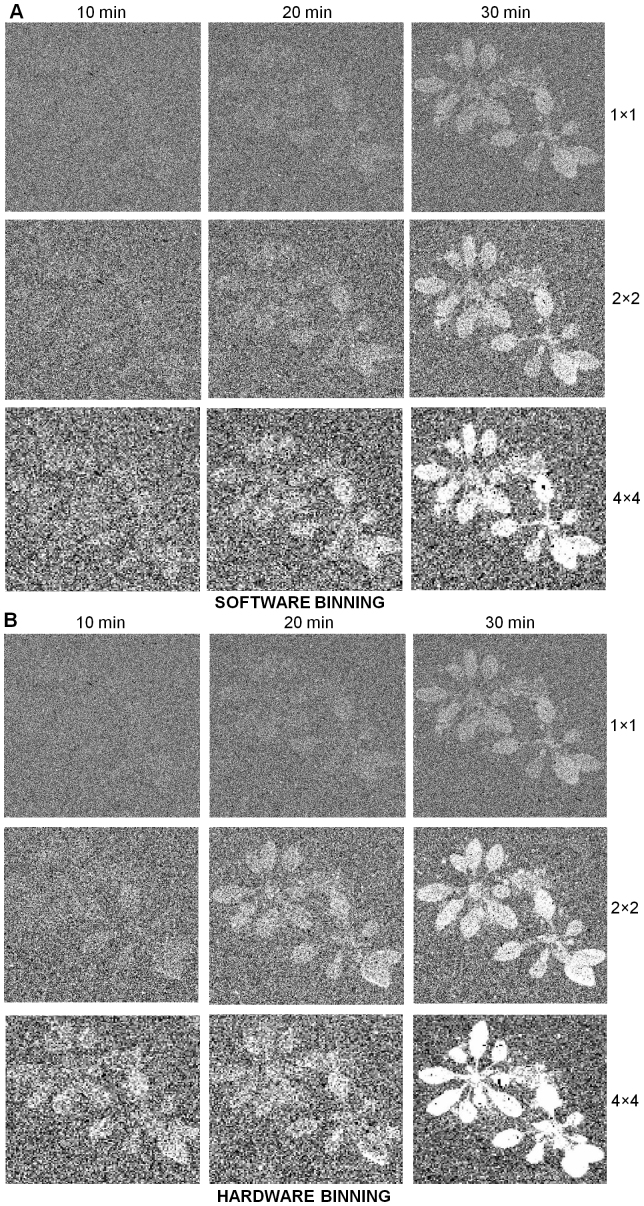
Two-dimensional imaging of spontaneous ultra-weak photon emission was measured from an Arabidopsis plant using highly sensitive CCD camera with different accumulation times (Fig. 3). The photograph (Fig. 3A) and the corresponding images of spontaneous ultra-weak photon emission measured from the Arabidopsis plant (Figs. 3B–D). Figs. 3B–3D represent the spontaneous ultra-weak photon emission with the accumulation time of 10 min, 20 min and 30 min, respectively. The image obtained after the accumulation time of 30 min is appropriate for visualization of ultra-weak photon emission from the Arabidopsis plant. Software and hardware binning were employed to reach the minimum accumulation time required to obtain image from Arabidopsis plant. Figs. 4A and 4B show the images obtained with different accumulation time and with the application of software and hardware binning. When no software binning was applied, the ultra-weak photon emission image from the Arabidopsis plant is visible only with the accumulation time of 30 min (Fig. 4A). With software binning with binning factor of 2 × 2, the image intensity obtained with 30 min was greatly enhanced while the images with accumulation time of 20 min turns out to be visible. When software binning with binning factor of 4 × 4 was applied, the image intensity was considerably enhanced and images with accumulation time of 20 min and 30 min were found to be sufficiently enhanced. Correspondingly, when hardware binning was applied in the identical approach, we observed a high intensity image with the same accumulation time and binning factors (Fig. 4B). The image obtained with hardware binning at binning factor of 2 × 2 was of high intensity to the image obtained with software binning with a binning factor of 2 × 2. The image intensity was even more enhanced using the hardware binning with a binning factor of 4 × 4 and also the image from Arabidopsis plant appeared at the accumulation time of 10 min employing hardware binning with a binning factor of 4 × 4. Based on these observations, it is concluded that for two-dimensional imaging of spontaneous ultra-weak photon emission of the Arabidopsis plant, a minimum accumulation time of 10 min using a hardware binning with a binning factor of 4 × 4 is required.
Figure 3. Two-dimensional imaging of spontaneous ultra-weak photon emission from Arabidopsis plant.
The photograph (A) and the corresponding two-dimensional images of spontaneous ultra-weak photon emission with variable accumulation time of 10 min (B), 20 min (C) and 30 min (D). The growing pot was distanced at 26 cm from CCD camera window.
Figure 4. Two-dimensional imaging of spontaneous ultra-weak photon emission from Arabidopsis plant using software and hardware binning.
(A), Two-dimensional imaging of ultra-weak photon emission measured with software binning mode and variable accumulation time. (B), Two-dimensional imaging of ultra-weak photon emission measured with hardware binning mode and variable accumulation time. Accumulation times were kept 10 min, 20 min and 30 min. The accumulation time (x-axis) versus the binning factor (y-axis) were analyzed. The binning factor ranges from 1 × 1 to 4 × 4.
Two-dimensional imaging of spontaneous ultra-weak photon emission from human hand
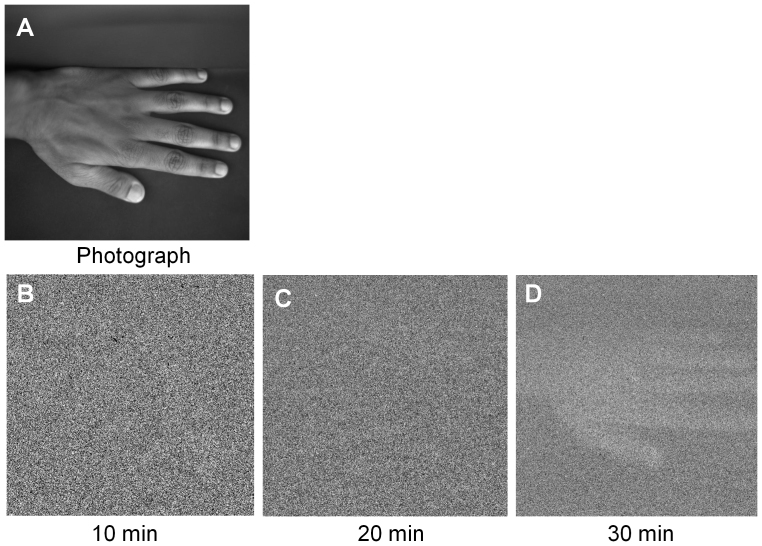
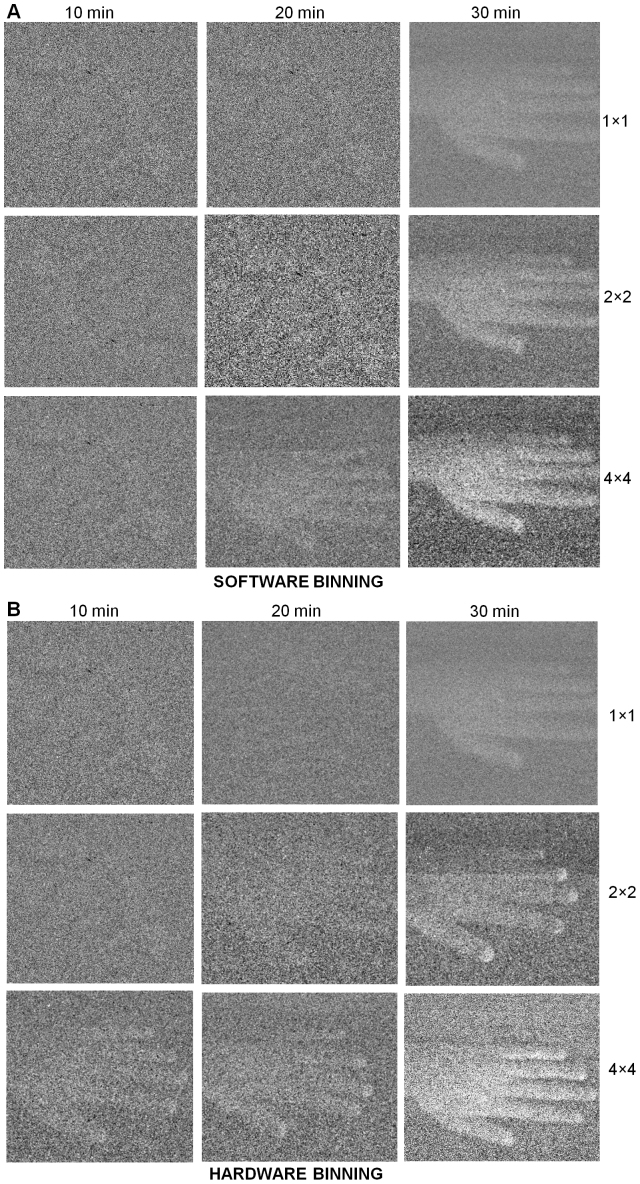
Two-dimensional imaging of spontaneous ultra-weak photon emission was performed on the dorsal side of the human hand using CCD camera with different accumulation times (Fig. 5). Fig. 5A shows the photograph of the dorsal side of the hand under weak light illumination. Figs. 5B, 5C and 5D show the ultra-weak photon images taken with the accumulation time of 10 min, 20 min and 30 min, respectively. The image obtained shows that the accumulation time of 30 min is required to generate a two-dimensional image of spontaneous ultra-weak photon emission from the human hand. We employed the software and hardware binning parameters to decipher out the minimum time required to generate the image from the human hand. With the application of software binning with a binning factor of 2 × 2, the image obtained after accumulation time of 10 min and 20 min was partially visible but with the accumulation time of 30 min produces a visible ultra-weak photon image (Fig. 6A). Upon using a binning factor of 4 × 4, the image intensity was enhanced to a substantial extent. However, using hardware binning with binning factor of 2 × 2 and the accumulation time of 30 min, the image intensity was considerably increased (Fig. 6B). In addition, using a binning factor of 4 × 4, the image was clearly visible with the accumulation time of 20 min while accumulation time of 30 min provides a high intensity ultra-weak photon image of the hand. Thus, the two-dimensional imaging of spontaneous ultra-weak photon emission from the human hand can be best performed using hardware binning with a binning factor of 4 × 4 and with the accumulation time of 20 min.
Figure 5. Two-dimensional imaging of spontaneous ultra-weak photon emission from the human hand.
The photograph (A) taken under weak light illumination and the corresponding two-dimensional images of spontaneous ultra-weak photon emission with variable accumulation time of 10 min (B), 20 min (C) and 30 min (D). The dorsal side of the human hand was distanced at 37 cm from CCD camera window.
Figure 6. Two-dimensional imaging of spontaneous ultra-weak photon emission from the human hand using software and hardware binning.
(A), Two-dimensional imaging of ultra-weak photon emission measured with software binning mode and variable accumulation time. (B), Two-dimensional imaging of ultra-weak photon emission measured with hardware binning mode and variable accumulation time. Accumulation times ranging from 10 min to 30 min were analyzed as shown in the x-axis and binning factor applied is shown in the y-axis. The binning factor ranges from 1 × 1 to 4 × 4.
Discussion
The two-dimensional imaging of ultra-weak photon emission from microorganism has not been reported till date. Here, we for the first time have successfully imaged the ultra-weak photon emission from the yeast cells utilizing the CCD camera (Figs. 2A and 2B). The observation that no image has been obtained after the accumulation time of 30 min without any application of binning indicates that the two-dimensional imaging of spontaneous ultra-weak photon emission from yeast cell is impossible without the utilization of the binning mode.
It has been previously reported that the intensity of ultra-weak photon emission is determined by the cell density, the level of oxidative metabolic processes and pigment content6,8,23,24. The cell density in petri-plate containing solid media composed of agar is typically by several orders lower than the cell density in plant and animal tissue. Evidence has been provided that the cellular metabolic rate is similar for microbial, plant and animal cells. As yeast cells are deprived of pigments participating in the triplet-singlet energy transfer which occurs from the excited species to the pigments, the ultra-weak photon emission observed in these cells are directly from the excited species such as triplet carbonyl and singlet oxygen formed during the oxidation of biomolecules. Based on these considerations, it is suggested that the low intensity of photon emission in yeast cells is due to the low cell density and the absence of pigment.
Two-dimensional imaging of spontaneous ultra-weak photon emission in plants has been demonstrated in the past decades24,25,26,27. It has been shown that an image of high intensity is observed with the accumulation time of 60 min with the application of neither software nor hardware binning. In the present study, the application of both software and hardware binning pronouncedly shortens accumulation time to 20 min and 10 min, respectively (Fig. 4). The application of both software and hardware binning can be beneficial in two-dimensional imaging of spontaneous ultra-weak photon emission from plant to study the short term effect which demands short precise details studies and the weak effect that requires more specificity.
The cell density is higher in plants as compared to the microorganism. The pigments in plants such as chlorophylls are known to absorb in the visible range of the spectrum at Soret-band (436 nm and 480 nm) and the Q-band (646 nm and 663 nm)28. The main sources of photon generation in plants are considered to be from the triplet excited carbonyls, singlet oxygen and the singlet excited chlorophylls formed via triplet-singlet energy transfer from triplet excited carbonyls to molecular oxygen and chlorophylls, respectively.29,30. These considerations reveal that the high level of ultra-weak photon emission is caused by the high cell density and the presence of chlorophylls in plant tissue.
Two-dimensional imaging of spontaneous ultra-weak photon emission in human skin has been performed recently5,7,8,20. It has been demonstrated that an image of high intensity is observed with the accumulation time to 30 min and 20 min with the application of software (binning factor 4 × 4) and hardware (binning factor 8 × 8) binning, respectively5,7. In the current study, two-dimensional imaging of ultra-weak photon emission is done with software binning and hardware binning with a binning factor of 4 × 4 and the accumulation time to 30 min and 20 min, respectively (Fig. 6). These observations reveal that the two-dimensional imaging of spontaneous ultra-weak photon emission from human hand strictly requires the application of binning. The employment of both software and hardware binning can be beneficial for the application of two-dimensional imaging of spontaneous ultra-weak photon emission in clinical investigations.
The cell density in animals is higher as compared to that of microorganism. The pigments such as melanin and bilurubin, which are the predominant in the human skin, have been demonstrated to absorb both in the UV and visible region of the spectrum at spectral range of 300–600 nm31. It is proposed that ultra-weak photon emission from human hand originates from the triplet excited carbonyls, singlet oxygen and singlet excited melanin and bilirubin. Singlet oxygen and singlet excited pigments are formed by triplet-singlet energy transfer from excited carbonyls to molecular oxygen and pigments, respectively. These considerations reveal that the high intensity of ultra-weak photon emission is caused by the high cell density and high concentration of pigments (melanin and bilirubin) in the human skin.
Methods
Sample preparation
Yeast cells
Cold sensitive β-tubulin mutant tub2-401 of yeast cells Saccharomyces cerevisiae (strain CUY67 Mata tub2-401 ura3-52 ade2-101) was used for two-dimensional imaging of ultra-weak photon emission. The cells were cultured on yeast peptide dextrose (YPD) medium containing agar. The yeast cells were cultured overnight in an incubator at a constant temperature of 28°C and were studied during the growth phase. Just prior to measurement, the culture plate was dark adapted for 2 h.
Arabidopsis plant
The Arabidopsis thaliana ecotype Columbia (Col-0) seeds soaked in distilled water for a period of 4 days at 4°C potted in the growing pots filled with a peat substrate (Klasmann, Potground H). The plants were grown for 6 weeks at a photoperiod of 16 h light/8 h dark (photon flux density 100 μmol photons m−2 s−1) at a temperature of 25°C and relative humidity 60%. Prior to measurement, the Arabidopsis plant was transferred to the dark room and adapted for 3 h to prevent any intervention of delayed luminescence.
Human hand
The current study was performed in agreement with the ethical principles stated in the declaration of Helsinki and its subsequent revisions. The study was carried on the author's hand and no other subject was involved in the study. The measurements were performed in a dark room which is restricted from any external light source. The measurements were performed during a fixed period ranging from 11:00 and 14:00 hrs to avoid any kind of diurnal fluctuation5. Use of cosmetics was prohibited during the course of the study. The subject was dark adapted for a duration of 30 min to prevent any intervention of delayed luminescence.
Two-dimensional imaging of spontaneous ultra-weak photon emission
CCD camera VersArray 1300B (Princeton instruments, Trenton, NJ, USA) was used for two-dimensional imaging of ultra-weak photon emission from the yeast cells, the Arabidopsis plant and the human hand. The spectral sensitivity of the CCD camera was in the range of 350–1000 nm with quantum efficiency of 90%. It comprised of objective lens of 50 mm focal distance (F mount Nikkor 50-mm, f: 1.2, Nikon) to enhance the light collecting efficiency. The CCD was cooled down to −110°C using a liquid nitrogen cooling system to reduce the dark count. The following measuring parameters were used: scan rate, 100 kHz; gain, 2; variable accumulation time (10 min, 20 min and 30 min) and variable image formats (1340 × 1300, 670 × 650, 335 × 325 pixels). Different accumulation time and image format were used in order to analyze the image quality and the signal-to-noise (S/N) ratio. The image formats were achieved using different factors of software or hardware binning. By using software or hardware binning with a binning mode of 2 × 2, an image format of 670 × 650 was achieved while a binning mode of 4 × 4 resulted in an image format of 335 × 325 pixels. The distance between the detector and the yeast cells, Arabidopsis plant and human hand was kept 23 cm, 26 cm and 37 cm, respectively. The data correction was made by subtracting the background signal prior to each measurement. All experiments were performed with CCD camera situated in the experimental dark room with a dimension 3 m × 1.5 m × 2.5 m. The whole interior of the experimental dark room was painted with black color and door was protected with a black curtain. The data recording computer was installed in the outer dark room.
Author Contributions
Conceived and designed the experiment: P.P., A.P. Performed the experiments: A.P. Analyzed the data: A.P. Contributed reagents and materials: P.P. Wrote the paper: P.P., A.P.
Acknowledgments
This work was supported by the grants no. ED0007/01/01 Centre of the Region Haná for Biotechnological and Agricultural Research and no. CZ.1.07/2.3.00/20.0057 Operational Programme Education for Competitiveness from the Ministry of Education Youth and Sports, Czech Republic. We thank Prof. Jiří Hašek (Institute of Microbiology, Academy of Sciences, Czech Republic) and Dr. Michal Cifra (Institute of Photonics and Electronics, Academy of Sciences, Czech Republic) for providing yeast cell culture. Thanks are also to Deepak Kumar Yadav, Anshu Rastogi and Marek Rác for their assistance during the tenure of the study.
References
- Amano T., Kobayashi M., Devaraj B., Usa M. & Inaba H. Ultra-weak biophoton emission imaging of transplanted bladder cancer. Urol. Res. 23 (5), 315–318 (1995). [DOI] [PubMed] [Google Scholar]
- Van wijk R., Van wijk E. P. A. & Bajpai R. P. Photocount distribution of photon emitted from three sites of a human body. J. Photochem. Photobiol. B: Biology 84, 45–55 (2006). [DOI] [PubMed] [Google Scholar]
- Cifra M., Van wijk E., Koch H., Bosman, S. & Van wijk, R. Spontaneous ultra-weak photon emission from human hand is time dependent. Radioengineering 16 (2), 15–19 (2007). [Google Scholar]
- Laagar F., Park S.-H., Yang J.-M., Song W. & Soh K.-S. Effect of exercises on biophoton emission of the wrist. Eur. J. Appl. Physiol. 102, 463–469 (2008). [DOI] [PubMed] [Google Scholar]
- Kobayashi M., Kikuchi D. & Okamura H. Imaging of ultra-weak spontaneous photon emission from human body displaying diurnal rythym. PLoS one 4 (7), e6256 (2009). [DOI] [PMC free article] [PubMed] [Google Scholar]
- Prasad A. & Pospíšil P. Linoleic acid-induced ultra-weak photon emission from Clamydomonas reanhardtii as a tool for monitoring lipid peroxidation in cell membrane. PLoS one 6 (7), e22345 (2011). [DOI] [PMC free article] [PubMed] [Google Scholar]
- Prasad A. & Pospíšil P. Two-dimensional imaging of spontaneous ultraweak photon emisiion from the human skin: role of reactive oxygen species. J. Biophotonics 4 (11–12), 840–849 (2011). [DOI] [PubMed] [Google Scholar]
- Rastogi A. & Pospíšil P. Spontaneous ultraweak photon emission imaging of oxidative metabolic processes in human skin: effect of molecular oxygen and antioxidant defence system. J. Biomed. Opt. 16 (9), 096005 (2011). [DOI] [PubMed] [Google Scholar]
- Takeda M., Kobayashi M., Takayama M., Suzuki S., Ishida T., Ohnuki K., Moriya T. & Ohuchi N. Biophoton detection as a novel technique for cancer imaging. Cancer Sci. 95 (8), 656–661 (2004). [DOI] [PMC free article] [PubMed] [Google Scholar]
- Cabello J., Bailey A., Kitchen I., Prydderch M., Clark A., Turchetta R. & Wells K. Digital autoradiography using room temperature CCD and CMOS imaging technology. Phys. Med. Biol. 52, 4993–5011 (2007). [DOI] [PubMed] [Google Scholar]
- Janesick J. & Elliott T. History and advancement of large area array scientific area images. Astronomical CCD observing and reduction technique, ASP conference series., Howeel S. B., ed. eds. 23 (1992).
- Groom D. E., Holland S. E., Levi M. E., Palaio N. P., Perlmutter S., Stover R. J. & Wei M. Back-illuminated, fully depleted CCD image sensors for use in optical and near-IR astronomy. Nucl. Instrum. Methods 442 (1–3), 216–222 (2000). [Google Scholar]
- Reinke B. W. Optical coupling of two rapid charge coupled device (CCD) cameras to analyse the complete image. REE Revue de L'Electricite et de L' Electronique (5), 30–32 (2003). [Google Scholar]
- Denvir D. J. & Conroy E. Electron multiplying CCD technology: The new ICCD. Proceeding of SPIE-the international society for optical engineering 4796, 164–174 (2002). [Google Scholar]
- Zhang W. & Chen Q. Signal-to-noise ratio performance comparison of electron multiplying CCD and intensified CCD detectors. Proceeding of 2009 international conference on image analysis and signal processing 50544588, 337–341 (2009). [Google Scholar]
- Salmon W. C. & Waters J. C. CCD camera for fluorescence imaging of living cells. Cold Spring Harb. Protocols 6 (7), 790–802 (2011). [DOI] [PubMed] [Google Scholar]
- Gardner D. W. Does your CCD need cooling? Photon. Spectra. 36 (6), 69–71 (2002). [Google Scholar]
- Schmitt R. L., Cease H., DePoy D., Diehl H. T., Estrada J., Flaugher B., Kuhlmann S., Onal B. & Stefanik A. Cooling the dark energy camera instrument. Proceeding of SPIE-the international society for optical engineering 7014, 70146O (2008). [Google Scholar]
- Domke K. & Skrzypczak A. Peltier modules in cooling system for electronic components. WIT transactions on Engineering Sciences 68, 3–12 (2010). [Google Scholar]
- Prasad A. & Pospíšil P. Ultra-weak photon emission induced by visible light and ultraviolet A radiation via photoactivated skin chromophores: in vivo charge coupled device imaging. J. Biomed. Opt. 17 (8), 085004 (2012). [DOI] [PubMed] [Google Scholar]
- Epperson P. M. & Denton M. B. Binning spectral devices in charge-coupled device. Anal. Chem. 61 (14), 1513–1517 (1989). [Google Scholar]
- Hogan H. Multiplying electron yields multiplexed results. Biophotonics International 13 (8), 19–21 (2006). [Google Scholar]
- Hideg E. & Inaba H. Biophoton emission (ultraweak photoemission) from dark adapted spinach chloroplast. Photochem Photobiol 53 (1), 137–142 (1991). [Google Scholar]
- Havaux M., Triantaphylides C. & Genty B. Autoluminescence imaging: a non-invasive tool for mapping oxidative stress. Trends Plants Sci. 11 (10) (2006). [DOI] [PubMed] [Google Scholar]
- Bennett M., Mehta M. & Grant M. Biophoton imaging: a nondestructive method for assaying R gene responses. MPMI 18 (2) (2005). [DOI] [PubMed] [Google Scholar]
- Mansfield J. M. Biophoton distress flares signal the onset of the hypersensitive reaction. Trends Plants Sci. 10 (7), 307–309 (2005). [DOI] [PubMed] [Google Scholar]
- Kobayashi M., Sasaki K., Enomoto M. & Ehara Y. Highly sensitive determination if transient generation of biophotons during hypersensitive response to cucumber mosaic virus in cowpea. J. Expt. Bot. 58 (3), 465–472 (2007). [DOI] [PubMed] [Google Scholar]
- Lichtenthaler H. K. Chlorophylls and carotenoids, the pigments of photosynthetic biomembranes. Methods Enzymol. 148, 350–382 (1987). [Google Scholar]
- Augusto G. & Cilento G. Dark excitation of chlorophyll. Photochem. Photobiol. 30, 191–193 (1979). [Google Scholar]
- Campa A., Nassi L. & Cilento G. Triplet energy transfer to chloroplasts from peroxidase-generated excited aliphatic aldehydes. Photochem. Photobiol. 40, 127–131 (1984). [Google Scholar]
- Ou-Yang H., Stamatas G., Saliou C. & Kollias N. A chemiluminescence study of UV-A induced oxidative stress in human skin. In vivo. J. Invest. Dermatol. 122, 1020–1029 (2004). [DOI] [PubMed] [Google Scholar]


