

Abstract
The transverse decay of the arterial spin labeling (ASL) signal was measured at four inflow times in the rat brain cortex at 9.4 T. Biexponential T2 decay was observed that appears to derive from different T2 values associated with labeled water in the intravasculature (IV) and extravascular (EV) compartments. A two compartment biexponential model was used to assess the relative contribution of the IV and EV compartments to the ASL signal, without assuming a value for T2 of labeled blood water in the vessels. This novel methodology was applied to estimate the exchange time of blood water into EV tissue space and the oxygen saturation of blood on the arterial side of the vasculature. The mean exchange time of labeled blood water was estimated to be 370±40 ms. The oxygen saturation of the arterial side of the vasculature was significantly less than 100% (∼85%), which may have implications for quantitative functional magnetic resonance imaging studies where the arterial oxygen saturation is frequently assumed to be 100%.
Keywords: arterial spin labeling, ASL, cerebral hemodynamics, exchange, functional MRI (fMRI), MRI
Introduction
Arterial spin labeling (ASL) is a non-invasive magnetic resonance imaging (MRI) technique in which blood water is harnessed as an endogenous tracer to map quantitative cerebral blood flow (CBF).1, 2, 3 The magnetization of inflowing blood water is modulated (labeled) to generate images that reflect the distribution of blood water that has flowed into the brain. Recent hardware improvements and sequence innovations have helped ASL to become an increasingly important and widely used tool in both clinical and research settings.4, 5 Flow sensitive alternating inversion recovery (FAIR) is a pulsed ASL (PASL) technique in which pairs of images are acquired after global and slice-selective inversion pulses.6, 7 The time between labeling and image acquisition is known as the inflow time (TI). Figure 1 shows a schematic representation of the delivery of labeled blood water to brain tissue during the TI. After labeling, some of the labeled blood water enters the imaging volume and exchanges into the tissue (extravascular (EV) space) and some remains in the vessels (intravascular (IV) space). Several studies have investigated the relative contribution of the labeled blood water in the IV and EV compartments to the ASL signal. These data have important implications for the accuracy of CBF quantification using ASL techniques, since the rate of longitudinal decay of the tracer (blood water) will be slower in the blood and faster in the tissue because of the difference in the T1 of blood and tissue. Therefore, precise knowledge of the time between labeling and exchange (or tissue transit time (δ) using the notation described in standard CBF quantification models8) will improve the accuracy of perfusion estimation. This is particularly important in cerebral pathology where transit and exchange times may be significantly different in comparison to healthy volunteers. Furthermore, accurate, non-invasive mapping of tissue transit time may improve understanding of disease processes (blood brain barrier permeability has been reported to change in neurodegenerative disease and central nervous system infections9) and allow the assessment of targeted therapies (e.g., vascular disrupting agents). In this study, we present a new technique that may yield more accurate δ estimates for improved reliability of CBF estimation and vascular permeability assessment.
Figure 1.

A schematic representation of the delivery of labeled blood water (in red) to the brain at increasing inflow time (TI). After the inversion pulse, blood water is delivered to the capillary bed where it exchanges into the extravascular (EV) tissue space. δa is the arterial transit time, τ is the temporal length of the tagged bolus, and δ is the tissue transit time (the time taken for labeled blood water to exchange into the EV tissue after the labeling pulse). In this work, we define exchange time to be δ–δa (the time taken for labeled blood water to exchange into the tissue once it has arrived into the imaging voxel). In this study, we aim to exploit the difference in vessel (∼15 ms) and tissue (∼38 ms) T2 to estimate the distribution of tagged spins in the IV and EV compartments at variable TI to estimate the exchange time. The color reproduction of this figure is available at the Journal of Cerebral Blood Flow and Metabolism journal online.
Earlier studies have investigated the IV and EV sources of the ASL signal using diffusion10, 11, 12 and magnetization transfer13, 14 sensitized measurements, and an IV contrast agent.15 However, there may be limits as to how accurately diffusion and magnetization transfer can distinguish the IV and EV contributions.12 A recent study estimated the macrovascular arterial contribution to the ASL images by imaging the tagged bolus over a number of TIs and fitting the data to a Bayesian model.16
T2 describes the rate of spin-echo transverse relaxation of the magnetic resonance signal. The different T2 values associated with different tissue types provide contrast in magnetic resonance images. This contrast is key to many clinical applications of MRI from structural imaging to tumor detection to mapping of tissue inflammation. The sensitivity of the transverse relaxation to blood oxygenation underpins functional MRI (fMRI) blood oxygen level-dependent measurements. An MRI voxel typically contains several ‘compartments' of different molecular environments, each with their associated rate of T2 decay at a tissue level (e.g., cerebrospinal fluid and gray matter in the brain) and a cellular level (e.g., intracellular (IC) and extracellular (EC) spaces). In principle, it is possible to extract the volume distribution of the different compartments within the voxel (and their respective T2 values) by acquiring spin-echo images over a number of echo times (TE) and fitting the data to a multiexponential model, e.g., Schad et al.17 In practice, this is highly challenging because of signal-to-noise (SNR) limitations and exchange of water between different compartments during the measurement time (TE).
Two previous studies have measured the spin-echo transverse decay (T2) of the ASL signal to estimate the IV-to-EV ratio of the labeled blood water. However, each study made assumptions that may limit the accuracy of the physiologic interpretation of their data. In our previous study at 2.35 T,18 we observed that the T2 of labeled water in the vessels was similar to that of the tissue. Consequently, we were not able to estimate the compartmentation of the ASL signal in the IV and EV spaces based on measurements of the transverse decay with any practical precision. Therefore, we used diffusion gradients (on the slice-select axis; b value=40 s/mm2) to separate the IV and EV components of the ASL signal (based on Silva et al10 and Wang et al11). However, the IV contribution may not have been completely attenuated by the diffusion weighting (given the evidence for low-velocity isotropic flow in the capillary bed19 and single direction of the diffusion gradients) and consequently the IV contribution to the ASL signal may have been underestimated. In a later study, Liu et al20 measured the ASL signal at four TE and four TIs to estimate the tissue transit time in humans. However, Liu et al assumed a constant T2 value of IV blood water of ∼160 ms (corresponding to the T2 of blood with 100% oxygen saturation). While this may be appropriate for blood water in the arteries (indeed their measurements of the T2 of the ASL signal at short delay time suggest that this is an accurate assumption), this is unlikely to be accurate further downstream given that: (1) the blood in the capillaries has <<100% oxygen saturation and (2) the evidence for exchange of oxygen before the capillaries.21 In vitro studies have shown marked sensitivity of the T2 of blood to the blood oxygen saturation22, 23 (e.g., T2 of blood ∼50 ms at 80% oxygen saturation and ∼150 ms at 100% oxygen saturation at 3T;23 the oxygen saturation of small arteries in the rat cortex is ∼80%21). Consequently, the estimates of tissue transit time reported in Liu et al 20 may be confounded by this assumption.
Recently, an investigation at 9.4 T aimed to measure the transverse decay of the continuous ASL (CASL) signal at a short labeling (300 ms) and postlabeling delay time (300 ms) to estimate the arterial blood oxygen saturation in the rat cortex.24 This study found that the T2 of the arterial blood signal (30 ms) to be significantly less than that of the tissue (38 ms) corresponding to an arterial oxygen saturation of 0.88 in the cortex. These findings are also concordant with direct measurement of oxygen saturation in the rat cortex.21 These findings have important implications for quantitative fMRI studies that aim to estimate oxygen extraction fraction (from the mismatch between supply and demand of oxygen25). Currently, most quantitative fMRI studies assume that blood on the arterial side of the vasculature is ∼100% saturated with oxygen.26, 27, 28 These data challenge the validity of this assumption, and highlight the value of combined ASL and T2 measurement techniques for accurate, non-invasive estimation of arterial oxygen saturation in quantitative fMRI studies.
In this study, we have acquired FAIR ASL images at 15 TE and four TIs at 9.4 T in the rat brain. By applying a two compartment (IV and EV signal) model to the data, we aimed to accurately estimate δ without assuming a constant T2 value for the labeled blood water in the vessels. By explicitly measuring the ‘fast' T2 component, the mean oxygen saturation of the labeled water in the vasculature can be estimated. This allows noninvasive estimation of the oxygen saturation of the blood in the arterial side of the cerebral vasculature, which may have utility in future quantitative fMRI studies.
Materials and methods
In this study, three separate set of experiments were performed: (part i) Multiple average acquisitions at a single TI to precisely sample the transverse decay of labeled blood water to provide novel evidence for biexponential transverse relaxation through an unconstrained 4-parameter fit to the relaxation curve; (part ii) Sampling the transverse decay of the ASL signal over four TIs to estimate the tissue transit time and dynamic changes in blood oxygenation on the arterial side of the vasculature; (part iii) Investigating the effect of the inhaled gas mixture (100% medical air and 100% oxygen) on the transverse decay of the labeled arterial blood water. In addition, we investigated the accuracy of T2 (ASL signal) estimation, given the possibility of outflow effects from fast flowing blood in the vessels (see Supplementary Appendix). This was done to confirm the validity of the measurement technique used for parts (i–iii) above.
Animal Preparation
All experiments were performed in accordance with the UK Home Office animals act (1986). Anesthesia was induced using 4% isoflurane in 100% medical air and was maintained at 2.5% isoflurane in 100% medical air while the animal was placed on an MRI compatible plastic probe. The rodent's head was secured using ear bars, a bite bar, and a nose cone to minimize motion during the data acquisition. Once the probe was fixed in the scanner, isoflurane concentration was reduced to 1.5% in 100% medical air. Body core temperature was measured throughout using a rectal thermometer (Small Animal Instruments Inc., Stony Brook, NY, USA) and maintained at 36.5±0.5°C using heated water tubing during the preparation and heated water tubing and warm air flow during the data acquisition period. Breathing rate was monitored throughout the acquisitions using a respiration pillow sensor (Small Animal Instruments Inc.). A scavenger pump was fixed inside the magnet bore to prevent isoflurane build-up.
Magnetic Resonance Imaging
All imaging was performed using a 9.4-T VNMRS horizontal bore scanner (Agilent Inc., Palo Alto, CA, USA). A 72-mm inner diameter volume coil was used for radio frequency transmission (Rapid Biomedical, Columbus, OH, USA) and signal was received using a 4-channel array head coil (Rapid Biomedical).
(Part i) Multiple Average Acquisitions at a Single Inflow Time (n=6)
Biexponential fits to in vivo MRI data are notoriously challenging. A very small amount of noise can introduce marked uncertainty into the model fit where the four unknown parameters are simultaneously estimated from the decay curve.29 This is particularly true when the decay constants of the different exponents are not markedly different. The intrinsically low SNR of ASL measurements make biexponential fitting particularly challenging in this application. The sensitivity of the fit to noise can be reduced by imposing upper or lower limits or alternatively ‘priors' (using a Bayesian approach) on the fitted parameters. However, this may introduce subjective bias into the fitted parameters. Given the novelty of the observation of biexponential transverse decay of the labeled blood water, the aim of the experiments described in this section was to acquire a multiple average, multiple subject, data set (at a single TI) of sufficient SNR to permit an unconstrained 4-parameter fit to the data (with reasonable precision in the fitted parameters) to investigate whether a 2 compartment model (consisting of the IV and EV tissue space) accurately describes the distribution of labeled water. Acquisitions were also performed with and without diffusion gradients (b value=50 s/mm2) to compare the IV/EV ratio (ASL signal) estimates from the biexponential transverse decay fitting approach (described above) with those generated using the more established diffusion-weighted approach.10, 11, 12
Six male Sprague-Dawley rats were used in these experiments (250±19 g). A single slice FAIR sequence with a two shot segmented spin-echo EPI readout was implemented with the following parameters: slice thickness=2 mm; slice refocusing width (see Supplementary Appendix)=6.32 mm; TR=2,500 ms; TI=1,500 ms; FOV=35 × 35 mm; matrix size=64 × 64; Width of slice-selective inversion=8 mm (chosen to ensure that there was no mismatch between the effect of the slice-selective and global inversion pulse on the imaging slice and based on previous measurements). Diffusion gradients (or ‘vascular crusher gradients') are applied on the slice-select axis with a b value of 5 s/mm2 to attenuate the signal from fast-flowing arterial spins that may flow through the slice. The imaging slice was positioned to be −3 mm caudal to the bregma in all of the imaging experiments described in this work. A hyperbolic secant adiabatic inversion pulse was used with a bandwidth of 22 kHz for both the slice-selective and global inversion.30 Images were acquired at 15 TE in a randomized order (19, 21, 36, 25, 48, 33, 65, 27, 30, 56, 23, 40, 60, 52, and 44 ms). Tagged and control images were acquired at each TE and the protocol was repeated for a total of 50 averages at each TE.
For each subject, a region of interest across the cortex was manually drawn (see Figure 2D) and the mean ASL signal as a function of TE was fitted to a biexponential model with no constraints or priors on the four fitted parameters. Fitting was performed at a range of start points to ensure that the fitted parameters were insensitive to the start point.
Figure 2.

The data acquired in part (i). (A) The mean cortical arterial spin labeling (ASL) and control signal (log scale) across the six subjects. (B) The mean cortical ASL signal (linear scale) across the six subjects with the line of best fit of equation 1 to the data. A monoexponential fit is also shown (red dashed line). (C) The mean cortical ASL (black lines) and control signal (red dashed lines) for each of the individual six subjects (log scale). (D) ASL images at increasing echo time (shown below each image) for a single subject. An anatomic reference image is also shown together with the cortical region of interest (ROI). The color reproduction of this figure is available at the Journal of Cerebral Blood Flow and Metabolism journal online.
 |
where ΔMA is the proportion of the signal in compartment A with transverse decay rate T2A and ΔMB is the relative proportion of compartment B with transverse decay rate T2B and ΔM is the mean cortical ASL signal. The ‘trust-region' fitting function was used in the Matlab curve fitting toolbox for all data fitting. This analysis was performed on each of the six subjects individually (where errors are reported as ±s.e.m. across the six subjects) and on the mean cortical signal across all six subjects (where errors are reported as the 68% confidence intervals (i.e., ±1 standard deviation) of the estimated parameters in the curve fitting). All confidence intervals were calculated using the ‘confint' function in the Matlab curve fitting toolbox. For each subject, the mean cortical control signal was fitted to a monoexponential T2 model to estimate T2control. In this study, we define the ‘control' images as those acquired after global inversion.
Fitting the cortical ASL and control signal in this way showed that the ‘slow decaying' T2 component closely matched the T2 of the control signal (see Results; part i). Based on this evidence, the T2 of the control signal was then assigned to represent the overall T2 of the EV tissue space. Although the arterial and capillary blood volume also contributes to the control signal, the contribution is negligible (arterial and capillary blood volume ∼2%). Furthermore, the venous side of the vasculature should not contribute to the control signal as this component will have almost completely decayed at the earliest TE (19 ms).22 Therefore, we then assign T2control to be the ‘slow' T2 value in subsequent biexponential fitting of the ASL signal for each subject.
The TE-dependent mean cortical ASL signal for each of the six subjects was fitted to a biexponential model with no constraints or priors on the three fitted parameters (note that T2EV is now assumed to equal T2control):
 |
where ΔMIV and ΔMEV are the relative proportions of the ASL signal deriving from the IV and EV compartment, respectively, and T2IV is the T2 of the ASL signal originating from the IV compartment. In this way, the control data that are simultaneously acquired are used to inform the biexponential fitting of the ASL signal for significantly improved precision in the T2IV and ΔMIV/(ΔMEV+ΔMIV) estimates. This analysis was performed for each subject and errors are expressed as the 68% confidence intervals (i.e., ±1 standard deviation of the estimated parameters) from the biexponential fit, with error propagation accounted for appropriately.
Bayesian information criteria (BIC) was used to investigate the most appropriate model fit to the ASL transverse decay curve. To calculate the maximum negative log-likelihood, an estimate of the standard error of the ΔM measurements at each TE was taken from the standard error across the 50 repeated measurements (of the mean cortical ASL signal) at the shortest TE. The BIC function in Matlab (Mathworks Inc., Natick, MA, USA) was used once the maximum negative log-likelihood was calculated for each model. Three models were tested: (1) a monoexponential; (2) a biexponential with four free parameters (equation 1), (3) a biexponential with three free parameters (equation 2) (i.e., T2slow=T2control). This comparison was performed separately for each of the six subjects.
To estimate ΔMIV/(ΔMEV+ΔMIV) using diffusion contrast, 50 averages were acquired (with the same sequence parameters as described above but at a single TE of 19 ms) with and without ‘vascular crusher gradients' on the slice-select axis with a b value of 50 s/mm2 to measure the IV to EV contribution to the ASL signal by using diffusion weighting (as described previously in Silva et al10 and Wang et al11) in five of the six animals. A b value of 50 s/mm2 was chosen based on Wang et al11. The b value of the images without ‘vascular crusher gradients' was 2 s/mm2 (the intrinsic b value of the sequence). The ΔMIV/(ΔMEV+ΔMIV) ratio of the ASL signal from the diffusion-weighted measurements was calculated for each subject using the following equation:
 |
where ΔMb=50 is the mean cortical ASL signal acquired with a b value of 50 s/mm2 and ΔMb=2 is the mean cortical ASL signal with a b value of 2 s/mm2. Possible differences between the ΔMIV/(ΔMEV+ΔMIV) ratio estimates from the diffusion and biexponential T2 fits were investigated using a paired t-test.
(Part ii) Multiple Inversion Time Acquisitions (n=9)
The aim of the imaging experiments described in this section was to measure the transverse decay of the labeled bolus over a number of TIs to investigate dynamic changes in the IV/EV source of the ASL signal together with possible changes in the value of T2IV (which we hypothesize to reflect the oxygen saturation of the IV contribution to the ASL signal) as a function of TI. In these experiments, we also aimed to precisely measure the arterial transit time, which can then be combined with the calculated ΔMIV/(ΔMEV+ΔMIV) ratios (calculated from fitting a two compartment biexponential transverse decay model to the ASL signal) to estimate tissue transit time (see below).
Nine male Sprague-Dawley rats were imaged in these experiments (224±30 g). The same FAIR sequence described in part (i) was implemented using the same TE as part (i) with a slice refocusing width of 6.32 mm (see Supplementary Figure A). Images were acquired at four inversion times (1,000, 1,500, 2,000, and 2,500 ms) with a TR equal to TI +1 second. Five averages were acquired at each TE and at each inversion time in an interleaved manner, and this was repeated four times for a total of 20 averages at each echo and inversion time. In addition, after each ‘five average' scan, five averages at TIs of 200, 300, 400, and 500 ms were acquired with a single TE of 19 ms. These images were acquired to precisely measure the arterial transit time (δa) (the time after labeling at which the tagged blood first arrives in the imaging slice), as described below.
For each subject, the control signal as a function of TE was fitted to a simple monoexponential model to estimate T2control at each TI. The mean cortical ASL signal at each TI was fitted to equation 2 to estimate T2IV and ΔMIV/(ΔMEV+ΔMIV). Errors for the individual subject, individual TI data, are expressed as the 68% confidence intervals of the ΔMIV/(ΔMEV+ΔMIV) and T2fast estimates from the biexponential fit to the mean cortical ASL signal.
Previous measurements of blood T2 as a function of oxygen saturation at 9.4 T reported in Lee et al22 were used to estimate the oxygen saturation of the IV compartment using the following equation:
The arterial transit time (δa) was estimated from the measurements at short TI (200, 300, 400, and 500 ms) since these measurements are very sensitive to the first arrival of labeled blood into the imaging slice. The mean cortical ASL signal at each of the short TIs was fitted to the following model, which takes advantage of the approximate linearity of the PASL signal as a function of TI at short TIs:31, 32
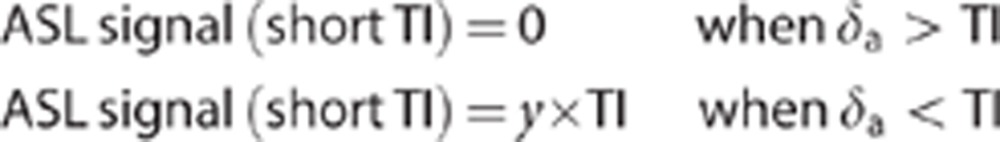 |
where y represents a multiplying factor that describes the linear increase in ASL signal as a function of TI (y is a linear multiplying factor given the approximately linear increase of the PASL signal at these short TIs).31, 32
To estimate tissue transit time, we used a two compartment perfusion model first derived by Alsop and Detre8 and later adapted by Wang et al33 to incorporate the duration of the tagged bolus (τ) (in a similar way to that described in Liu et al20 but for a PASL rather than CASL sequence).
Under the condition that TI>δ
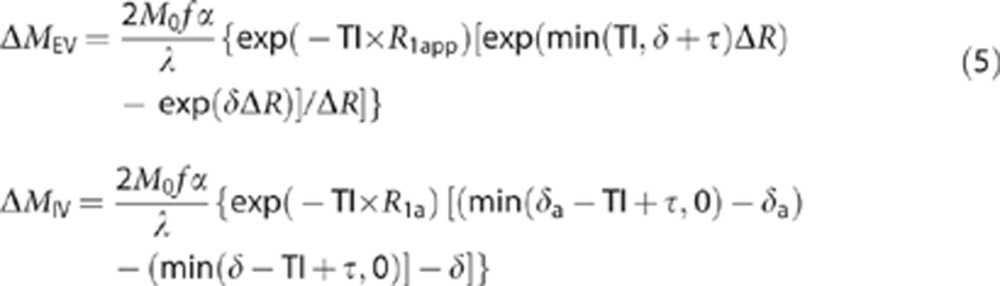 |
where f is the CBF, α is the inversion efficiency, M0 is the equilibrium magnetization, λ is the blood brain partition coefficient (0.9 from previous measurements34), R1app is the longitudinal relaxation of the tissue (previously measured to be 1/1.7s in the rat brain at 9.4 T from previous measurements in our laboratory), R1a is the longitudinal relaxation rate of blood (1/2.4s based on an earlier study35) and ΔR=R1app−R1a. The flow (f) and temporal width of the tagged bolus (τ) were estimated for each subject from the ΔM estimates at the four TIs (1,000, 1,500, 2,000, and 2,500 ms) at the shortest TE (19 ms) using the model described in Wang et al33 (equation 3) assuming instant exchange (i.e., δ=δa) as the estimated τ displays minimal sensitivity to the value of δ (within a reasonable range (i.e., δ=0.2–1 second) and f is not used in the calculation of δ (see below)). The ΔMIV/(ΔMIV+ΔMEV) estimates from equation 2 were substituted into equation 5. It can be seen that the 2M0f α/λ term cancels and the only unknown is the tissue transit time (δ) (since all other parameters are known/estimated). In this work, we define the exchange time to be δ–δa. The CBF, δa, and τ were calculated for each rat and the mean and s.e.m. are reported across the nine subjects. For each animal, the mean exchange time across all three TIs was calculated (the data at TI=2,500 ms were not included as the small IV component at this TI resulted in minimal precision in the biexponential fits (see Results)). The exchange time for each subject and the mean over all nine subjects are reported.
In addition, for each subject, the transverse decay of the ASL signal at the different inversion times was fitted to a simple monoexponential model. A monoexponential model was used to yield a single apparent T2 estimate (T2appΔM) that represents a simple summary measure of the transverse decay rate with no physiologic interpretation.
(Part iii) Investigating the Effect of the Inhaled Gas Mixture (100% Medical Air and 100% Oxygen) on the Transverse Decay of the Labeled Blood Water (n=3)
We hypothesized that the ‘fast T2' component of the ASL signal reflects the oxygen saturation of the labeled blood water on the arterial side of the IV space. To provide some validation of this hypothesis, we investigated whether T2IV would increase when the inspired gas mixture was changed from 100% medical air to 100% O2 (causing an increase in the blood oxygen saturation). Rats were anesthetized with isoflurane and positioned within the magnetic resonance scanner under 100% medical air. The same MRI sequence was implemented as described in part (i) with a TI of 1,500 ms. In all, 40 averages at each of the 15 TE were acquired with 100% medical air before the inhaled gas mixture was changed to 100% O2 and identical image acquisitions were performed after 5 minutes to allow the animals to adjust to the new inhaled gas mixture. Images were averaged and pair wise subtracted as before and the mean cortical control and ASL signal for each subject was fitted to a monoexponential model and equation 2, respectively, for both medical air and 100% O2. A paired Student's t-test was used to investigate statistically significant changes in T2IV between medical air and 100% O2.
Results
(Part i) Multiple Average Acquisitions at a Single Inflow Time (n=6)
Figure 2A shows the transverse decay of the mean cortical ASL and control signal across the six subjects (individually normalized to the mean ASL and control signal, respectively). The control signal (straight line) is accurately described by a monoexponential model with a T2 of 38.9 ms (38.74, 39.06). The ASL signal displays multiexponential behavior with the rate of transverse decay tending toward that of the rate of transverse decay of the control signal at later TE (TE ∼45 to 65 ms).
Figure 2B shows the mean cortical ASL signal across the six subjects together with the line of best fit of equation 1 to the data (linear scale). A monoexponential fit to the same data is also shown. Visual inspection reveals an excellent fit to the biexponential model, with an r2 of 0.9997. Figure 2B also shows the value of the four parameters that describe the biexponential model fit (i.e., equation 1) to the mean ASL signal (across the six subjects), together with the standard deviation of the estimated parameters from the curve fitting. The slow decaying T2 component of the mean curve in Figure 2B is found to closely match that of the mean T2 of the control signal (38.27±34 ms, 43 (68% confidence intervals of the fit)). When the mean cortical ASL signal from each of the individual subjects is fitted to equation 1, the mean T2slow component (excluding subject 6 that returned a T2 slow of 4,800 ms and was thus classed as an outlier) was 38.87±2.5 ms (s.e.m.), in good agreement with the mean T2 of the control signal from fitting each individual animal (38.1±0.2 ms (s.e.m.)) providing evidence that this component represents labeled blood water that has exchanged into the EV space. The mean T2fast from fitting the six subjects individually was 11.86±4.5 ms (s.e.m.). If this component represents the IV ASL component, then this suggests that the overall oxygen saturation of this compartment was 0.85 (using equation 4). From previous measurements of the oxygenation of labeled blood in the rat brain at several locations in the vascular tree21, this observation suggests that the signal derives from the small arteries and capillaries. This provides some evidence that the T2fast signal derives from the labeled blood water in the IV compartment.
Figure 2C shows the mean cortical ASL and control signal from each of the individual six subjects (log scale). Visual inspection indicates that the control signal for each subject is well described by a monoexponential transverse decay model (straight line). Visual inspection of Figure 2C also shows that multiexponential decay of the ASL signal is observable in each of the six animals and that in each case, the transverse decay rate of the ASL signal tends to that of the transverse decay rate of the control signal at longer TE (∼45 to 65 ms). Table 1 shows the estimated ΔMIV/(ΔMIV+ΔMEV) ratio, T2fast (and corresponding blood oxygenation) from the 3-parameter fit (equation 2) to each of the individual six subjects and shows good precision on an individual subject level. It should be noted that for the 4-parameter fit (i.e., equation 1), we found little evidence for precision in the curve fitting on an individual animal basis and found that evidence for precision was only apparent on a group level (i.e., the mean ASL transverse decay curve across the six subjects; Figure 2B) and the standard error in the four fitted parameters across the individual six subjects.
Table 1. The estimated IV/(IV+EV) ratio and T2fast (and corresponding arterial blood oxygenation) from the 3-parameter (i.e., T2slow=T2control) model fit to the ASL transverse decay curve for each subject.
| Subject | ΔMIV/(ΔMIV+ΔMEV) ratio | T2fast (ms) | Oxygenation (%) |
|---|---|---|---|
| 1 | 0.34±0.07 | 13±3 | 0.88±0.04 |
| 2 | 0.52±0.25 | 8±2 | 0.76±0.05 |
| 3 | 0.30±0.04 | 17±6 | 0.91±0.05 |
| 4 | 0.45±0.09 | 11±1 | 0.84±0.03 |
| 5 | 0.41±0.09 | 11±2 | 0.85±0.03 |
| 6 | 0.32±0.15 | 22±11 | 0.95±0.07 |
ASL, arterial spin labeling; EV, extravascular; IV, intravascular.
Errors represent the standard deviation of the fitted parameters.
Table 2 shows the BIC for the monoexponential and 3- and 4-parameter biexponential fit to the ASL transverse decay curves from the individual subjects. The BIC was lower for the biexponential models in comparison with the monoexponential model in five of the six subjects. The BIC was lower for the 3-parameter fit in comparison with the 4-parameter fit for all six subjects, indicating that this model is most appropriate for our data. This finding provides further evidence that the T2control is an appropriate approximation for T2slow indicating that this portion of the ASL signal originates from labeled blood water that has exchanged into the EV compartment.
Table 2. The BIC from model fits to the mean cortical ASL signal as a function of TE for each of the individual subjects in part (i).
| Subject | Monoexponential | Biexponential (4-parameter) | Biexponential (3-parameter) (T2slow=T2con) |
|---|---|---|---|
| 1 | 114.4 | 113.0 | 111.4 |
| 2 | 107.9 | 104.8 | 101.8 |
| 3 | 108.1 | 107.8 | 106.5 |
| 4 | 115.6 | 112 | 109.3 |
| 5 | 118.8 | 117.9 | 115.2 |
| 6 | 89.7 | 95.3 | 92.5 |
ASL, arterial spin labeling; BIC, Bayesian information criteria; TE, echo time.
The mean ΔMIV/(ΔMIV+ΔMEV) ratio calculated from the ASL images with and without diffusion gradients was 0.13±0.2, in excellent agreement with previous work.10, 11, 12, 18 The mean ΔMIV/(ΔMIV+ΔMEV) ratio as measured from the biexponential transverse decay curve was 0.39±0.04, which is significantly greater (P=0.0002) than the ratio as estimated from the diffusion sensitized measurements which may reflect the difficulty of separating the microvascular and capillary signal from the EV compartment by applying diffusion gradients on one direction as described by Kim and Kim.12
(Part ii) Multiple Inversion Time Acquisitions (n=9)
The mean (±s.e.m.) CBF, δa, and τ within the cortex of the nine subjects were 123±5 mL/100 g/min, 0.24±0.01 seconds, and 2.2±0.06 seconds, respectively. Figure 3 shows the transverse decay of the mean cortical ASL and control signal (log scale) at the four different inversion times (TIs). As the TI increases, the slow decaying T2 component (i.e., T2control) of the ASL signal appears to become more prominent, until at TI=2,500 ms, the transverse decay of the ASL signal becomes practically indistinguishable from the control signal. This suggests that at TI=2,500 ms, almost all the labeled blood water has exchanged into the EV tissue. The mean T2app estimates at variable TI are shown in Figure 3B.
Figure 3.

The data acquired in part (ii). (A) The mean cortical arterial spin labeling (ASL) and control signal (log scale) across all nine subjects at the five different inflow times (TIs). (B). The T2app of the ASL and control signal at increasing inversion time (0.5 to 2.5 seconds) across the nine subjects.
Figure 4 shows the estimated ΔMIV/(ΔMIV+ΔMEV) ratio and blood oxygenation with increasing TI and provides evidence for gradual exchange of the tagged spins from the IV to the EV compartment with increasing TI. Figure 4A shows that some of the individual subject biexponential fits to the mean cortical ASL signal at certain TIs find no evidence for a T2control component and return a monoexponential fit where T2fast=T2app with an erroneous ΔMIV/(ΔMIV+ΔMEV) ratio of 1. Based on the precise biexponential fits reported in part (i) (both within-subject and between subject; see Table 1), it is likely that this observation is a fitting error brought on by the decreased SNR of the measurements in part (ii) in comparison with part (i) (20 averages versus 50 averages). These five outliers are therefore not used in the calculation of exchange time. The ΔMIV/(ΔMIV+ΔMEV) ratio and oxygenation estimates at TI=2,500 ms are not shown because of poor fitting of the biexponential model to the data. The small IV contribution at this TI meant that the biexponential fitting showed minimal precision on an individual and between subject level. This shows the difficulty of obtaining accurate estimates of T2IV and ΔMIV/(ΔMIV+ΔMEV) when fitting a biexponential model to ASL data that only contains a small contribution from the IV compartment. The individual subject, mean cortical arterial transit time estimates were 259, 173, 234, 238, 256, 177, 277, 231, and 277 ms for the nine animals, respectively. The individual subject, mean cortical exchange time estimates were 434, 626, 267, 290, 312, 241, 274, 471, and 423 ms, respectively. The mean exchange time (±s.e.m.) was 370±42 ms.
Figure 4.

The data acquired in part (ii). (A) The estimated ΔMIV/(ΔMIV+ΔMEV) ratio of the arterial spin labeling (ASL) signal at increasing inflow time (TI) for each of the individual nine subjects. The red dots represent the median ΔMIV/(ΔMIV+ΔMEV) ratio across all nine subjects for each TI. (B) The estimated oxygen saturation of the IV ASL signal as a function of TI for each of the nine subjects. The red dots represent the median oxygen saturation across all nine subjects for each TI. EV, extravascular; IV, intravascular. The color reproduction of this figure is available at the Journal of Cerebral Blood Flow and Metabolism journal online.
(Part iii) Investigating the Effect of the Inhaled Gas Mixture (100% Medical Air and 100% Oxygen) on the Transverse Decay of the Labeled Blood Water (n=3)
Figure 5 shows the mean cortical ASL and control signal (log scale) as a function of TE when the rats were breathing 100% medical air and 100% O2. Visual inspection of Figure 5 clearly shows that the mean rate of transverse decay is reduced when the animal breaths 100% O2 in comparison with medical air. Again, it can be seen that the rate of transverse decay of the ASL signal in medical air and 100% O2 is very similar to the rate of transverse decay of the control signal in medical air and 100% O2, respectively, at later TE (TE ∼45 to 65 ms).
Figure 5.

The data acquired in part (iii). The mean cortical arterial spin labeling (ASL) (upper plots) and control (lower plots) signal under medical air (black solid line) and 100% O2 across the three subjects.
The ΔMIV/(ΔMIV+ΔMEV) ratio estimates for the three subjects breathing air and oxygen, respectively, were 0.45±0.49; 0.27±0.2; 0.35±0.15 and 0.97±43; 0.15±75; 0.52±7. T2fast for the three subjects breathing air and oxygen, respectively, was 7.1±2.8; 23±15; 14.7±9 and 38±51; 27.8±62; and 35.4±65. T2IV was significantly greater (P=0.03) under 100% O2 in comparison with medical air (33±3 ms (s.e.m.) and 15±5 ms (s.e.m.) respectively (oxygen saturation of ∼97.7% and ∼89.8%), which indicates that the oxygen saturation of the IV compartment increases when the animal breaths 100% O2 as expected. This result provides some validation that the fast decaying component of the ASL signal is representative of the oxygen saturation of labeled blood water in the IV compartment. The mean T2 of the control signal on medical air and 100% O2 was 38.4±0.6 ms and 40.8±0.5 ms, respectively (EV blood oxygen level-dependent effect36). The mean ΔMIV/(ΔMIV+ΔMEV) estimates on air and 100% O2 were 0.36±0.05 and 0.55±0.24, respectively. Note that the precision of the ΔMIV/(ΔMIV+ΔMEV) under 100% O2 is markedly lower than that under air because of the relative similarity of T2IV and T2control under 100% O2.
Discussion
In this work, we present a new, non-invasive method to estimate the time of exchange of blood water into cortical EV brain tissue together with the oxygen saturation on the arterial side of the vasculature in the rat brain. First, we acquired a multiple average, multiple-subject data set at a single TI to precisely sample the transverse decay of the labeled blood water to permit an unconstrained 4-parameter biexponential fit to the ASL transverse decay curve (the mean cortical ASL signal across the six subjects; Figure 2A) with good precision. We then sampled the transverse decay of the cortical ASL signal at four TIs and found evidence for gradual exchange of labeled blood water into EV brain tissue at increasing TI. By combining this multi TI data with measurements of δa, we were able to estimate the exchange time of blood water into rat cortical brain tissue (370 ms). Finally, we observed a marked difference in the value of T2IV when the inspired gas mixture was changed from medical air to 100% O2, which provides further validation of the sensitivity of this technique to estimate the arterial blood oxygenation (which may improve the accuracy of future quantitative fMRI studies).
The physiologic interpretation of multiexponential decay in MRI, whether as a function of TE or b value, remains highly controversial. Assigning molecular environments to fast or slow decaying magnetic resonance components should be very carefully considered. It is important to state that our data do not provide any evidence that a biexponential model more accurately describes the TE-dependent ASL signal than a triexponential model for example. These data show that the ASL signal at certain TIs is more accurately represented by a biexponential rather than monoexponential model. By acquiring a high SNR data set at TI=1,500 ms in part (i), we observed that the ‘slow' T2 component closely matched the T2 of the control signal (a close approximation to the T2 of the EV tissue, see Figures 2A and 2C) which provided evidence that the slow T2 component derived from labeled blood water that has exchanged into the EV cortical tissue. This is a result that to an extent is expected given the evidence for the timescale of exchange of blood water into EV tissue from previous positron emission tomography and ASL studies,37, 38, 10, 13 and these data provide further empirical validation using a novel technique. In addition, we observed that at TI=2,500 ms, T2appΔM closely matched the T2 of the control signal. Based on these observations, we proposed a two compartment model characterized by T2IV and T2EV (where T2EV was defined to be equal to T2control given the aforementioned evidence for the similarity of T2slow to T2control as estimated from the 4-parameter fit). In this way, the control data are used to inform the biexponential fitting of the ASL signal for significantly improved precision in the T2IV and ΔMIV/(ΔMEV+ΔMIV) estimates. The BIC analysis then indicated that this 3-parameter model (i.e., T2slow=T2control) was most appropriate to describe the cortical ASL measurements at variable TE. T2IV reflects the overall signal from the arterial vasculature (arteries, arterioles, and capillaries), which are likely to themselves have markedly different T2 values given the difference in blood oxygen saturation of these compartments.21 At this stage, we do not know the precise vascular origin of the IV ASL signal (i.e., how it is distributed within the large arteries, arterioles, and capillaries). Our estimates of T2IV reflect an ‘average' of the T2 of the labeled blood water on the arterial side of the vasculature. In future work, it may be possible to tease out the various IV contributions by combining multi TE measurements with carefully selected diffusion weighting. The two compartment biexponential model proposed in this work is somewhat unique as it describes two compartments of comparable volume distribution (depending on the TI) that are in slow exchange relative to the measurement time (maximum TE=65 ms),with moderately different T2 values (i.e., ∼15, 38 ms) in the rat brain at 9.4 T.
Once the labeled bolus arrives in the imaging slice (as ascertained from the estimates of δa generated from the short TI ASL measurements), our data suggest it takes 370±40 ms to exchange into the EV tissue. Therefore, for CBF quantification, we would recommend using a tissue transit time value equal to the arterial transit time +370 ms in the normal rat brain cortex. We report the time of exchange once the labeled bolus has reached the imaging slice rather than δ as this parameter is independent of δa which is heavily dependent on sequence parameters (e.g., location of tagging plane in CASL or width of slice-selective inversion in PASL). The arterial transit time is readily measurable in each subject using a multi TI approach or a prescan.39, 40 Unlike the arterial transit time and tissue transit time, the tissue exchange time (δ–δa) is independent of sequence parameters (with the exception of the b value of the sequence (see below for further discussion). It is important to note that in this work we examine the mean cortical ASL signal (given the high SNR demands of biexponential fitting to in vivo data). However, spatial averaging should be performed with caution to avoid averaging across regions with markedly different ASL kinetics. We found the pixel-by-pixel transit time estimates to be reasonable uniform in this slice of the rat cortex (interquartile range ∼0.1 second), however, this may not be the case when averaging across other brain structures.
The data presented in this work represent a novel methodology for estimating blood oxygen saturation of the arterial side of the vasculature. Many quantitative fMRI studies assume that arterial blood is 100% saturated with oxygen.26, 27, 28 The data from part (i) provide some evidence, in agreement with observations from recent invasive21 and noninvasive24 in vivo experimental data that this may not be an accurate assumption in the rat cortex. By combining the techniques presented in this work with sequences that can accurately measure the T2 of the blood on the venous side of the vasculature (e.g., Lu and Ge 41 and Guo and Wong42) it may be possible to map the oxygenation of the blood delivered to and deriving from the tissue enabling accurate mapping of quantitative oxygen consumption. In this study, we estimated arterial oxygen saturation from previous in vitro measurements of blood T2 as a function of blood oxygen saturation.22 It should be noted that the accuracy of the oxygen saturation measurements reported in this work is dependent on the accuracy and in vivo applicability of the data reported in Lee et al.22 In future studies, the accuracy of the technique may benefit from integration of a calibration protocol to measure the T2 and oxygen saturation of systemic arterial blood, such as an ‘arterial version' of the TRUST method described in Lu and Ge.41
Previously, we investigated the time course of delivery and exchange of labeled blood water in the rat brain by measuring the T2 of the CASL signal with and without diffusion weighting over a range of tagging durations and post-labeling delay times at 2.35 T.18 A multiecho CASL sequence was implemented with global 180° refocusing pulses to prevent underestimation of the T2appΔM because of fast moving spins in the vessels. Our measurements suggested that the T2 of labeled water in the vasculature (i.e., arterioles/capillaries) was similar to that of the tissue. This observation was concordant with previous in vivo measurements of oxygen saturation made by Vazquez et al21 (accepting the high sensitivity of the T2 to the oxygen saturation of blood at 3 T23). Given the similarity of the T2 of the labeled blood in the vasculature to that of the EV tissue, we were not able to estimate ΔMIV/(ΔMEV+ΔMIV) with any practical precision. However, at higher field strength (e.g., 9.4 T) the T2 of the blood becomes significantly less than that of the tissue (when the oxygen saturation is <100%).22 Thus, it becomes feasible to separate the IV and EV distribution of the ASL signal by sampling its transverse decay as we have shown in this work. In our previous study,18 we observed a consistently higher T2appΔM (with the inclusion of vascular crusher gradients with a b value of 40 s/mm2) in comparison with the T2 of the control signal. We interpreted this as evidence that the ASL signal was weighted toward the EC space (EV EC tissue space) relative to the IC (EV IC tissue space). In this study, we find that the slow T2 component of the ASL signal closely matches the T2 of the control signal which suggests that: (1) the signal is not weighted toward the EC space and (2) the labeled spins rapidly equilibrate between the IC and EC compartments on the timescale of the TIs. The reason that the ASL signal does not appear to be weighted to the EC space in this work may be because the EC and IC T2 values are similar at 9.4 T or it may reflect the differences in the labeling technique used and the associated magnetization transfer effects (FAIR in this work and CASL in Wells et al.18). This finding may also reflect incomplete suppression of the IV signal using diffusion gradients with a b value of 40 s/mm2 in our previous study.18 However, both the data presented in Wells et al.18 and the present study suggest that blood water rapidly exchanges into the IC space. This observation of rapid exchange into the IC space is in agreement with previous work20, 43 but interestingly is in contradiction to a recent study44 using PASL. This inconsistency may reflect differences in the timescale of blood water delivery and exchange between rats and humans.
The sequence used in this study had crusher gradients around the 180° refocusing pulse with a b value of 5 s/mm2. The estimated tissue exchange time is likely to be dependent on the b value chosen (greater at smaller b value and less at larger b value). However, a b value of 5 s/mm2 in the slice-select direction is fairly typical of that used in clinical and preclinical studies meaning that the results reported in this study should be relevant to the majority of past and future ASL applications.
The results of biexponential fitting to the ASL signal within regions of interest in the hippocampus and striatum (in the same imaging slice) were so imprecise (i.e., very high between animal variability because of the low SNR relative to the cortex) that the results from these regions were difficult to interpret (data not shown). Future studies aiming to measure multiexponential transverse decay of the ASL signal may wish to consider the following methodological adjustments (which may then allow regional comparisons): (1) using CASL for increased SNR of the ΔM measurements (compared with the PASL approach used in this work) and for more accurate definition of the duration of the tagged bolus (τ); (2) a greater dynamic range of TE (i.e., <19 ms and >65 ms) may improve the potential of the measurements to distinguish different T2 components and may allow extraction of more than two compartments, i.e., triexponential decay may be observable because of the likely differences in T2 values associated with different IV compartments (i.e., relatively short T2 for capillaries (low oxygen saturation) high T2 for arteries (relatively high oxygen saturation)); (3) in this study, isoflurane was chosen as it provides stable anesthesia over a long period and enables free breathing to allow the animal to autoregulate their physiology throughout the experiment without the need for external ventilation and blood gas sampling.45 In future studies, it would be interesting to investigate the relationship between blood gasses as measured systemically (typically taken from a canulated femoral or tail vein) and the T2IV estimates. For example, Vazquez et al21 measured 96.9% systemic oxygen saturation from the femoral vein and ∼90% oxygen saturation from the large arteries in the cortex. Similarly, future studies may consider measuring the hematocrit of the blood to more accurately relate T2IV estimates to oxygen saturation from previous in vitro studies (e.g., Vazquez et al21).
Several studies have found evidence for significant ‘flow-through' effects at high ‘CBF values' in the rodent brain.10, 32 In this scenario, tagged arterial blood passes directly to the venous side of the vasculature. If they are in the imaging slice at the time of image acquisition, then these labeled spins still contribute to the ASL signal (ΔM), which can lead to perfusion overestimation (since perfusion is defined as the rate of the delivery of blood to the capillary bed). The shortest TE used in this study was 19 ms. Therefore, it is likely that any venous contributions to the ASL signal will be negligible because of the short T2 at 9.4 T (T2 venous blood ∼4 ms21, 22) and the estimated δ will not be confounded by flow-through effects in this work. Indeed more generally, the short T2 of the venous compartment at 9.4 T may provide a straightforward means of avoiding this possible source of perfusion measurement error in future ASL studies of the rodent brain at high field since an appropriate choice of TE can minimize the venous contribution to the ASL signal. It is important to note that labeled blood water in larger arteries that is destined to perfuse more distal regions in the brain will confound the interpretation of our data. In this study, vascular crusher gradients with a b value of 5 s/mm2 are applied on the slice-select axis to attenuate the signal from large vessels to reduce the influence of this possible confounder. However, it is possible that this confound may still have some influence on the results reported in this investigation.
Previous studies have used diffusion sensitized measurements to separate the IV and EV components of the ASL signal. Wang et al11 suggested that diffusion gradients along a single direction with a b value of 50 s/mm2 were sufficient to separate the IV and EV contributions to the ASL signal. However, confocal microscopy studies have observed periods of zero flow in the capillaries.19 Furthermore, blood flow in the microvasculature and capillaries is generally considered to be isotropic. Consequently, this may suggest that capillary and microvascular flow contributed to the ‘low ADC' component in this work as suggested by Kim and Kim.12 Our measurements of ΔMIV/(ΔMEV+ΔMIV) using diffusion gradients are in excellent agreement with previous studies in the rat brain cortex.10, 12 However, the ΔMIV/(ΔMEV+ΔMIV) estimates from the biexponential fit to the transverse decay data yielded a significantly greater proportion of the ASL signal deriving from the IV space. This suggests that the technique presented in this study may provide a more accurate method of distinguishing the IV and EV compartments (as diffusion gradients applied on one direction with a b value of 50 mm/s may not fully attenuate signal from the microvasculature and capillaries). However, it should be pointed out that there is not a ‘Gold-Standard' measurement available to validate this assertion.
To conclude, in this study we present a new technique to estimate the exchange time of blood water into cortical brain tissue together with the oxygen saturation on the arterial side of the vasculature. Importantly, this technique is readily applicable to human studies at high field strength to map exchange times in healthy and pathologic tissue (although long imaging times may be necessary to achieve an adequate SNR for biexponential fitting). These estimates of exchange times in humans could then inform future clinical studies for more accurate measurement of CBF using ASL methods.
Acknowledgments
The authors would like to thank Paul Kinchesh, Chris Kember and Fabio Mura at Agilent Technologies for their assistance with EPI development and MRI system maintenance. The authors would like to thank Adrienne Campbell and Simon Walker-Samuel for their help with the BIC calculations. The authors would also like to thank Nicholas Davies and Colleagues.
The authors declare no conflict of interest.
Footnotes
Supplementary Information accompanies the paper on the Journal of Cerebral Blood Flow & Metabolism website (http://www.nature.com/jcbfm)
Supplementary Material
References
- Morse OC, Singer JR. Blood Velocity Measurements in Intact Subjects. Science. 1970;170:440–441. doi: 10.1126/science.170.3956.440. [DOI] [PubMed] [Google Scholar]
- Detre JA, Leigh JS, Williams DS, Koretsky AP. Perfusion imaging. Magn Res Med. 1992;23:37–45. doi: 10.1002/mrm.1910230106. [DOI] [PubMed] [Google Scholar]
- Williams DS, Detre JA, Leigh JS, Koretsky AP. Magnetic resonance imaging of perfusion using spin inversion of arterial water. Proc Natl Acad Sci. 1992;89:212–216. doi: 10.1073/pnas.89.1.212. [DOI] [PMC free article] [PubMed] [Google Scholar]
- Wolf RL, Detre JA. Clinical neuroimaging using arterial spin-labeledperfusion magnetic resonance imaging. Neurotherapeutics. 2007;4:346–359. doi: 10.1016/j.nurt.2007.04.005. [DOI] [PMC free article] [PubMed] [Google Scholar]
- Detre JA, Rao H, Wang DJ, Chen YF, Wang Z. Applications of arterial spin labeled MRI in the brain. J Magn Reson Imaging. 2012;35:1026–1037. doi: 10.1002/jmri.23581. [DOI] [PMC free article] [PubMed] [Google Scholar]
- Kwong KK, Belliveau JW, Chesler DA, Goldberg IE, Weisskoff RM, Poncelet BP, et al. Dynamic magnetic resonance imaging of human brain activity during primary sensory activation. Proc Natl Acad Sci. 1992;89:5675–5679. doi: 10.1073/pnas.89.12.5675. [DOI] [PMC free article] [PubMed] [Google Scholar]
- Kim SG. Quantification of regional cerebral blood flow change by flow sensitive alternating inversion recovery (FAIR). Application to functional mapping. Magn Reson Med. 1995;34:293–301. doi: 10.1002/mrm.1910340303. [DOI] [PubMed] [Google Scholar]
- Alsop DC, Detre JA. Reduced transit-time sensitivity in noninvasive magnetic resonance imaging of human cerebral blood flow. J Cereb Blood Flow Metab. 1996;16:1236–1249. doi: 10.1097/00004647-199611000-00019. [DOI] [PubMed] [Google Scholar]
- Larsson HB, Tofts PS. Measurement of blood–brain barrier permeability using dynamic Gd-DTPA scanning—a comparison of methods. Magn Reson Med. 1992;24:174–176. doi: 10.1002/mrm.1910240119. [DOI] [PubMed] [Google Scholar]
- Silva AC, Williams DS, Koretsky AP. Evidence for the exchange of arterial spin labeled water with tissue water in rat brain from diffusion-sensitized measurements of perfusion. Magn Reson Med. 1997a;38:232–237. doi: 10.1002/mrm.1910380211. [DOI] [PubMed] [Google Scholar]
- Wang J, Fernandez-Serra MA, Wang S, St. Lawrence KS. When perfusion meets diffusion: in vivo measurements of water permeability in human brain. J Cereb Blood Flow Metab. 2007;27:839–849. doi: 10.1038/sj.jcbfm.9600398. [DOI] [PubMed] [Google Scholar]
- Kim T, Kim SG. Quantification of cerebral arterial blood volume using arterial spin labeling with intravoxel incoherent motion-sensitive gradients. Magn Reson Med. 2006;55:1047–1057. doi: 10.1002/mrm.20867. [DOI] [PubMed] [Google Scholar]
- Silva AC, Zhang WG, Williams DS, Koretsky AP. Estimation of water extraction fractions in rat brain using magnetic resonance measurement of perfusion with arterial spin labeling. Magn Reson Med. 1997b;37:58–68. doi: 10.1002/mrm.1910370110. [DOI] [PubMed] [Google Scholar]
- Kim T, Kim SG. Quantification of cerebral arterial blood volume and cerebral blood flow using MRI with modulation of tissue and vessel (MOTIVE) signals. Magn Reson Med. 2005;54:333–342. doi: 10.1002/mrm.20550. [DOI] [PubMed] [Google Scholar]
- Zaharchuk G, Bogdanov AA, Marota JJA, Shimizu-Sasamata M, Weisskoff RM, et al. Continuous Assessment of Perfusion by Tagging Including Volume and water Extraction (CAPTIVE): a steady-state contrast agent technique for measuring blood flow, relative blood volume fraction and the water extraction fraction. Magn Reson Med. 1998;40:666–678. doi: 10.1002/mrm.1910400504. [DOI] [PubMed] [Google Scholar]
- Chappell MA, MacIntosh BJ, Donahue MJ, Guenther M, Jezzard P, Woolrich MW. Separation of macrovascular signal in multi-inversion time arterial spin labelling MRI. Magn Res Med. 2010;63:1357–1365. doi: 10.1002/mrm.22320. [DOI] [PubMed] [Google Scholar]
- Schad LR, Brix G, Semmler W, Guckel F, Lorenz WJ. Two-exponential analysis of spin-spin proton relaxation time in MR imaging using surface coils. Magn Reson Imaging. 1989;7:357–362. doi: 10.1016/0730-725x(89)90484-0. [DOI] [PubMed] [Google Scholar]
- Wells JA, Lythgoe MF, Choy M, Gadian DG, Ordidge RJ, Thomas DL. Characterising the Origin of the Arterial Spin Labelling Signal in MRI using a Multi-Echo Acquisition Approach. J Cereb Blood Flow Metab. 2009;29:1836–1845. doi: 10.1038/jcbfm.2009.99. [DOI] [PubMed] [Google Scholar]
- Villringer A, Them A, Lindauer U, Einhaaupl K, Dirangl U. Capillary perfusion of the rat brain cortex: an in vitro confocal microscopy study. Circ Res. 1994;75:55–62. doi: 10.1161/01.res.75.1.55. [DOI] [PubMed] [Google Scholar]
- Liu P, Uh J, Lu H. Determination of spin compartment in arterial spin labeling MRI. Magn Reson Med. 2011;65:120–127. doi: 10.1002/mrm.22601. [DOI] [PMC free article] [PubMed] [Google Scholar]
- Vazquez AL, Fukuda M, Tasker ML, Masamoto K, Kim SG. Changes in cerebral arterial, tissue and venous oxygenation with evoked neural stimulation: implications for hemoglobin-based functional neuroimaging. J Cereb Blood Flow Metab. 2010;30:428–439. doi: 10.1038/jcbfm.2009.213. [DOI] [PMC free article] [PubMed] [Google Scholar]
- Lee SP, Silva AC, Ugurbil K, Kim SG. Diffusion-weighted spin-echo fMRI at 9.4T: microvascular/tissue contribution to BOLD signal changes. Magn Reson Med. 1999;42:919–928. doi: 10.1002/(sici)1522-2594(199911)42:5<919::aid-mrm12>3.0.co;2-8. [DOI] [PubMed] [Google Scholar]
- Zhao JM, Clingman CS, Narvainen MJ, Kauppinen RA, van Zijl PCM. Oxygenation and hematocrit dependence of transverse relaxation rates of blood at 3T. Magn Reson Med. 2007;58:592–596. doi: 10.1002/mrm.21342. [DOI] [PubMed] [Google Scholar]
- Meng Y, Vazquez A, Kim SG.In vivo arterial blood T2 measurement with arterial spin labeling at 9.4 Tesla Proceedings of the International Society for Magnetic Resonance in Medicine, Montreal 2011. abstract no. 372.
- Dickson JD, Ash TW, Williams GB, Harding SG, Carpenter TA, Menon DK, et al. Quantitative BOLD: the effect of diffusion. J Magn Reson Imaging. 2010;32:953–961. doi: 10.1002/jmri.22151. [DOI] [PubMed] [Google Scholar]
- An H, Lin W, Celik A, Lee YZ. Quantitative measurements of cerebral metabolic rate of oxygen utilization using MRI: a volunteer study. NMR Biomed. 2001;14:441–447. doi: 10.1002/nbm.717. [DOI] [PMC free article] [PubMed] [Google Scholar]
- He X, Zhu M, Yablonskiy DA. Validation of oxygen extraction fraction measurement by qBOLD technique. Magn Reson Med. 2008;60:882–888. doi: 10.1002/mrm.21719. [DOI] [PMC free article] [PubMed] [Google Scholar]
- He X, Yablonskiy DA. Quantitative BOLD: Mapping of human cerebral deoxygenated blood volume and oxygen extraction fraction: default state. Magn Reson Med. 2007;57:115–126. doi: 10.1002/mrm.21108. [DOI] [PMC free article] [PubMed] [Google Scholar]
- King MD, van Bruggen N, Busza AL, Houseman J, Williams SR, Gadian DG. Perfusion and diffusion MR imaging. Magn Reson Med. 1992;24:288–301. doi: 10.1002/mrm.1910240210. [DOI] [PubMed] [Google Scholar]
- Wells JA, Siow B, Lythgoe MF, Thomas DL. The importance of RF bandwidth for effective tagging in pulsed arterial spin labelling MRI at 9.4T. NMR Biomed. 2012;25:1139–1143. doi: 10.1002/nbm.2782. [DOI] [PubMed] [Google Scholar]
- Buxton RB, Frank LR, Wong EC, Siewert B, Warach S, Edelman RR. A general kinetic model for quantitative perfusion imaging with arterial spin labelling. Magn Reson Med. 1998;40:383–396. doi: 10.1002/mrm.1910400308. [DOI] [PubMed] [Google Scholar]
- Wegener S, Wu WC, Perthen JE, Wong EC. Quantification of rodent cerebral blood flow (CBF) in normal and high flow states using pulsed arterial spin labelling magnetic resonance imaging. J Magn Reson Imaging. 2007;26:855–862. doi: 10.1002/jmri.21045. [DOI] [PubMed] [Google Scholar]
- Wang J, Alsop DC, Li L, Listerud J, Gonzalez-At JB, Schnall MD, et al. Comparison of quantitative perfusion imaging using arterial spin labelling at 1.5 and 4.0 Tesla. Magn Reson Med. 2002;48:242–254. doi: 10.1002/mrm.10211. [DOI] [PubMed] [Google Scholar]
- Herscovitch P, Raichle ME. What is the correct value for the bloodbrain partition coefficient for water. J Cereb Blood Flow Metab. 1985;5:65–69. doi: 10.1038/jcbfm.1985.9. [DOI] [PubMed] [Google Scholar]
- Dobre MC, Uğurbil K, Marjanska M. Determination of blood longitudinal relaxation time (T1) at high magnetic field strengths. Magn Reson Imaging. 2007;25:733–735. doi: 10.1016/j.mri.2006.10.020. [DOI] [PubMed] [Google Scholar]
- Lu H, van Zijl PCM. Experimental measurement of extravascular parenchymal BOLD effects and tissue oxygen extraction fractions using multi-echo VASO fMRI at 1.5 and 3.0T. Magn Reson Med. 2005;53:808–816. doi: 10.1002/mrm.20379. [DOI] [PubMed] [Google Scholar]
- Oldendorf WH. Measurement of brain uptake of radiolabeled substancesusing a tritiated water internal standard. Brain Res. 1970;24:372–376. doi: 10.1016/0006-8993(70)90123-x. [DOI] [PubMed] [Google Scholar]
- Ter-Pogossian MM, Eichling JO, Davis DO, Welch MJ, Metzger JM. The determination of regional cerebral blood flow by means of water labeled with radioactive oxygen 15. Radiology. 1969;93:31. doi: 10.1148/93.1.31. [DOI] [PubMed] [Google Scholar]
- Wells JA, Lythgoe MF, Gadian DG, Ordidge RJ, Thomas DL. In-vivo Hadamard Encoded Continuous Arterial Spin Labelling (H-CASL) Magn Reson Med. 2010;63:1111–1118. doi: 10.1002/mrm.22266. [DOI] [PubMed] [Google Scholar]
- Dai W, Robson PM, Shankaranarayanan A, Alsop DC. Reduced resolution transit delay prescan for quantitative continuous arterial spin labeling perfusion imaging. Magn Reson Med. 2012;67:1252–1265. doi: 10.1002/mrm.23103. [DOI] [PMC free article] [PubMed] [Google Scholar]
- Lu H, Ge Y. Quantitative evaluation of oxygenation in venous vessels using T2-Relaxation-Under-Spin-Tagging MRI. Magn Reson Med. 2008;60:357–363. doi: 10.1002/mrm.21627. [DOI] [PMC free article] [PubMed] [Google Scholar]
- Guo J, Wong EC.Venous oxygenation mapping using velocity-selective excitation and arterial nulling Magn Res Med 2012. doi: 10.1002/mrm.24145 [DOI] [PMC free article] [PubMed]
- Quirk JD, Bretthorst GL, Duong TQ, Snyder AZ, Springer CS, Ackerman JH, et al. Equilibrium water exchange between the intra- and extracellular spaces of mammalian brain. Magn Reson Med. 2003;50:493–499. doi: 10.1002/mrm.10565. [DOI] [PubMed] [Google Scholar]
- He X, Raichle ME, Yablonskiy DA. Transmembrane dynamics of water exchange in human brain. Magn Reson Med. 2012;67:562–571. doi: 10.1002/mrm.23019. [DOI] [PMC free article] [PubMed] [Google Scholar]
- Liu ZM, Schmidt KF, Sicard KM, Duong TQ. Imaging oxygen consumption in forepaw somatosensory stimulation in rats under isoflurane anesthesia. Magn Reson Med. 2004;52:277–285. doi: 10.1002/mrm.20148. [DOI] [PMC free article] [PubMed] [Google Scholar]
Associated Data
This section collects any data citations, data availability statements, or supplementary materials included in this article.