

Abstract
Gene expression is controlled by the joint effect of (i) the global physiological state of the cell, in particular the activity of the gene expression machinery, and (ii) DNA-binding transcription factors and other specific regulators. We present a model-based approach to distinguish between these two effects using time-resolved measurements of promoter activities. We demonstrate the strength of the approach by analyzing a circuit involved in the regulation of carbon metabolism in E. coli. Our results show that the transcriptional response of the network is controlled by the physiological state of the cell and the signaling metabolite cyclic AMP (cAMP). The absence of a strong regulatory effect of transcription factors suggests that they are not the main coordinators of gene expression changes during growth transitions, but rather that they complement the effect of global physiological control mechanisms. This change of perspective has important consequences for the interpretation of transcriptome data and the design of biological networks in biotechnology and synthetic biology.
Keywords: bacterial physiology, carbon metabolism, E. coli , gene regulatory networks, systems biology
Introduction
Bacterial cells continuously adjust gene expression in response to challenges from their environment. These adjustments involve transcription factors that sense metabolic signals and specifically activate or inhibit target genes. Several hundreds of transcription factors have been identified in E. coli (Keseler et al, 2011): while some respond to a particular stress and have only a few targets, others coordinate the expression of hundreds of genes across a variety of cellular functions. Well-known examples of the latter are global regulators of transcription, such as Crp, Fis, and RpoS (σS) (Gottesman, 1984; Martinez-Antonio and Collado-Vides, 2003; Perrenoud and Sauer, 2005).
In addition to DNA-binding transcription factors, small regulatory RNAs, and other specific regulators, gene expression also responds to changes in the overall physiological state of the cell. The latter comprises a variety of physiological parameters that have an impact on the rate of transcription and translation, such as the concentrations of (free) RNA polymerase and ribosome, gene copy number, and the size of amino acid and nucleotide pools. Contrary to specific regulators, these parameters affect the expression of all genes. Classical studies in bacterial physiology (Schaechter et al, 1958; Kjeldgaard, 1961; Neidhardt and Fraenkel, 1961; Bremer and Dennis, 1996) reviewed by Maaløe and Kjeldgaard (1966) and Scott and Hwa (2011), have demonstrated that in steady-state conditions the growth rate can be used to characterize this global physiological state.
The joint control of gene expression by both specific effects of transcription factors and global effects of the physiological state has received relatively little attention thus far. Among the exceptions, we cite the work of Klumpp et al (2009), who have shown that the steady-state concentration of proteins in simple network architectures depends on the combined action of transcription factors and the growth rate. Dennis et al (2004) review the large amount of data on the control of rRNA synthesis in E. coli accumulated over several decades. They propose a model that integrates both growth rate-dependent effects and the regulatory control exerted by transcription factors. Notwithstanding the insights gained from these and other studies (Snoep et al, 2002; Tadmor and Tlusty, 2008; Tan et al, 2009), they are limited in two respects. First, they consider the control of gene expression at steady state, not during transitions between physiological states. Second, there is currently no data set available that allows to study the contributions of transcription factors and global physiological effects at the level of a regulatory network.
Here, we address the above questions in the context of carbon metabolism in Escherichia coli. We study a central regulatory circuit in this complex system, consisting of two pleiotropic regulators of the cell: Crp (Gosset et al, 2004) and Fis (Bradley et al, 2007). These transcription factors regulate, in response to the availability of carbon sources in the environment, a large number of genes encoding enzymes in central metabolism (Gutierrez-Ríos et al, 2007; Baldazzi et al, 2010). An example is the gene acs (Wolfe, 2005). This gene encodes the enzyme acetyl-CoA synthetase (Acs), which converts acetate to acetyl-CoA. acs is strongly expressed in the absence of glucose and is thus an excellent indicator of the transcriptional response of carbon metabolism to a growth-phase transition. Figure 1 shows the dense regulatory structure of the network which, in addition to the transcription factors, involves cyclic AMP (cAMP). This signaling metabolite forms a complex with Crp that binds to the promoter region of target genes (Kolb et al, 1993).
Figure 1.

Central regulatory circuit involved in the control of E. coli carbon metabolism, consisting of the two pleiotropic transcription factors Crp and Fis. Crp is activated by the signaling metabolite cAMP, which accumulates upon the diminution of glycolytic fluxes. Crp·cAMP stimulates the expression of the gene acs, an effect counteracted by Fis (Wolfe, 2005). In addition, Crp·cAMP and Fis cross-regulate and auto-regulate the expression of their own genes as well as a large number of other genes (Hanamura and Aiba, 1991; Ninnemann et al, 1992; Ishizuka et al, 1994; González-Gil et al, 1998; Nasser et al, 2001; Keseler et al, 2011). While Fis inhibits the transcription of crp and its own gene, Crp·cAMP inhibits the transcription of fis and both activates and inhibits the transcription of crp, depending on its binding site in the promoter region. The global physiological state affects the expression of all genes in the network. Degradation and growth dilution balance protein synthesis. The effect of the growth rate on protein dilution has been omitted in order not to clutter the figure. Genes are shown in blue and promoters in red. Specific regulatory interactions are indicated by dashed lines and the effect of the physiological state by solid lines.
How does the regulatory circuit in Figure 1 respond to glucose depletion by dynamically adapting the expression of its genes? And what are the relative contributions of transcription factors and global physiological parameters to the observed changes in gene expression? To answer these questions in a quantitative way, we monitored the promoter activity of the genes in real time and in vivo, by means of GFP reporters. In parallel, a GFP reporter driven by a constitutive promoter was used to assay the time-varying physiological state. We show that a simple, parameterless mathematical model, in combination with careful data analysis procedures, can be used to separate the variation of the promoter activity of the genes into a part due to global physiological control and a part due to the effect of transcription factors. To verify if the latter part can be accounted for by known regulators, in particular Crp·cAMP, we extended the model and measured the time-varying concentration of cAMP. The above experiments were repeated under various physiological and genetic perturbations.
The results of the above analysis provide novel insights into the response of the bacterial cell to nutritional stress. In particular, we show that the dynamic control of gene expression is shared between a signaling metabolite cAMP and the global physiological state of the cell, that is, the time-varying activity of the gene expression machinery and other global parameters. The DNA-binding transcription factors were not found to exert a significant control on gene expression. This observation is surprising, because Fis and Crp are located at the highest level of the hierarchical transcription regulation network in E. coli. Their mutual regulatory interactions form a cross-inhibition motif, associated with bistability in synthetic circuits as well as in naturally evolved networks (Gardner et al, 2000; Sánchez and Thieffry, 2001; Manu et al, 2009; Graham et al, 2010). It suggests a physiological role for the pattern of regulatory interactions, in that the circuit may function as a regulatory master switch controlling the adaptation of gene expression in response to carbon depletion and other stresses (Ropers et al, 2006).
Our data do not provide evidence that such a master switch is operative in the cell. More generally, they call for a reappraisal of the role of transcription factors in the coordination of gene expression changes during growth transitions. Whereas transcriptional regulatory networks have sometimes been seen as the driving force of the genome-wide adaptation of gene expression, it may be more appropriate to view them as complementing the global control exerted by the physiological state of the cell. This shift in perspective, which places an often-neglected aspect of gene regulation in the foreground, has an obvious theoretical interest. However, it is also important in practice for the interpretation of transcriptome data (Regenberg et al, 2006) and the (re)design of biological systems in biotechnology and synthetic biology (Shachrai et al, 2010; Scott et al, 2010; Carrera et al, 2011). The method we present to quantify the relative contributions to the control of gene expression by specific and global physiological effects can be easily transposed to other regulatory systems in bacteria and higher organisms.
Results
Monitoring the dynamic response of the network
To experimentally characterize the dynamic response of the network to glucose depletion, we systematically measured the input signals of the network in Figure 1, the global physiological state of the cell and the concentration of cAMP. In parallel, we monitored the outputs of the system, the time-varying activities of the acs, crp, and fis promoters (Figure 2).
Figure 2.

Real-time monitoring of gene expression. Bacteria recovered from glycerol stock are grown overnight in minimal medium with glucose, and then strongly diluted into the same medium in a 96-well microplate. When the culture has reached a quasi-steady state, after about 500 min, we monitor the growth of the bacterial population and the activity of a fluorescent reporter gene carried on a low-copy reporter plasmid. The primary absorbance and fluorescence data are treated by data analysis procedures, yielding the time-varying quantification of the growth rate and the promoter activities. Source data for this figure is available on the online supplementary information page
Batch cultures of bacteria were grown in a microplate in minimal medium with glucose. We started the measurements after about 600 min (corresponding to about seven generations) when the system had reached a well-defined initial state. The shape of the absorbance curves is typical for growth in minimal medium: exponential growth of the bacterial population, followed by a sharp drop of the growth rate due to glucose exhaustion (Figure 3A).
Figure 3.
Experimental monitoring of physiological parameters. (A) Growth rate (·, blue) as computed from the measured absorbance of a bacterial culture (-, red). (B) Intracellular concentration of cAMP in wild-type strain (·, blue) as derived from measured external concentrations of cAMP. (C) Idem for Δfis strain. The data shown in the plots are the mean of 3–4 experimental replicates, with confidence intervals computed from the standard error of the mean (see Materials and methods). Source data for this figure is available on the online supplementary information page.

At chosen time points along the growth curve, we determined the concentration of external cAMP using a luminescence-based immunoassay. From these measurements, we estimated the internal cAMP concentration by means of a kinetic model accounting for cAMP import and export, as explained in Supplementary Section S3 and Supplementary Figures S3 and S4. The shape of the intracellular cAMP concentration profile agrees very well with other, direct measurements (Makman and Sutherland, 1965; Kao et al, 2004). cAMP concentrations are low in the presence of glucose, rapidly accumulate at the end of exponential growth, when glucose is exhausted, and return to a lower steady-state level at the end of the transition (Figure 3B).
In parallel, we monitored the promoter activities of the genes in the network using reporter plasmids carrying a transcriptional fusion of a gfp reporter gene with the fis, crp, and acs promoters. The results are shown in Figure 4A–C. The promoter activities of fis and crp gradually decrease at the end of exponential phase, and then remain at a basal level after the exhaustion of glucose, with a slight recovery toward the end of the experiment. The latter may be a consequence of the consumption of acetate excreted during growth on glucose. The observed promoter activity of fis is in good agreement with northern blot quantifications of mRNA (de Jong et al, 2010). The activity pattern of acs in exponential phase seems to decrease as well, but as the fluorescence signal is close to the background level, the confidence intervals are wide and do not allow an unambiguous conclusion to be drawn. However, contrary to what was observed for fis and crp, the expression of acs is induced when glucose is exhausted at about 700 min. This observation is consistent with other reports in the literature (Wolfe, 2005).
Figure 4.
Experimental monitoring of transcriptional response of network. (A) Time-varying activity of fis promoter (·, blue), derived from GFP reporter data, and absorbance (solid line, red). (B–E) Idem for the activities of the crp, acs, and rpoS promoters, as well as the activity of the pRM promoter of phage λ. The latter promoter is constitutive in our conditions and reflects the global physiological state of the cell. The primary fluorescence data for these curves are shown in Supplementary Section S9 and Supplementary Figure S9. (F) Idem for the activity of the acs promoter in a Δfis strain. Source data for this figure is available on the online supplementary information page.

In steady-state conditions, the global physiological parameters of the cell correlate with the growth rate (Bremer and Dennis, 1996). The time-varying physiological state of the cell, such as the concentration of free RNA polymerase, is difficult to measure though (Klumpp and Hwa, 2008). As an indirect read-out of the global physiological state we therefore decided to use a constitutive promoter, whose activity is controlled by the transcription and translation machinery and the pools of precursor metabolites, but not by any particular transcription factor (Liang et al, 1999).
As our constitutive promoter, we chose the pRM promoter of phage λ. The transcription factors known to bind to this promoter, CI and Cro, are specific to the phage and are not present in uninfected E. coli cells (Oppenheim et al, 2005). A priori, the activity of pRM therefore seems a good indicator of changes in the overall physiological state of the cell. As a control of the suitability of the choice of pRM, we repeated the experiment of Figure 4 with another promoter believed to be constitutively transcribed. In particular, we replaced pRM by the ptet promoter (Klumpp et al, 2009). The time-varying activities of the two promoters were observed to agree well in our conditions, both qualitatively and quantitatively (Supplementary Section S4; Supplementary Figure S5). This coincidence makes it unlikely that pRM is controlled by an unknown regulatory factor (as such a factor would have to impact both promoters in exactly the same way). As a further control, we also excluded that cAMP has a significant regulatory effect on transcription from the pRM promoter (Supplementary Section S5; Supplementary Figure S6).
We thus conclude that variations in the activity of the pRM promoter reflect changes in the global physiological parameters of the cell. This allows us to monitor the physiological state of the cell in real time and in vivo during the growth transition. The promoter activity computed from the fluorescence signal is shown in Figure 4E. The activity of the pRM promoter is seen to be approximately stationary in exponential phase and stabilizing to a lower value after growth arrest.
The advantage of plasmid-borne reporters is that they generally generate a strong signal, well beyond the autofluorescence background. However, it is important to bear in mind that the plasmid copy number may vary with the growth rate (Lin-Chao and Bremer, 1986) and thus introduce a quantitative bias. We measured the variation of the number of plasmids per chromosomal equivalent of DNA across growth phases using quantitative PCR (qPCR), and found that it increases up to a factor of 2 during the growth transition (Supplementary Section S6; Supplementary Figure S7). This does not invalidate the qualitative shape of the profiles, especially the fall in activity of the constitutive promoter (which is actually underestimated). However, to achieve quantitative precision, we need to develop an analysis method that corrects for this bias (see below).
Dissection of the control of gene expression
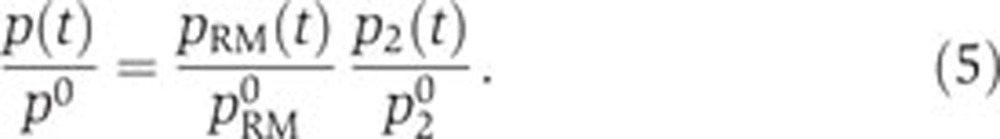
To analyze the relative contributions of transcription factors and the physiological state to the transcriptional response of the E. coli regulatory circuit, we use a simple mathematical model of promoter activity. Let p(t) denote the promoter activity (M min−1) as a function of time t (min). We write
 |
with k (M min−1) representing the maximum promoter activity. The dimensionless term p1(t), for convenience assumed to vary between 0 and 1, quantifies the modulation of the promoter activity by the global physiological state, for instance through the availability of free RNA polymerase (Klumpp et al, 2009; Kotte et al, 2010). The dimensionless term p2(t), also varying between 0 and 1, accounts for the effect of transcription factors and other specific regulators, and may take the form of sigmoidal regulation functions often found in gene network modeling (de Jong, 2002; Bintu et al, 2005).
To eliminate the unknown constant k, we normalize Equation (1) with respect to a reference state at time t0. In what follows, the reference state is chosen at the growth transition, indicated by the peak in acs activity, but other reference states are possible as well. We define p0=p(t0),  , from which it follows with Equation (1) that
  . Division of p(t) by p0 gives, after a logarithmic transformation,
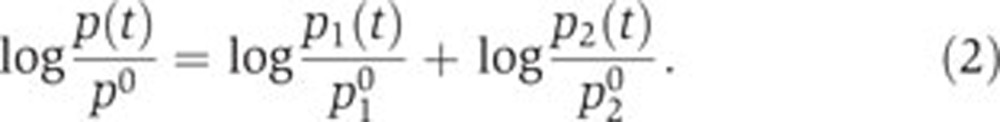 |
Two special cases of this model, which allow to answer two questions of specific biological interest, will be examined in more detail.(i) When the global physiological effect is dominant, that is, when the effect of the transcription factors is negligible, we have  and the second term in the right-hand side of Equation (2) approximates 0. Bearing in mind that the global effect is measured by the activity of the constitutive pRM promoter, we can rewrite the model as
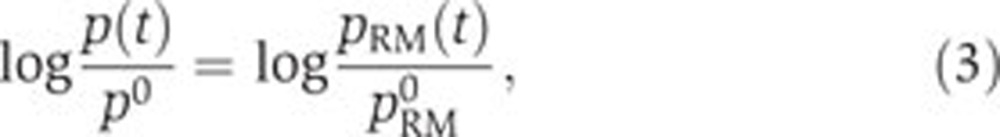 |
with pRM(t) and pRM0 the time-varying activity of the pRM promoter and its value at t0, respectively.
(ii) The data in Figures 3 and 4 indicate that both the promoter activity of acs and the intracellular concentration of cAMP peak after growth arrest. This suggests a simplified model for acs, and potentially other Crp·cAMP-regulated genes, in which the remaining variation of the promoter activity after subtraction of global physiological effects is proportional to the intracellular cAMP concentration c(t) [M]:
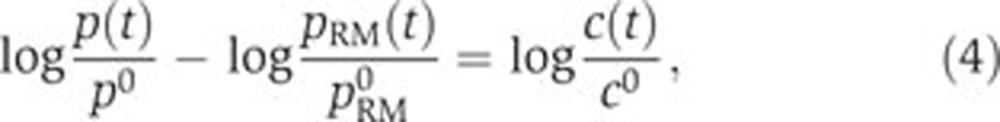 |
with c0=c(t0). Notice that this model is based on the data, but that the biological assumptions underlying the simplification can be explicitly formulated (Supplementary Section S7).
As will be shown below, the models of Equations (3) and (4) can be straightforwardly tested in different conditions by means of experimental data, by inserting for p(t) the measured promoter activities of fis, crp, and acs (denoted by pfis(t), pcrp(t), and pacs(t), respectively). This allows us to answer the following questions. (i) To which extent can the observed variation in the promoter activity of the genes in the network of Figure 1 be accounted for by the effect of the global physiological state only? (ii) How much of the remaining variation in promoter activity can be explained by changes in the intracellular concentration of cAMP?
Notice that the models of Equations (3) and (4) have a number of advantages for this purpose. First, they are parameterless and therefore do not require preliminary model calibration. Second, when the same plasmid vector is used for measuring the activity of a constitutive and a network gene, the growth phase-dependent variation of the plasmid copy number equally affects the target promoter p(t) and the constitutive promoter pRM(t), and therefore cancels out in the equations. If different vectors are used, then the equations can be easily adapted to correct for this bias by means of qPCR data (see Supplementary Section S8 and Supplementary Figure S8 for the mathematical arguments and an illustration).
Shared control of gene expression by transcription factors and the global physiological state of the cell
We first tested the hypothesis that the adaptation of gene expression in response to glucose exhaustion is mainly controlled by the physiological state of the cell, as measured by the activity of the pRM promoter. In this case, Equation (3) predicts a linear relation between  , the diagonal in the scatter plots of Figure 5A–C. If the global effects are dominant, then one would expect the data points to be scattered around the diagonal. As can be seen, this is indeed the case for fis and crp, but not for acs.
Figure 5.

Predicted and observed control of fis, crp, and acs activity by Crp·cAMP and the physiological state of the cell, in various experimental conditions and genetic backgrounds. (A) Predicted (--, black) and measured (·, blue) relative activity of the fis promoter ( ) as a function of the relative activity of the pRM promoter (
 ). The confidence intervals in the plots have been computed from experimental replicas, as described in Materials and methods. (B, C) Idem for crp and acs. (D) Predicted (--, black) and measured (·, blue) remaining relative activity of the acs promoter after subtraction of the effect of global physiological parameters (
 ) and as a function of the relative intracellular cAMP concentration (
 ). (E) Same as (A), but in a Δcrp strain. (F–H) Same as (B–D), but in a Δfis strain. (I) Same as (D), but for crp. (J–L) Predicted (--, black) and measured (·, blue) relative activity of the rpoS promoter (
 ) as a function of the relative activity of the pRM promoter (
 ) in three different conditions (wild-type, Δfis, and Δcrp). Source data for this figure is available on the online supplementary information page.
To quantify the fit of the models with the data, we computed the coefficient of determination (R2), the square of the correlation coefficient (Hamilton, 1992). For the computation of the correlation coefficient, the data points were weighed by the square inverse of the size of the confidence interval, ensuring that data points with low uncertainty weigh more than points with high uncertainty. The coefficient of determination measures the proportion of the variance predicted by the model. For fis and crp, we have high R2 values (0.93 and 0.96). However, for acs the R2 value is found to be much lower (0.08).
To account for the unexplained variation of the promoter activity of acs, we extended the model with the known regulation of this gene by Crp·cAMP. Equation (4) predicts a linear relation between the variation of acs activity remaining after subtraction of the global effect, and the intracellular concentration of cAMP. This prediction corresponds to the diagonal in Figure 5D. The experimental data points are seen to correspond well with the predictions of the extended model (R2=0.93). We also tested if the addition of Crp·cAMP regulation of fis and crp could account for the remaining variance in the data. This turned out not be the case, in the sense that we obtained very low R2 values when extending the model with an additional regulator (0.03 and 0.02, respectively, see Figure 5I for an example). We therefore conclude that the time-varying variation of fis and crp activity is well accounted for by changes in the physiological state, whereas for acs we also need to include the accumulation of cAMP.
Another informative view on the same data can be obtained by making explicit the contribution of specific regulatory factors to the observed variation in promoter activity. Equation (1) implies that
 |
As a consequence, the (normalized) contribution of specific regulatory factors can be obtained by dividing the (normalized) promoter activity of the gene of interest by the (normalized) promoter activity of the constitutive gene. Figure 6 shows the variation of the ratio  over the duration of the experiment for the genes in our network. As expected, the ratio remains close to 1 for fis and crp, while for acs it follows the intracellular concentration of cAMP (Figure 3B). Some small deviations of this pattern can be seen though. For example, while overall the acs promoter behaves as a constitutive promoter, there seems to remain a small, regulated component in its dynamics before the growth transition. This conclusion should be taken with care though, as the error bars are large due to difficulties in treating the fluorescence signal emitted by the acs reporter (which is close to the autofluorescence background during exponential growth).
Figure 6.
Relative contributions of specific regulators to the time-varying activity of the network genes. (A) Relative promoter activity  (--, blue) and relative effect of transcription factors and other specific regulators
  (--, pink). (B, C) Same as (A), but for crp and acs.
  remain close to 1, indicating that the effect of specific regulation is negligible for these promoters. The variation of
  corresponds to the cAMP concentration profile (Figure 3B), suggesting a regulatory role for this signaling metabolite. Source data for this figure is available on the online supplementary information page.

Validation of predicted dominance of global physiological effects
The surprising observation that growth phase-dependent effects dominate the expression dynamics of fis and crp calls for further experimental tests. To verify if changes in the medium after extended growth on glucose might account for the results, we performed a down-shift experiment. Once the culture reached quasi-steady-state growth in minimal medium with 0.3% glucose, we rediluted the bacteria into the same medium with a low glucose level (0.06%), thus enforcing a rapid growth arrest. In parallel, we monitored the expression of the genes in the network and the activity of the pRM promoter. The results are shown in Supplementary Sections S9 and S10; Supplementary Figures S9–S14; Supplementary Table S4. They confirm, both qualitatively and quantitatively, the observations made in the reference conditions: the variation in the activity of the fis and crp promoters is mainly controlled by the global physiological state, whereas the variation in the promoter activity of acs is to a large extent predicted by the combined effect of the growth phase and cAMP.
If the control exerted by the physiological state of the cell accounts for the major part of the variation of fis and crp activity, that is, if the cross-regulatory and autoregulatory interactions have a minor effect in our conditions, then one would expect the minimal model of Equation (3) to predict the variation in the promoter activity equally well in Δfis and Δcrp backgrounds. To test this prediction, we measured the input-output behavior of the network in mutant strains deleted for fis and crp. The resulting data were used to construct Figure 5E and F. The plots confirm the prediction that the global physiological effect is dominant in the control of the expression of crp in a Δfis strain and fis in a Δcrp strain (R2=0.70 and R2=0.96, respectively). That is, cross-regulation between Fis and Crp is of little importance here. This also holds for autoregulation, since the dynamics of crp activity in a Δcrp strain and fis in a Δfis strain are also well accounted for by the model of Equation (3) (R2=0.98 and R2=0.95, respectively).
Similarly, in the case of acs, one would expect the results of the analysis to change little in a Δfis mutant, given that the overall cellular physiology and cAMP were found to dominate its expression control. This prediction is also confirmed by our data, as shown in Figure 5G and H. The effects of Crp·cAMP and the global physiological state together account for most of the variation in acs activity (R2=0.96), whereas global effects alone fail to be a good predictor (R2=0.56). On the other hand, the deletion of crp disables the sensor mechanism of glycolytic fluxes provided by Crp·cAMP (Bettenbrock et al, 2007), and is known to prevent the induction of acs when glucose is exhausted (Wolfe, 2005). This is confirmed in our data: acs is not expressed in a Δcrp background (Supplementary Section S9; Supplementary Figure S11).
The results obtained thus confirm the observation that growth phase-dependent effects dominate the transcriptional control of the pleiotropic regulators Fis and Crp. The question can be raised to which extent this holds for other key transcriptional regulators involved in the response to glucose depletion. We addressed this question for RpoS or σS, a master stress regulator of E. coli and other bacteria (Hengge-Aronis, 2002; Battesti et al, 2010). The main rpoS promoter is contained within the nlpD gene and is negatively regulated by Crp·cAMP (Lange and Hengge-Aronis, 1994). The regulatory mechanism is not well understood and the effect remains somewhat controversial (see Zgurskaya et al, 1997 and references therein). In the same way as for the other genes, we monitored the expression of a transcriptional fusion of the rpoS promoter with a gfp reporter gene (Supplementary Section S9; Supplementary Figure S13). The data thus obtained were analyzed by means of the models of Equations (3) and (4), giving the results shown in Figure 5J–L. As for fis and crp, the transcription of rpoS follows the activity of the constitutive pRM promoter quite well, in all considered conditions.
Discussion
The variation of gene expression across growth phases is controlled both by the physiological state of the cell and by transcription factors. Here, we have shown how to distinguish between these two effects, using a simple mathematical model of promoter activity and carefully designed data analysis procedures. The approach has several advantages that make it easy to put to work in bacteria but also in higher organisms. The models do not have free parameters that need to be calibrated, hypotheses on the effect of regulators can be readily tested by monitoring the expression of target genes and a constitutive control, and the use of plasmid-borne reporter systems does not bias the analysis. The main novelty is that this allows the relative contributions of specific regulators and the global state of the cell to be monitored in vivo, both dynamically in time and on the level of a regulatory network.
We applied the method to expose hidden correlations in a circuit involving key regulators of carbon metabolism in E. coli. A first surprising finding of this study is that the activities of the genes encoding the transcription factors Fis, Crp, and RpoS closely follow the activity of a constitutively transcribed promoter. The activity of this promoter is assumed to reflect the global physiological state of the cell, that is, parameters affecting the expression of all genes, such as the concentrations of (free) polymerase and ribosome, gene copy number, and the size of the pools of amino acids and nucleotides.
An alternative interpretation of the observed correlations would be that a specific stress factor be responsible for the simultaneous adjustment of all above-mentioned promoter activities. For example, guanosine 3′,5′-bispyrophosphate or (p)ppGpp (Potrykus and Cashel, 2008) could have this role. This interpretation is motivated by the fact that the transcription of some of the genes in the network of Figure 1 is under stringent control and the fis promoter is directly regulated by (p)ppGpp (Ninnemann et al, 1992; Walker et al, 1999; Johansson et al, 2000; Mallik et al, 2004). For this explanation to hold, however, we have to postulate that (p)ppGpp has exactly the same specific, quantitative effect on all genes in our network as well as on the two constitutive promoters tested (pRM and ptet, see Supplementary Section S4 and Supplementary Figure S5). This is unlikely to be the case, so we attribute the observed variations in promoter activity to changes in the global physiological state of the cell. Notice that the absence of a (strong) specific effect of (p)ppGpp, at least in our conditions, does not contradict stringent control of the network genes. (p)ppGpp is a major factor in the control of the global physiological state (Traxler et al, 2006; Potrykus et al, 2011). It inhibits transcription of the rRNA operons, activates amino-acid biosynthesis promoters, and indirectly influences the availability of free RNA polymerase by inhibiting strong σ70 promoters (Durfee et al, 2008; Potrykus and Cashel, 2008), thus influencing the activity of the gene expression machinery. Through these mechanisms, (p)ppGpp may have an indirect effect on the expression of a large number of genes. In this study, we have captured these indirect, global effects into an easy-to-measure variable, the activity of a constitutive gene. An interesting extension of the model would be to analyze the global control of promoter activities in more detail, distinguishing between the contributions from individual physiological parameters.
A second interesting observation, actually a consequence of the first, is that in our conditions the regulatory interactions involving Fis and Crp do not significantly contribute to the control of the network response (Figure 7). Fis and Crp are among the most pleiotropic transcription factors of the cell, located at the top of the hierarchically structured transcription regulation network of E. coli (Martinez-Antonio and Collado-Vides, 2003). Their regulatory interactions form a cross-inhibition motif, which suggests that the network behaves as a bistable switch, along the lines of what has been shown for synthetic circuits in bacteria and gene networks underlying developmental processes in higher organisms (Gardner et al, 2000; Sánchez and Thieffry, 2001; Manu et al, 2009; Graham et al, 2010). It notably raises the question if the adaptation of gene expression in response to glucose depletion might be coordinated at the highest level of the transcription regulation hierarchy by a master switch under the control of cAMP (Ropers et al, 2006). Our data do not support this transcription factor-oriented view of network functioning, however, in the sense that the observed expression dynamics are very well explained without taking into account the dense pattern of regulatory interactions between Fis and Crp. Rather, the driving force behind the adaptation of gene expression is a global physiological effect that usually does not even figure in regulatory network diagrams.
Figure 7.

Reduced regulatory circuit. The network includes the interactions that were found to dominate the transcriptional response of the network in Figure 1, in particular the activation of all genes by the physiological state of the cell and the activation of acs by Crp·cAMP.
The absence of clearly identifiable effects of Fis and Crp·cAMP, other than on acs, is surprising as these interactions have been well documented in the literature (Ishizuka et al, 1994; González-Gil et al, 1998; Nasser et al, 2001) and are believed to be important in the adaptation to glucose exhaustion. Moreover, Fis and Crp have a large number of evolutionary-conserved binding motifs in the E. coli genome (Grainger et al, 2005; Cho et al, 2008). This paradox may be resolved by observing that when the physiological role of the above-mentioned interactions was tested, for example the activity of the fis promoter in a Δcrp strain (Nasser et al, 2001) or the activity of rpoS in the same background (Zgurskaya et al, 1997), no dramatic effects were found. Rather than dominating the control of gene expression, the specific regulators seem to finetune a global trend set by the availability of the transcriptional and translational machinery and other global physiological parameters. This finetuning may nevertheless be important for the cell, as even small regulatory effects may confer a decisive growth advantage. For instance, experimental evolution studies in E. coli have shown that mutations in a transcription factor providing a fitness benefit of <1% outcompete isogenic strains not carrying this mutation (Pelosi et al, 2006).
While the control of gene expression during growth transitions is thus shared between global physiological effects and specific transcription factors, our results question the central role often attributed to transcriptional regulatory networks in controlling genome-wide expression changes during physiological transitions. It may be more appropriate to regard transcriptional regulators as complementing and finetuning the global control exerted by the physiological state of the cell. It is therefore strongly recommended to explicitly take into account these global parameters when analyzing transcriptome data or when designing a synthetic controller circuit.
Materials and methods
Strains and growth conditions
The E. coli strains used in this study are the wild-type strain BW25113 and the deletion mutants Δfis and Δcrp. The wild-type and mutant strains were transformed with low-copy plasmids bearing a fusion of a gfp reporter gene with the promoter regions of the genes crp, fis, acs, and rpoS (de Jong et al, 2010). In addition, we used a plasmid carrying the pRM promoter of phage λ and the synthetic ptet promoter. More details on the strains and plasmids used in this study can be found in Supplementary Section S1 and Supplementary Tables S1–S3 of Supplementary information.
The strains were recovered from glycerol stock and grown overnight at 37°C in M9 minimal medium (Miller, 1972) supplemented with 0.3% glucose and mineral trace elements. The overnight cultures were strongly diluted (1500- to 7000-fold) into a 96-well microplate, so as to obtain an adjusted initial OD600 of 0.001. The wells of the microplate contain 150 μl of the above medium, to which was added 1.2% of the buffering agent HEPES (4-(2-hydroxyethyl)-1-piperazineethanesulfonic acid) for maintaining a constant external pH. The wells were covered with 60 μl of mineral oil to avoid evaporation. The microplate cultures were then grown for 20 h at 37°C, with agitation at regular intervals, in a microplate reader (Fusion Alpha, Perkin-Elmer).
Real-time monitoring of gene expression and data analysis
The expression of the reporter genes in the different genetic backgrounds was monitored in real time. During a typical acquisition period, we obtain about 120 readings each of absorbance (600 nm) and fluorescence (485–520 nm). The promoter activities were computed from these data by means of carefully designed data analysis procedures implemented in Matlab. Extending earlier work (Ronen et al, 2002; de Jong et al, 2010), we notably took into account the effect of protein degradation, maturation time, dynamic changes of autofluorescence, and synchronization of experimental replicates (see Supplementary Section S2 and Supplementary Figures S1 and S2 for details). Confidence intervals consist of ±2 standard errors of the mean, determined from on average four experimental replicas. Under the assumption of Gaussian distributions, this corresponds to 95% confidence intervals.
Measurement of cAMP concentrations
To measure the extracellular concentration of cAMP (adenosine 3′,5′-cyclic monophosphate), we used a commercially available immunoassay kit (Upstate). We took 100 μl samples at regular time intervals from cultures growing in a microplate, under the conditions described above (12 time points, 3 replicates). Following the manufacturer’s instructions, the cAMP concentration at the different time points was determined from luminescence measurements in the microplate reader and a calibration standard relating luminescence intensity to cAMP concentration.
Measurement of time-varying plasmid copy number
We used qPCR to determine the time-varying number of plasmids per chromosomal equivalent of DNA (plasmid copy number), following a previously validated protocol (Lee et al, 2004). Details of the experimental procedure can be found in Supplementary Section S6 and Supplementary Figure S7.
Supplementary Material
Supplementary figures S1-14, Supplementary tables S1-3
Acknowledgments
This work was supported by the European Commission under project EC-MOAN (FP6-2005-NEST-PATH-COM/043235), the Agence Nationale de la Recherche under project GeMCo (ANR-2010-BLAN-0201-02), and INRIA/INSERM under project Colage. We would like to thank Sevcan Yavuz and Stéphane Pinhal for help with the construction of the fluorescent reporters, and Grégory Batt, Eugenio Cinquemani, and Daniel Kahn for comments on a previous version of the manuscript.
Author contributions: HdJ, JG, and DR designed the research; SB, GB, HdJ, CP, and CR developed constructions and/or performed the experiments; SB, HdJ, and DR developed data analysis procedures; SB, HdJ, DR, and JG analyzed the data; SB and HdJ wrote the paper.
Footnotes
The authors declare that they have no conflict of interest.
References
- Baldazzi V, Ropers D, Markowicz Y, Kahn D, Geiselmann J, de Jong H (2010) The carbon assimilation network in Escherichia coli is densely connected and largely sign-determined by directions of metabolic fluxes. PLoS Comput Biol 6: e1000812. [DOI] [PMC free article] [PubMed] [Google Scholar]
- Battesti A, Majdalani N, Gottesman S (2010) The RpoS-mediated general stress response in Escherichia coli. Annu Rev Microbiol 65: 189–213 [DOI] [PMC free article] [PubMed] [Google Scholar]
- Bettenbrock K, Sauter T, Jahreis K, Kremling A, Lengeler J, Gilles E (2007) Correlation between growth rates, EIIACrr phosphorylation, and intracellular cyclic AMP levels in Escherichia coli K-12. J Bacteriol 189: 6891–6900 [DOI] [PMC free article] [PubMed] [Google Scholar]
- Bintu L, Buchler N, Garcia H, Gerland U, Hwa T, Kondev J, Kuhlman T, Phillips R (2005) Transcriptional regulation by the numbers: applications. Curr Opin Genet Dev 15: 125–135 [DOI] [PMC free article] [PubMed] [Google Scholar]
- Bradley M, Beach M, de Koning A, Pratt T, Osuna R (2007) Effects of Fis on Escherichia coli gene expression during different growth stages. Microbiology 153: 2922–2940 [DOI] [PubMed] [Google Scholar]
- Bremer H, Dennis P (1996) Modulation of chemical composition and other parameters of the cell by growth rate. In Escherichia coli and Salmonella: Cellular and Molecular Biology Neidhardt F, Curtiss R III, Ingraham J, Lin E, Low K, Magasanik B, Reznikoff W, Riley M, Schaechter M, Umbarger H (eds) Washington, DC: ASM Press, , 2nd edn, pp 1553–1569 [Google Scholar]
- Carrera J, Rodrigo G, Singh V, Kirov B, Jaramillo A (2011) Empirical model and in vivo characterization of the bacterial response to synthetic gene expression show that ribosome allocation limits growth rate. Biotechnol J 6: 773–783 [DOI] [PubMed] [Google Scholar]
- Cho BK, Knight E, Barrett C, Palsson B (2008) Genome-wide analysis of Fis binding in Escherichia coli indicates a causative role for A-/AT-tracts. Genome Res 18: 900–910 [DOI] [PMC free article] [PubMed] [Google Scholar]
- de Jong H (2002) Modeling and simulation of genetic regulatory systems: A literature review. J Comput Biol 9: 67–103 [DOI] [PubMed] [Google Scholar]
- de Jong H, Ranquet C, Ropers D, Pinel C, Geiselmann J (2010) Experimental and computational validation of models of fluorescent and luminescent reporter genes in bacteria. BMC Syst Biol 4: 55. [DOI] [PMC free article] [PubMed] [Google Scholar]
- Dennis P, Ehrenberg M, Bremer H (2004) Control of rRNA synthesis in Escherichia coli: a systems biology approach. Microbiol Mol Biol Rev 68: 639–668 [DOI] [PMC free article] [PubMed] [Google Scholar]
- Durfee T, Hansen AM, Zhi H, Blattner F, Jin D (2008) Transcriptional profiling of the stringent response in Escherichia coli. J Bacteriol 190: 1084–1096 [DOI] [PMC free article] [PubMed] [Google Scholar]
- Gardner T, Cantor C, Collins J (2000) Construction of a genetic toggle switch in Escherichia coli. Nature 403: 339–342 [DOI] [PubMed] [Google Scholar]
- González-Gil G, Kahmann R, Muskhelishvili G (1998) Regulation of crp transcription by oscillation between distinct nucleoprotein complexes. EMBO J 17: 2877–2885 [DOI] [PMC free article] [PubMed] [Google Scholar]
- Gosset G, Zhang Z, Nayyar S, Cuevas W, Saier M Jr (2004) Transcriptome analysis of CRP-dependent catabolite control of gene expression in Escherichia coli. J Bacteriol 186: 3516–3524 [DOI] [PMC free article] [PubMed] [Google Scholar]
- Gottesman S (1984) Bacterial regulation: Global regulatory networks. Annu Rev Genet 18: 415–441 [DOI] [PubMed] [Google Scholar]
- Graham T, Tabei S, Dinner A, Rebay I (2010) Modeling bistable cell-fate choices in the Drosophila eye: qualitative and quantitative perspectives. Development 137: 2265–2278 [DOI] [PMC free article] [PubMed] [Google Scholar]
- Grainger D, Hurd D, Harrison M, Holdstock J, Busby S (2005) Studies of the distribution of Escherichia coli cAMP-receptor protein and RNA polymerase along the E. coli chromosome. Proc Natl Acad Sci USA 102: 17693–17698 [DOI] [PMC free article] [PubMed] [Google Scholar]
- Gutierrez-Ríos R, Freyre-Gonzalez J, Resendis O, Collado-Vides J Jr MS, Gosset G (2007) Identification of regulatory network topological units coordinating the genome-wide transcriptional response to glucose in Escherichia coli. BMC Microbiol 7: 53. [DOI] [PMC free article] [PubMed] [Google Scholar]
- Hamilton L (1992) Regression with Graphics: A Second Course in Applied Statistics Belmond, CA: Duxbury Press, [Google Scholar]
- Hanamura A, Aiba H (1991) Molecular mechanism of negative autoregulation of Escherichia coli crp gene. Nucleic Acids Res 19: 4413–4419 [DOI] [PMC free article] [PubMed] [Google Scholar]
- Hengge-Aronis R (2002) Signal transduction and regulatory mechanisms involved in control of the σS (RpoS) subunit of RNA polymerase. Microbiol Mol Biol Rev 66: 373–395 [DOI] [PMC free article] [PubMed] [Google Scholar]
- Ishizuka H, Hanamura A, Inada T, Aiba H (1994) Mechanism of the down-regulation of cAMP receptor protein by glucose in Escherichia coli: Role of autoregulation of the crp gene. EMBO J 13: 3077–3082 [DOI] [PMC free article] [PubMed] [Google Scholar]
- Johansson J, Balsalobre C, Wang S, Urbonaviciene J, Jin D, Sondén B, Uhlin B (2000) Nucleoid proteins stimulate stringently controlled bacterial promoters: a link between the cAMP-CRP and the (p)ppGpp regulons in Escherichia coli. Cell 102: 475–485 [DOI] [PubMed] [Google Scholar]
- Kao K, Yang YL, Boscolo R, Sabatti C, Roychowdhury V, Liao J (2004) Transcriptome-based determination of multiple transcription regulator activities in Escherichia coli by using network component analysis. Proc Natl Acad Sci USA 101: 641–646 [DOI] [PMC free article] [PubMed] [Google Scholar]
- Keseler I, Collado-Vides J, Santos-Zavaleta A, Peralta-Gil M, Gama-Castro S, niz Rascado LM, Bonavides-Martinez C, Paley S, Krummenacker M, Altman T, Kaipa P, Spaulding A, Pacheco J, Latendresse M, Fulcher C, Sarker M, Shearer A, Mackie A, Paulsen I, Gunsalus R et al. (2011) EcoCyc: a comprehensive database of Escherichia coli biology. Nucleid Acids Res 39: D863–D890 [DOI] [PMC free article] [PubMed] [Google Scholar]
- Kjeldgaard N (1961) The kinetics of ribonucleic acid- and protein formation in Salmonella typhimurium during the transition between different states of balanced growth. Biochim Biophys Acta 49: 64–76 [DOI] [PubMed] [Google Scholar]
- Klumpp S, Hwa T (2008) Growth-rate-dependent partitioning of RNA polymerases in bacteria. Proc Natl Acad Sci USA 105: 20245–20250 [DOI] [PMC free article] [PubMed] [Google Scholar]
- Klumpp S, Zhang Z, Hwa T (2009) Growth rate-dependent global effects on gene expression in bacteria. Cell 139: 1366–1375 [DOI] [PMC free article] [PubMed] [Google Scholar]
- Kolb A, Busby S, Buc H, Garges S, Adhya S (1993) Transcriptional regulation by cAMP and its receptor protein. Annu Rev Biochem 62: 749–795 [DOI] [PubMed] [Google Scholar]
- Kotte O, Zaugg J, Heinemann M (2010) Bacterial adaptation through distributed sensing of metabolic fluxes. Mol Syst Biol 6: 355. [DOI] [PMC free article] [PubMed] [Google Scholar]
- Lange R, Hengge-Aronis R (1994) The cellular concentration of the σS subunit of RNA polymerase in Escherichia coli is controlled at the levels of transcription, translation, and protein stability. Genes Dev 8: 1600–1612 [DOI] [PubMed] [Google Scholar]
- Lee C, Kim J, Shin S, Hwang S (2004) Absolute and relative QPCR quantification of plasmid copy number in Escherichia coli. J Biotechnol 123: 273–280 [DOI] [PubMed] [Google Scholar]
- Liang S, Bipatnath M, Xu Y, Chen S, Dennis P, Ehrenberg M, Bremer H (1999) Activities of constitutive promoters in Escherichia coli. J Mol Biol 292: 19–37 [DOI] [PubMed] [Google Scholar]
- Lin-Chao S, Bremer H (1986) Effect of the bacterial growth rate on replication control of plasmid pBR322 in Escherichia coli. Mol Gen Genet 203: 143–149 [DOI] [PubMed] [Google Scholar]
- Maaløe O, Kjeldgaard N (1966) Control of Macromolecular Synthesis: A Study of DNA, RNA and Protein Synthesis in Bacteria New York: W.A: Benjamin, [Google Scholar]
- Makman R, Sutherland E (1965) Adenosine 3',5'-phosphate in Escherichia coli. J Biol Chem 240: 1309–1314 [PubMed] [Google Scholar]
- Mallik P, Pratt T, Beach M, Bradley M, Undamatla J, Osuna R (2004) Growth phase-dependent regulation and stringent control of fis are conserved processes in enteric bacteria and involve a single promoter (fis P) in Escherichia coli. J Bacteriol 186: 122–135 [DOI] [PMC free article] [PubMed] [Google Scholar]
- Manu SurkovaS, Spirov A, Gursky V, Janssens H, Kim AR, Radulescu O, Vanario-Alonso C, Sharp D, Samsonova M, Reinitz J (2009) Canalization of gene expression and domain shifts in the Drosophila blastoderm by dynamical attractors. PLoS Comput Biol 5: e1000303. [DOI] [PMC free article] [PubMed] [Google Scholar]
- Martinez-Antonio A, Collado-Vides J (2003) Identifying global regulators in transcriptional regulatory networks in bacteria. Curr Opin Microbiol 6: 482–489 [DOI] [PubMed] [Google Scholar]
- Miller J (1972) Experiments in Molecular Genetics Cold Spring Harbor, NY: CSHL Press, [Google Scholar]
- Nasser W, Schneider R, Travers A, Muskhelishvili G (2001) CRP modulates fis transcription by alternate formation of activating and repressing nucleoprotein complexes. J Biol Chem 276: 17878–17886 [DOI] [PubMed] [Google Scholar]
- Neidhardt F, Fraenkel D (1961) Metabolic regulation of RNA synthesis in bacteria. Cold Spring Harb Symp Quant Biol 26: 63–74 [DOI] [PubMed] [Google Scholar]
- Ninnemann O, Koch C, Kahmann R (1992) The E. coli fis promoter is subject to stringent control and autoregulation. EMBO J 11: 1075–1083 [DOI] [PMC free article] [PubMed] [Google Scholar]
- Oppenheim A, Kobiler O, Stavans J, Court D, Adhya S (2005) Switches in bacteriophage lambda development. Annu Rev Genet 39: 409–429 [DOI] [PubMed] [Google Scholar]
- Pelosi L, Kühn L, Guetta D, Garin J, Geiselmann J, Lenski R, Schneider D (2006) Parallel changes in global protein profiles during long-term experimental evolution in Escherichia coli. Genetics 173: 1851–1869 [DOI] [PMC free article] [PubMed] [Google Scholar]
- Perrenoud A, Sauer U (2005) Impact of global transcriptional regulation by ArcA, ArcB, Cra, Crp, Cya, Fnr, and Mlc on glucose catabolism in Escherichia coli. J Bacteriol 187: 3171–3179 [DOI] [PMC free article] [PubMed] [Google Scholar]
- Potrykus K, Cashel M (2008) (p)ppGpp: still magical? Ann Rev Microbiol 62: 35–51 [DOI] [PubMed] [Google Scholar]
- Potrykus K, Murphy H, Philippe N, Cashel M (2011) ppGpp is the major source of growth rate control in E. coli. Environ Microbiol 13: 563–575 [DOI] [PMC free article] [PubMed] [Google Scholar]
- Regenberg B, Grotkjaer T, Winther O, Fausbøll A, Akesson M, Bro C, Hansen L, Brunak S, Nielsen J (2006) Growth-rate regulated genes have profound impact on interpretation of transcriptome profiling in Saccharomyces cerevisiae. Genome Biol 7: R107. [DOI] [PMC free article] [PubMed] [Google Scholar]
- Ronen M, Rosenberg R, Shraiman B, Alon U (2002) Assigning numbers to the arrows: parameterizing a gene regulation network by using accurate expression kinetics. Proc Natl Acad Sci USA 99: 10555–10560 [DOI] [PMC free article] [PubMed] [Google Scholar]
- Ropers D, de Jong H, Page M, Schneider D, Geiselmann J (2006) Qualitative simulation of the carbon starvation response in Escherichia coli. Biosystems 84: 124–152 [DOI] [PubMed] [Google Scholar]
- Sánchez L, Thieffry D (2001) A logical analysis of the Drosophila gap-gene system. J Theor Biol. 211: 115–141 [DOI] [PubMed]
- Schaechter M, Maaløe O, Kjeldgaard N (1958) Dependency on medium and temperature of cell size and chemical composition during balanced growth of Salmonella typhimurium. J Gen Microbiol 19: 592–606 [DOI] [PubMed] [Google Scholar]
- Scott M, Gunderson C, Mateescu E, Zhang Z, Hwa T (2010) Interdependence of cell growth and gene expression: origins and consequences. Science 330: 1099–1102 [DOI] [PubMed] [Google Scholar]
- Scott M, Hwa T (2011) Bacterial growth laws and their applications. Curr Opin Biotechnol 22: 559–565 [DOI] [PMC free article] [PubMed] [Google Scholar]
- Shachrai I, Zaslaver A, Alon U, Dekel E (2010) Cost of unneeded proteins in Escherichia coli is reduced after several generations in exponential growth. Mol Cell 38: 758–767 [DOI] [PubMed] [Google Scholar]
- Snoep J, van der Weijden C, Andersen H, Westerhoff H, Jensen P (2002) DNA supercoiling in Escherichia coli is under tight and subtle homeostatic control, involving gene-expression and metabolic regulation of both topoisomerase I and DNA gyrase. Eur J Biochem 269: 1662–1669 [DOI] [PubMed] [Google Scholar]
- Tadmor A, Tlusty T (2008) A coarse-grained biophysical model of E. coli and its application to perturbation of the rRNA operon copy number. PLoS Comput Biol 4: e1000038. [DOI] [PMC free article] [PubMed] [Google Scholar]
- Tan C, Marguet P, You L (2009) Emergent bistability by a growth-modulating positive feedback circuit. Nat Chem Biol 5: 842–848 [DOI] [PMC free article] [PubMed] [Google Scholar]
- Traxler M, Chang DE, Conway T (2006) Guanosine 3',5'-bispyrophosphate coordinates global gene expression during glucose-lactose diauxie in Escherichia coli. Proc Natl Acad Sci USA 103: 2374–2379 [DOI] [PMC free article] [PubMed] [Google Scholar]
- Walker K, Atkins C, Osuna R (1999) Functional determinants of the Escherichia coli fis promoter: Roles of -35, -10, and transcription initiation regions in the response to stringent control and growth phase-dependent regulation. J Bacteriol 181: 1269–1280 [DOI] [PMC free article] [PubMed] [Google Scholar]
- Wolfe A (2005) The acetate switch. Microbiol Mol Biol Rev 69: 12–50 [DOI] [PMC free article] [PubMed] [Google Scholar]
- Zgurskaya H, Keyhan M, Matin A (1997) The σS level in starving Escherichia coli cells increases solely as a result of its increased stability, despite decreased synthesis. Mol Microbiol 24: 643–651 [DOI] [PubMed] [Google Scholar]
Associated Data
This section collects any data citations, data availability statements, or supplementary materials included in this article.
Supplementary Materials
Supplementary figures S1-14, Supplementary tables S1-3