

Abstract
Purpose.
To establish the morphologic changes of astrocytes in the glial lamina of glaucomatous mice.
Methods.
A strain of mice that expresses GFP in individual astrocytes (hGFAPpr-GFP) was crossed into the DBA/2J strain that develops glaucoma. In the resulting strain (D2.hGFAPpr-GFP) we assessed the severity of glaucoma by staining the retina for neurofilaments and counting the neurons of the retinal ganglion cell layer. We observed the morphology of astrocytes in the glial lamina of the optic nerves.
Results.
D2.hGFAPpr-GFP mice developed glaucoma in an age-dependent manner. Astrocytes in the glial lamina showed morphologic changes that correlated with the severity of glaucoma. The cells showed thickening of processes from 1.3 ± 0.28 μm in nondiseased animals to 1.71 ± 0.46 μm in eyes with moderate glaucoma and 2.1 ± 0.42 μm in those with severe glaucoma. Their spatial coverage, as determined by their convex polygon area, was reduced in eyes with severe glaucoma. The astrocytes in severely glaucomatous optic nerves also showed simplification of their processes. In 6-month-old mice with no obvious signs of degeneration in the retina, we found astrocytes with appendages growing out of primary astrocyte processes into the axon bundles. This localized hypertrophy of processes was never observed in the hGFAPpr-GFP strain.
Conclusions.
Confirming results after optic nerve crush, astrocytes in glaucomatous optic nerves had thickened and simplified processes, and reduced spatial coverage. We also found evidence of localized sprouting of new processes in early stages of the disease, before detectable changes in ganglion cell number.
Astrocytes in the glial lamina of glaucomatous optic nerves showed morphologic changes: thickening and simplification of processes, reduced spatial coverage, and sprouting of new processes into the axon bundles.
Introduction
Elevated intraocular pressure (IOP) is one of the main risk factors for glaucoma. Though the exact mechanism linking pressure with the damage to ganglion cells is still unknown, a leading hypothesis implicates the lamina cribrosa of the optic nerve in the pathogenesis of the disease. The lamina cribrosa in humans and other primates is a relatively rigid, collagenous sieve through which the ganglion cells' axons thread as they are leaving the globe. Experimental evidence points to the section of the optic nerve that passes through the lamina as the site of primary injury to the axons. In humans, other primates, pigs, and rodents, blockage of axonal transport in the region of the lamina cribrosa results from pressure elevation.1–6 Failure of retrograde axonal transport could cause loss of trophic support for ganglion cells, leading to their apoptosis.7
Another indication for the lamina as the site of primary injury comes from experiments in the glaucomatous mouse strain DBA/2J.8 If DBA/2J mice are bax deficient, retinal ganglion cell bodies and the part of the axons between the cell body and the lamina survive for some time, whereas the distal portion of the axon degenerates quickly, suggesting an insult in this region.9 And finally, the geometry of the observed ganglion cell degeneration itself is difficult to explain by any mechanism that does not involve the proximal portion of the optic nerve. In mice, as in human beings, the typical loss of ganglion cells is not diffuse over the whole retina, but arcuate in human beings, and sectorial in mice.10–12 This indicates a lesion to ganglion cell axons in the region of the lamina, because here the axons run in bundles with a topographic relationship to the retina.13
The optic nerve head in the mouse differs from that in primates in a crucial respect: it does not contain a collagenous lamina cribrosa.14 It contains, instead, a dense meshwork of GFAP-positive astrocytes that ensheath ganglion cell axons and organize them into bundles.13,15 This structure has been called the glial lamina.9 As the axons in the glial lamina are still unmyelinated, astrocytes form their immediate neighborhood. It is noteworthy that in animals with a true lamina cribrosa, astrocytes are also in the direct vicinity of the axons, as the pores of the lamina cribrosa are lined with astrocytes.16,17 This close association has led to the hypothesis that optic nerve glia may be directly involved in the pathogenesis of glaucoma.18
The astrocytes in the glial lamina are arranged in a characteristic way. In the normal optic nerve, GFAP+ astrocytes organize ganglion cell axons in bundles, giving that part of the optic nerve a honeycomb appearance in cross section. Individual astrocytes are large, often spanning the whole diameter of the nerve and overlapping extensively with the processes of other cells.13 In early stages of glaucoma, only some of these axon bundles are degenerating; others in the same nerve are preserved, which leads to the occurrence of degenerated and preserved sectors of ganglion cells and their axons in the retina.9,11 Given that an astrocyte in the optic nerve does not exclusively encircle an individual bundle, this presents the question of how individual astrocytes react to localized axon damage in glaucoma. There are two principle mechanisms for how this could happen. First, the cells could move and home in on a degenerating bundle. The second possibility is that astrocytes could show compartmentalized reactivity in only some of their processes—those that contact a degenerated axon bundle—but remain normal in the rest of their processes.13
Here we investigated the morphology of astrocytes in a heritable model of glaucoma, the DBA/2J mouse. For this purpose, we crossed a transgenic strain (hGFAPpr-GFP) that expresses GFP in individual astrocytes both in gray and white matter19 with DBA/2J for more than 7 generations to arrive at a strain that develops glaucoma spontaneously and shows labeling of astrocytes that was observed directly with confocal microscopy. The resulting strain developed glaucoma in an age-dependent manner similar to that of the parental DBA/2J. The severity of disease was diagnosed by an axonal stain of whole-mounted retinas11 and by counting surviving ganglion cells. It was correlated to the morphology of astrocytes in the glial lamina.
Materials and Methods
Animal Breeding and Genotyping
All animals were treated in accordance with the ARVO Statement for the Use of Animals in Ophthalmic and Vision Research, and were approved by the Committee on Research Animal Care of the Massachusetts Eye and Ear Infirmary. Mice were housed under 12-hour dark and light cycles and received water and food ad libitum. The transgenic hGFAPpr-GFP strain on the FVB/N background19 was obtained from the laboratory of Helmut Kettenmann (Max Delbrueck Center, Berlin, Germany). DBA/2J mice were purchased from the Jackson Laboratory (Bar Harbor, ME). The D2.hGFAPpr-GFP strain was initiated by crossing an hGFAPpr-GFP founder male with DBA/2J females. In every generation, GFP+ offspring were identified by directly observing the tissue obtained from an ear punch under a fluorescent microscope. This is possible because GFP is also expressed in peripheral glial cells that can be seen directly in thin tissue like the ear lobe. Genomic DNA was extracted from the same ear punch using a tissue extraction kit (REDExtract-N-Amp Tissue PCR Kit; Sigma-Aldrich, St. Louis, MO).
D2.hGFAPpr-GFP mice were tested for the absence of the rd1 mutation that is found in the founder strain FVB/N,20 and the presence of the mutations in the Gpnmb and Tyrp1 genes that are responsible for the iris pigment dispersion (IPD) and iris stromal atrophy (ISA) phenotypes in DBA/2J.21,22 The Tyrp1 mutation is responsible for the coat color in DBA/2J and was selected for directly. The primers used to amplify fragments of the Pde6b and Gpnmb genes were as follows: Pde6b-fw catcccacctgagctcacagaaag; Pde6b-rev gcctacaacagaggagcttctagc; Gpnmb-fw aactcgactgtttgttcttgg; Gpnmb-rev agagaataagaaaggacaagg. The sizes of the amplicons were 298 and 268 base pairs, respectively. PCR products were purified with a fast purification system for nucleic acids (Nucleospin Extract II; Macherey & Nagel, Dueren, Germany), and sequenced directly. From generation N7 onwards, some GFP+ D2.hGFAPpr-GFP mice were maintained until 6 to 24 months, well into the age when glaucomatous degeneration of ganglion cells is obvious in the DBA/2J line.8,11
Measurement of IOP
Mice were lightly anesthetized with isoflurane. The IOP was measured with a rebound tonometer (Tono Lab; ICare, Espoo, Finland). The instrument takes five individual measurements and gives the mean as one reading. Five such readings were taken from each eye, and the average was calculated.
Tissue Preparation
Light-adapted mice were anesthetized by an intraperitoneal (ip) injection of ketamine (100 mg/kg) and xylazine (20 mg/kg), and then decapitated. Retinas and optic nerves were prepared as described previously.11,13 The retinas were mounted ganglion-side up on type AA nitrocellulose filters (MF-Millipore; Millipore, Billerica, MA). The optic nerves, containing the glial lamina, were embedded in 6% agarose and 100 μm sections were cut on a vibratome for imaging of astrocyte morphology. For immunohistochemistry, the optic nerves were embedded in OCT, frozen, and cryosectioned at 12 to 20 μm.
Immunohistochemistry and Microscopy
For diagnosis of glaucomatous degeneration of ganglion cells, the retina whole-mounts were incubated with an antibody against a neurofilament (SMI32; Covance, Dedham, MA). This monoclonal mouse antibody recognizes the nonphosphorylated form of neurofilament H,23 and is useful as a marker for loss of ganglion cells and their axons in DBA/2J.11 The astrocytes of the optic nerve were stained with antibodies to GFAP (rabbit polyclonal; BioGenex, Fremont, CA).
Whole-mounted retinas were incubated with the primary antibodies at 4°C for 3 days; frozen sections of the optic nerve were incubated with primary antibody overnight. Immunostaining was visualized with secondary antibodies conjugated to FITC, tetramethyl rhodamine, or Cy5 (Jackson Immunoresearch Laboratories, West Grove, PA).
Cell nuclei were counterstained with nuclear dyes (DAPI, TOPRO; Life Technologies, Grand Island, NY). Images of retinas and optic nerves were taken on a confocal microscope with a 63×/NA = 1.3 glycerol immersion objective (SP5; Leica Microsystems, Buffalo Grove, IL). Optic nerve astrocytes were imaged by taking a through-focus series of the whole cell. The three-dimensional morphology of the cell was rendered using a volume visualization program (Amira; Visage Imaging, San Diego, CA).
Grading of Glaucomatous Degeneration and Ganglion Cell Counts
The stage of glaucomatous degeneration was determined from SMI32-stained whole-mount retinas. When no axon loss or abnormal morphology of individual ganglion cells was obvious, the retina was graded as having no glaucoma. If individual cells showed signs of degeneration (lack of higher-order branches in the dendritic tree, condensed neurofilaments, shrunken soma) or there was loss of sectors of axon staining not exceeding 50% of the retina, the retina was graded as moderate. If the loss of axons was greater than 50%, the retina was graded as severe. These grades were correlated with cell counts in the ganglion cell layer. Whole-mounted retinas stained with DAPI were imaged on an microscope equipped for epifluorescence (BX51; Olympus, Center Valley, PA). Four pictures were taken in mid-periphery from every retina in the nasal, inferior, superior, and temporal quadrants. The dimensions of the microphotograph were 232 μm × 232 μm. The DAPI stained nuclei in the ganglion cell layer were counted in Image J (available from the National Institutes of Health, Bethesda, MD). Nuclei of endothelial cells could be recognized by their elongated shape and were not included in the count.
Morphometric Analysis of Astrocytes
Measurements of thickness of individual processes were done on maximum-intensity projections of image stacks using Image J. The thickness of the processes was measured approximately 15 μm from the soma. Measurements from controls, the no-glaucoma group, the moderate group, and the severe group were imported into a technical computing program (MatLab; Mathworks, Natick, MA). Averages and SEM were calculated and the groups were tested for statistically significant differences by one-way ANOVA. Group means were compared using the Bonferroni method. For measurements of convex polygon areas of cells and Scholl analysis, individual cells were traced in an image processing program (Adobe Photoshop CS2; Adobe, Waltham, MA) from maximum intensity projections. The convex polygon area was determined using MatLab (Mathworks) routines. The convex polygon areas from the control, no-glaucoma, moderate glaucoma, and severe glaucoma groups were tested by ANOVA. Scholl analysis was also done on traces of individual astrocytes using semi-automated routines written in MatLab (Mathworks). Concentric rings in distances of 10 μm were placed on the traces of the astrocyte and centered on the soma. Processes crossing the concentric rings were counted and graphed versus the distance from the soma on linear axes. To directly compare Scholl analyses from control, non-diseased, moderately, and severely affected eyes, the areas under the curve from each cell was calculated in MatLab (Mathworks). The areas under the curves were compared for the four groups using ANOVA.
Results
Breeding the hGFAPpr-GFP Transgene into DBA/2J
The transgenic founder strain was developed by injection of a 2.2 kB fragment of the human GFAP promoter fused to EGFP into FVB/N oocytes.19 This transgenic strain has the advantage that, in the optic nerve, only a small percentage of all GFAP-expressing astrocytes are labeled with GFP, which makes direct microscopic observation of these cells easy. On the other hand, the strain does not develop glaucoma. Furthermore, it carries the rd1 mutation in the Pde6b gene, which leads to retinal degeneration. By the age of 60 days, FVB/N mice have lost virtually all of their photoreceptors. We wanted to establish a strain that was more suitable for glaucoma-related studies. Therefore, we backcrossed the hGFAPpr-GFP transgene into the DBA/2J background for more than seven generations. The resulting strain is referred to as D2.hGFAPpr-GFP. Direct sequencing of a PCR product from the Pde6b gene showed that the mutation has successfully been bred out of the D2.hGFAPpr-GFP strain (data not shown). As shown in Figure 1, D2.hGFAPpr-GFP retinas, in contrast to hGFAPpr-GFP, do not develop photoreceptor degeneration even at 1 year of age (Figs. 1A, 1B). We verified the presence of the nonsense mutation in the Gpnmb gene that causes iris pigment dispersion by direct sequencing of a Gpnmb PCR product (Fig. 1C). The presence of GFP-expressing astrocytes in the optic nerve was verified by direct microscopy (Fig. 1D).
Figure 1. .

(A) Vertical section of a retina from an hGFAPpr-GFP mouse on FVB/N background, aged 12 months. Nuclei are stained in red. At this age, mice on this background have lost all photoreceptors. (B) Vertical section of a D2.hGFAPpr-GFP mouse (on DBA/2J background), aged 12 months. (C) Direct sequencing of the mutation in the Gpnmb gene that causes iris pigment dispersion in the DBA/2J background strains. (D) Optic nerve astrocyte in D2.hGFAPpr-GFP mouse. This astrocyte was localized in the myelinated part of the optic nerve. Scale bars = 20 μm.
D2.hGFAPpr-GFP Mice Develop Glaucomatous Damage of the Retina
We followed a cohort of 17 D2.hGFAPpr-GFP mice with measurements of the IOP. Like the parental DBA/2J strain, some D2.hGFAPpr-GFP mice developed elevated IOP at ages greater than 6 months (Fig. 2). We expected the D2.hGFAPpr-GFP strain to progress to ganglion cell loss. In the parental DBA/2J strain this ganglion cell loss is sectorial in moderate stages, and in severe stages the whole ganglion cell population can be lost. In an earlier study we found that staining for the non-phosphorylated heavy neurofilament is a sensitive marker for axon loss.11 We, therefore, assessed the severity of glaucomatous damage to the retina with SMI32 (neurofilament) staining. We evaluated male and female mice of various age groups: there were 7 mice in the 0 to 3 months group, 10 in the 4 to 6 months group, 15 in the 7 to 9 months group, 17 in the 10 to 12 months group, and 23 in the group 13 months and older. In animals younger than 6 months, the retinas showed intense labeling of ganglion cell axons, which converge on the optic nerve from all sectors of the retina (Fig. 3A). Beginning at age 7 months, some retinas had signs of degeneration. Individual ganglion cells started showing signs of remodeling; the somata were shrunken and their dendritic arbors had lost complexity in the sense that their higher order branches had been lost. This is a typical finding in glaucomatous retinas.11 Another typical finding was a sectorial loss of ganglion cells and their axons. In more severe cases, over half of the axons in the retina were lost. We classified the retinas into 3 stages: normal, with no signs of disease; moderate, with remodeled ganglion cells and sectorial axon loss under 50% of the retina; and severe, with ganglion cell and axon loss in more than 50% of the retina. In extreme cases, virtually all of the ganglion cells and their axons were lost (Fig. 3C). This is comparable to what is found in the parental DBA/2J strain.11 We then tested whether the axonal loss apparent in neurofilament staining corresponded to loss of retinal ganglion cells. For this purpose, cells in the ganglion cell layer were counted in 39 retinas with no loss of axons apparent in SMI32 staining, 29 retinas with moderate loss, and 65 retinas with severe loss. Cell counts were obtained from midperiphery in the superior, inferior, nasal, and temporal quadrants. Generally, the cell density in the inferior and nasal quadrants was slightly higher than in the superior and temporal quadrants (Table). In retinas with no signs of glaucoma in SMI32 staining, the mean cell count in the ganglion cell layer was 8306 ± 117 (mean ± SEM, n = 39), which is comparable to numbers obtained from C57bl/6 mice and from pre-glaucomatous DBA/2J mice.11,24 In moderately affected retinas, the total cell count in the ganglion cell layer was 6937 ± 128 (mean ± SEM, n = 29), and in severely affected eyes it was 4866 ± 80 (mean ± SEM, n = 65). These differences were significant (P < 0.05). The ganglion cell layer contains the somata of ganglion cells, but also of displaced amacrine cells, which make up 59% of the cell bodies in that layer.24 Given that in the severely affected retinas the cell count in the ganglion cell layer dropped to 58.6% of the values of unaffected eyes, almost all the ganglion cells have degenerated in these retinas.
Figure 2. .
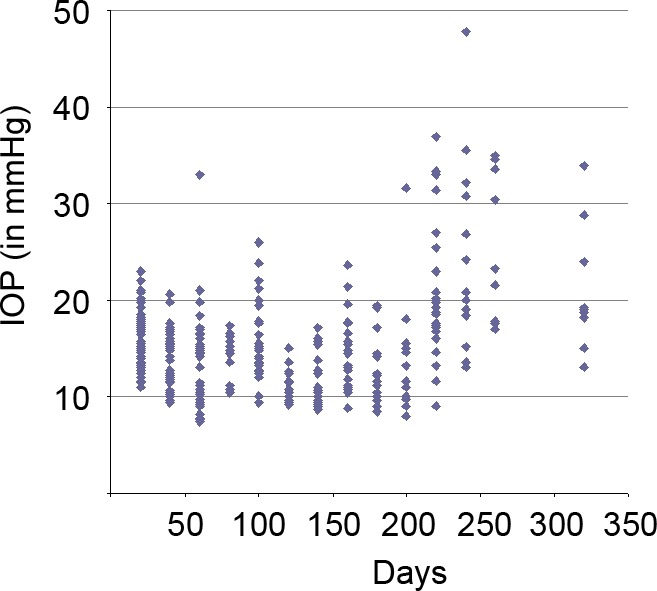
IOP measurement in a cohort of D2.hGFAPpr-GFP mice. Each symbol corresponds to one measurement in one eye. Male and female mice were used. Some mice from the cohort were sacrificed for optic nerve imaging over the course of the experiment.
Figure 3. .

(A) D2.hGFAPp-GFP retina with no signs of glaucomatous degeneration. Axons (red) are stained with an antibody against neurofilament. The panel shows a montage of individual images taken at 10× on a confocal microscope. (B) Retina with a moderate stage of degeneration. In the superior quadrant all axons are lost, whereas axons are well-preserved in the inferior parts of the retina. (C) Retina with severe glaucoma. Except for a small sector in the inferior quadrant of the retina, all axons have degenerated. (D) Percentage of retinas with no signs of degeneration (green), moderate degeneration (yellow, up to 50% of axons are degenerated), and severe degeneration (red, more than 50% of axons are lost). Seven mice were in the age group 0 to 3 months, 10 in the age group 4 to 6 months, 15 in the age group 7 to 9 months, 17 in the age group 10 to 12 months, and 23 over 12 months.
Table. .
Cell Counts in the Ganglion Cell Layer of D2.hGFAPpr-GFP Mice
|
|
Cells per mm2 ± SEM |
||||
| Inferior |
Nasal |
Superior |
Temporal |
Mean |
|
| No | 8542 ± 193 | 8919 ± 204 | 8073 ± 253 | 7675 ± 241 | 8306 ± 117 |
| Moderate | 7333 ± 233 | 7270 ± 275 | 6871 ± 236 | 6258 ± 241 | 6937 ± 128 |
| Severe | 4923 ± 150 | 5230 ± 162 | 4724 ± 163 | 4575 ± 159 | 4866 ± 80 |
Nuclei in the ganglion cell layer were counted in flat-mounted retinas in mid-periphery of the inferior, nasal, superior, and temporal quadrants. Differences between the no glaucoma group, and the moderate and severe groups were significant (P < 0.05) when compared for all four quadrants individually, and for the mean.
Astrocyte Morphology in the Glial Lamina of the Optic Nerve
Immunostaining of cross sections of the optic nerve in the region of the glial lamina with the astrocyte marker GFAP and the axonal marker SMI32 reveals a regular “honeycomb” pattern of astrocyte processes that form glial tubes, through which the axons thread as they leave the globe (Figs. 4A–B). This regular pattern is lost in glaucomatous optic nerve heads, where axon bundles are replaced by GFAP-positive material that resembles a typical glial scar (Figs. 4C–D). It is not possible, however, to discern from this staining what happens to an individual astrocyte; because of their overlap, no single cell is visible. Therefore, we imaged astrocytes in the glial lamina of D2.hGFAPpr-GFP mice by direct confocal microscopy in 100 μm-thick agarose slices. Figure 5 shows typical astrocytes from a normal optic nerve head with no signs of glaucomatous damage in an hGFAPpr-GFP mouse. Typically, the astrocytes in the glial lamina span at least half the diameter of the optic nerve, and send long processes, terminating with end feet, to the pial wall and the blood vessel plexus inside the nerve.13 Figure 6 shows typical astrocytes in nerves from moderately (Figs. 6A–B) and severely (Figs. 6C–D) glaucomatous eyes. On first inspection, the astrocytes from glaucomatous nerves have thickened processes and a reduced spatial coverage; they become smaller and retract processes. We next quantified these changes morphometrically.
Figure 4. .

(A) Cross section through a normal glial lamina with GFAP+ astrocytes in red, axons (neurofilament) in green, and cell nuclei counterstained in blue. The image shows a single confocal section. Scale bar = 50 μm. (B) The meshwork of astrocytes in the glial lamina. The image shows a volume reconstruction of 10 image planes taken on a confocal microscope with astrocytes in red and nuclei in blue. (C) Cross section through the glial lamina of an optic nerve with severe glaucomatous degeneration. The astrocytes (red) appear as a glial scar. Only a few axon bundles are left (green). (D) Higher magnification of the boxed area in (C). The image intensity was optimized for each picture individually.
Figure 5. .
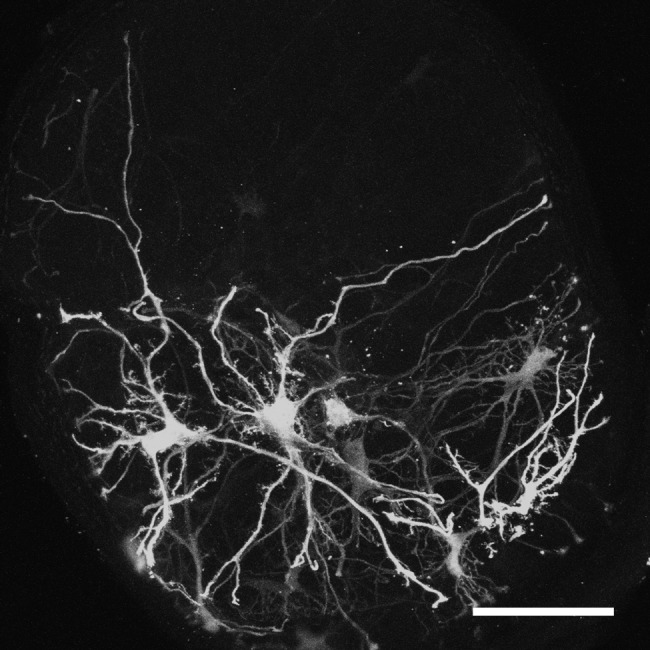
GFP-positive astrocytes in the glial lamina of a hGFAPpr-GFP animal with no glaucomatous degeneration. The image is a maximum-intensity projection of 250 single planes of a confocal image stack through the glial lamina taken at 0.5 μm step size.
Figure 6. .

GFP-positive astrocytes in the glial lamina of glaucomatous D2.hGFAPpr-GFP mice. (A–B) Maximum-intensity projections of confocal stacks through the glial lamina of optic nerves corresponding to retinas with moderate degeneration. (C–D) maximum-intensity projections of confocal stacks through the glial lamina of nerves corresponding to retinas with severe degeneration.
Morphometric Analysis of Astrocytes from Glaucomatous Optic Nerves
The thickness of individual astrocyte processes was measured 10 to 15 μm from the soma on confocal images of GFP-expressing cells. When no signs of glaucoma were present as judged from the corresponding retinal whole mount, mean process thickness was 1.3 ± 0.04 μm (mean ± SEM, n = 50 processes). This is not significantly different from the mean process thickness of astrocytes from the parental hGFAPpr-GFP strain (1.27 ± 0.06 μm, n = 47). In astrocytes from moderately and severely glaucomatous nerves, the mean process thickness was 1.71 ± 0.05 μm (mean ± SEM, n = 87) and 2.1 ± 0.42 μm (mean ± SEM, n = 91), respectively (Fig. 7A). These differences were significant (P < 0.05). For more detailed analysis, we traced examples of astrocytes from maximum-intensity projections through confocal image stacks. This was possible only when the cell was well enough isolated from other astrocytes so its individual processes could be traced. Twelve cells from nine normal optic nerves (age range 2–13 months), 12 cells from 8 moderately affected nerves (age range 9–19 months), and 15 cells from 11 severely affected nerves (age range 9–16 months) satisfied this criterion. In addition, we imaged and traced seven astrocytes from glial laminas of the parental hGFAPpr-GFP strain that does not develop glaucoma. As a measurement of process retraction, we calculated the convex polygon area of these cells (Fig. 7B). Cells from severely degenerated nerves had a significantly smaller convex polygon area (5236.3 ± 494.15 μm2, mean ± SEM) than astrocytes from control hGFAPpr-GFP nerves (11,847.18 ± 1480.57 μm2, mean ± SEM), which is significant (P < 0.05). Astrocytes from eyes with no signs of glaucoma or moderate stages of disease were not significantly different from the astrocytes in the control hGFAPpr-GFP mice (9447.76 ± 865.98 and 9167.64 ± 1684.44 μm2, mean ± SEM). Astrocytes from severely glaucomatous eyes were not only smaller than cells from normal or moderate stages, they were also less complex as indicated by Scholl analysis of their ramification pattern (Fig. 7C). To make the data from Scholl analysis comparable between the four groups, the areas under the curve for each individual astrocyte was calculated. For astrocytes from hGFAPpr-GFP control nerves, the mean area under the curve was 63.57 ± 6.86 (units of area under the curve ± SEM). Astrocytes from the D2.hGFAPpr-GFP mice with no disease were not significantly different (53.5 ± 4.73) from controls. For astrocytes from eyes with severe glaucoma the mean area under the curve was 36.27 ± 3.66. This difference was statistically significant (P < 0.05). Astrocytes from moderately affected eyes fell in the middle with a mean area under the curve of 47.83 ± 5.23, although that was not significantly different from the astrocytes from the control eyes.
Figure 7. .
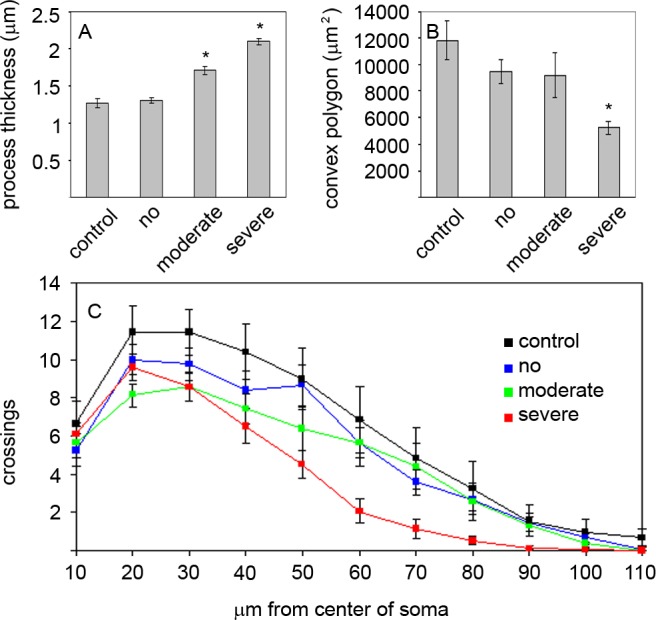
Morphometric analysis of astrocytes in the glial lamina. (A) Thickness of astrocyte processes measured 10 to 15 μm from the soma in optic nerves from control eyes from hGFAPpr-GFP animals and eyes from the D2.hGFAPpr-GFP animals with no, moderate, and severe degeneration. Asterisks indicate P < 0.05. (B) Convex polygon area of astrocytes in the glial lamina of control eyes and eyes with no, moderate, and severe degeneration. Asterisk indicates P < 0.05. (C) Scholl analysis. Error bars represent the SEM.
Astrocytes in the Glial Lamina Show Signs of Localized Remodeling
Volume reconstructions of individual well-isolated astrocytes in the glial lamina showed that the astrocytes are generally oriented transversely, spanning the diameter of the optic nerve with very few processes in the longitudinal direction (Fig. 8A). The astrocytes are slightly curved backwards, with the convex face away from the retina. In 5 optic nerves from animals of 6 months of age, with no obvious signs of glaucoma in the retina, we noticed in three-dimensional reconstruction of astrocytes that they had large protrusions that sprouted out from individual processes at a right angle (i.e., longitudinally along the nerve, as indicated in the cartoons in Figs. 8A, B). Figure 8D shows a three-dimensional reconstruction of such an appendage. We stained sections containing such cells with an antibody against neurofilaments to visualize the longitudinal appendage relative to axon bundles (Fig. 8E). The appendage is shown growing into the axon bundle, rather than participating in the glial tube around it. Counterstaining with antibodies against GFAP shows that these processes are devoid of this intermediate filament. It is noteworthy that the appendages did not grow out of all processes of the astrocyte, but that this remodeling was localized. As no frank degeneration of ganglion cells and their dendritic arbors were obvious in the corresponding retinas, and their cell counts in the ganglion cell layer were normal (9190 ± 490 cells/mm2), this localized remodeling of individual astrocytic processes in the optic nerve seemed to be a very early event in the response of astrocytes in glaucomatous DBA/2J. Further work will be necessary to document this effect and to establish the precise sequence of structural events in the astrocytes.
Figure 8. .
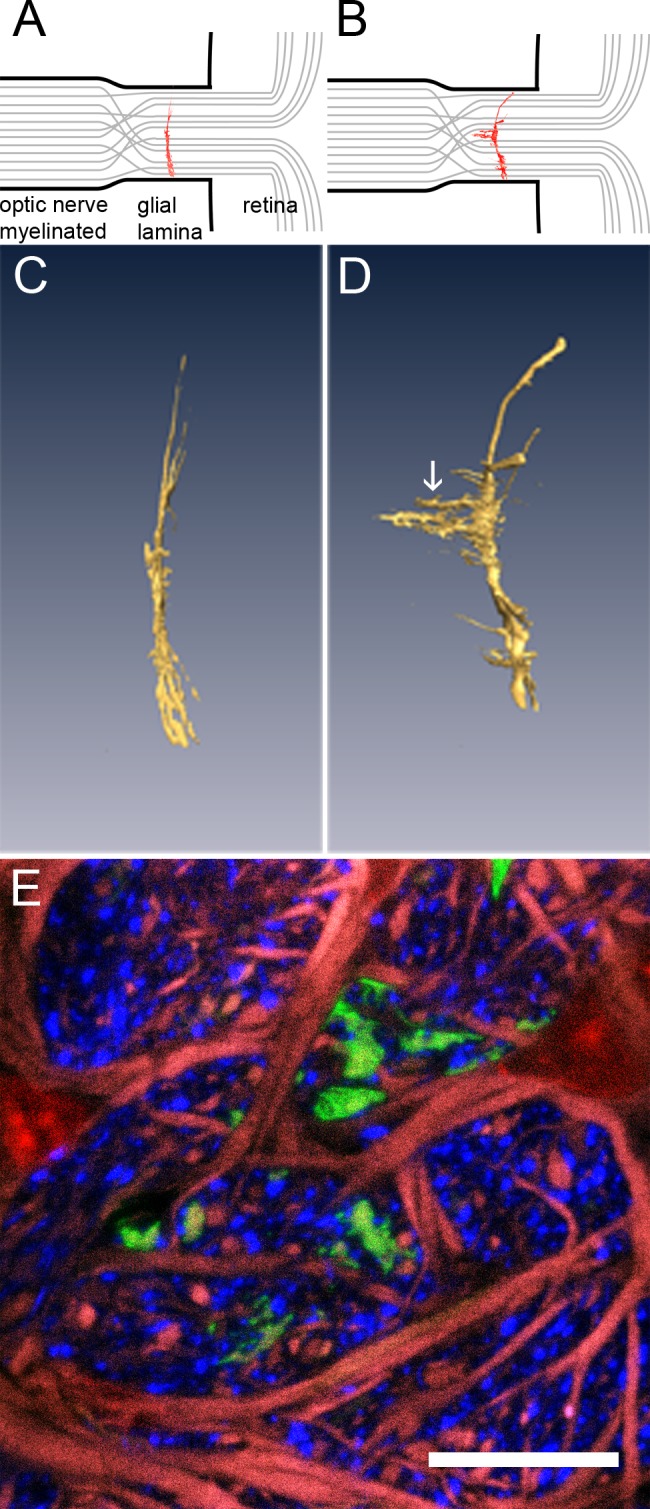
Astrocytes show signs of localized remodeling. Cartoons in (A) and (B) show the relative localization of astrocytes (red) in the glial lamina. Axon bundles are in grey. (C) Three-dimensional reconstruction of a typical astrocyte in the glial lamina of a healthy mouse. The cell is curved slightly backwards from the retina, but essentially flat and oriented transversely to the long axis of the optic nerve. (D) Astrocyte from a D2.hGFAPpr-GFP mouse, aged 6 months, with no apparent signs of damage in the retina. The white arrow points to the appendages that grow out of a primary process of the cell. (E) Cross section through the appendage (green), counterstained for axons (neurofilament, blue), GFAP (red), and nuclei (red).
Discussion
We crossed hGFAPprGFP, a mouse line that expresses GFP in individual astrocytes,19 into the DBA/2J background to arrive at a mouse line that developed glaucoma spontaneously and allowed the astrocytes in the optic nerve to be observed directly by confocal microscopy. Beginning at 7 to 9 months of age, this strain begins displaying increased intraocular pressure and various degrees of severity of glaucoma in the retina. This behavior is similar to what is reported from the parental DBA/2J strain.8 In particular, a characteristic feature of glaucoma in mice is the sectorial defect of ganglion cells and their axons in the retina.10–12 This pattern is observed in D2.hGFAPpr-GFP mice as well.
The astrocytes in the optic nerve head have a characteristic shape. They are oriented transversely to the long axis of the optic nerve, and send long processes to the pial wall and the blood vessels inside the nerve, which they contact with end feet.13 The astrocytes are slightly bowed backwards from the retina, giving them in transverse section the characteristic “catcher's mitt” appearance. In the mouse, the astrocytes of the glial lamina show an extremely dense meshwork of intermediate filament fibers so that even in normal, non-reactive optic nerves, the astrocytes show strong GFAP immunoreactivity.13,15 Short-term elevation of intraocular pressure in rats using the episcleral vein sclerotization model has been shown to lead to a temporary reduction in GFAP labeling that returns to baseline levels greater than 4 weeks after injury.25 However, another study, using only moderate increases of IOP, has found no significant changes in GFAP expression in the optic nerve head.26 It is difficult to see individual astrocytes in GFAP immunostaining because the cells partly overlap and obscure each other and GFAP does not fill the whole cell, leaving the smallest processes unlabeled.27 Yet, morphologic changes in astrocytes after short-term elevation of IOP were described in pigs. In this model, within hours after elevation of IOP, nodular swellings of astrocytes appeared, and a distortion of the intricate network of processes was observed.28 Interestingly, an increase in IOP also leads to a decrease in immunostaining for the gap junctional marker connexin 43,25 suggesting that the astrocytes lose connections to each other. This could indicate increased mobility of individual cells as they reorganize the tissue architecture in the optic nerve head. Increased mobility of astrocytes induced by (orthostatic) pressure has been documented in vitro.29
When becoming reactive, the astrocytes of the murine glial lamina undergo morphologic changes. An optic nerve crush injury leads to a biphasic reaction of astrocytes.30 In a first phase, the cells retract processes, round up, and drastically reduce spatial coverage. In a second phase, they re-extend long processes, and re-assume a more normal morphology. In glaucomatous optic nerves, we never observed astrocytes that resembled the cells in the first phase after optic nerve crush. It is possible that we never encountered cells in this phase of remodeling because this phase is very transient (i.e., the cells retract and re-extend their processes in a matter of days once the remodeling has been triggered). An alternative explanation would be that the slow and chronic nature of glaucomatous damage leads to a different type of reactive response in the astrocytes.
Glaucoma, at least in moderate stages, leads to a loss of axon bundles in part, but not the whole extent, of the optic nerve with a corresponding sectorial defect of ganglion cells and their axons in the retina. However, the astrocyte network of the glial lamina, which separates ganglion cell axons into bundles, spans the whole nerve. This raises the question of how the astrocytes can react to a focal, localized insult of axon bundles, since any one astrocyte spans several axon bundles. Here, we present evidence that astrocytes are capable of compartmentalized reactivity, which only takes place in individual processes and does not necessarily involve the whole cell, since the sprouting of thin processes was localized–not the whole astrocyte extends new processes, only part of the cell does. These new processes are immunonegative for GFAP. This may be due to the fact that GFAP does not label the smallest processes of astrocytes.27 Another possibility would be that these processes may play a phagocytic rather than structural role. Astrocytes have been shown to be capable of phagocytosis.31,32 Recently, it has been shown that astrocytes in the myelinisation transition zone of the optic nerve actively phagocytose axonal material.33 It is, therefore, an interesting possibility that the localized processes of astrocytes in glaucomatous D2.hGFAPpr-GFP mice are phagocytic. This remodeling precedes the other morphologic changes seen in astrocytes in later stages of glaucomatous degeneration (shrinkage and simplification of the processes). The sprouting, thus, appears to be the initial response of the astrocytes—before the process retraction and thickening that are so prominent at later stages. However, we can report here only that such process extension was observed: further work should examine in finer detail the composition of the sprouting processes and their relation to the injured axons.
Acknowledgments
The authors thank Richard Masland for reading the manuscript.
Footnotes
Supported by NIH Grant EY019703 and by grants from the Glaucoma Foundation and the American Health Assistance Foundation, by the Core Grant EY14104 (to Massachusetts Eye and Ear Infirmary), and by grants from Research to Prevent Blindness and the Massachusetts Lions Eye Research Fund.
Disclosure: M. Lye-Barthel, None; D. Sun, None; T.C. Jakobs, None
References
- 1. Quigley HA, Addicks EM. Chronic experimental glaucoma in primates. II. Effect of extended intraocular pressure elevation on optic nerve head and axonal transport. Invest Ophthalmol Vis Sci. 1980; 19: 137–152 [PubMed] [Google Scholar]
- 2. Quigley HA, Addicks EM, Green WR, Maumenee AE. Optic nerve damage in human glaucoma. II. The site of injury and susceptibility to damage. Arch Ophthalmol. 1981; 99: 635–649 [DOI] [PubMed] [Google Scholar]
- 3. Johansson JO. Inhibition of retrograde axoplasmic transport in rat optic nerve by increased IOP in vitro. Invest Ophthalmol Vis Sci. 1983; 24: 1552–1558 [PubMed] [Google Scholar]
- 4. Johansson JO. Inhibition and recovery of retrograde axoplasmic transport in rat optic nerve during and after elevated IOP in vivo. Exp Eye Res. 1988; 46: 223–227 [DOI] [PubMed] [Google Scholar]
- 5. Balaratnasingam C, Morgan WH, Bass L, Matich G, Cringle SJ, Yu DY. Axonal transport and cytoskeletal changes in the laminar regions after elevated intraocular pressure. Invest Ophthalmol Vis Sci. 2007; 48: 3632–3644 [DOI] [PubMed] [Google Scholar]
- 6. Salinas-Navarro M, Alarcon-Martinez L, Valiente-Soriano FJ, et al. Functional and morphological effects of laser-induced ocular hypertension in retinas of adult albino Swiss mice. Mol Vis. 2009; 15: 2578–2598 [PMC free article] [PubMed] [Google Scholar]
- 7. Quigley HA, McKinnon SJ, Zack DJ, et al. Retrograde axonal transport of BDNF in retinal ganglion cells is blocked by acute IOP elevation in rats. Invest Ophthalmol Vis Sci. 2000; 41: 3460–3466 [PubMed] [Google Scholar]
- 8. Libby RT, Anderson MG, Pang IH, et al. Inherited glaucoma in DBA/2J mice: pertinent disease features for studying the neurodegeneration. Vis Neurosci. 2005; 22: 637–648 [DOI] [PubMed] [Google Scholar]
- 9. Howell GR, Libby RT, Jakobs TC, et al. Axons of retinal ganglion cells are insulted in the optic nerve early in DBA/2J glaucoma. J Cell Biol. 2007; 179: 1523–1537 [DOI] [PMC free article] [PubMed] [Google Scholar]
- 10. Danias J, Lee KC, Zamora MF, et al. Quantitative analysis of retinal ganglion cell (RGC) loss in aging DBA/2NNia glaucomatous mice: comparison with RGC loss in aging C57/BL6 mice. Invest Ophthalmol Vis Sci. 2003; 44: 5151–5162 [DOI] [PubMed] [Google Scholar]
- 11. Jakobs TC, Libby RT, Ben Y, John SW, Masland RH. Retinal ganglion cell degeneration is topological but not cell type specific in DBA/2J mice. J Cell Biol. 2005; 171: 313–325 [DOI] [PMC free article] [PubMed] [Google Scholar]
- 12. Schlamp CL, Li Y, Dietz JA, Janssen KT, Nickells RW. Progressive ganglion cell loss and optic nerve degeneration in DBA/2J mice is variable and asymmetric. BMC Neurosci. 2006; 7: 66 [DOI] [PMC free article] [PubMed] [Google Scholar]
- 13. Sun D, Lye-Barthel M, Masland RH, Jakobs TC. The morphology and spatial arrangement of astrocytes in the optic nerve head of the mouse. J Comp Neurol. 2009; 516: 1–19 [DOI] [PMC free article] [PubMed] [Google Scholar]
- 14. May CA, Lutjen-Drecoll E. Morphology of the murine optic nerve. Invest Ophthalmol Vis Sci. 2002; 43: 2206–2212 [PubMed] [Google Scholar]
- 15. Morcos Y, Chan-Ling T. Concentration of astrocytic filaments at the retinal optic nerve junction is coincident with the absence of intra-retinal myelination: comparative and developmental evidence. J Neurocytol. 2000; 29: 665–678 [DOI] [PubMed] [Google Scholar]
- 16. Hernandez MR. The optic nerve head in glaucoma: role of astrocytes in tissue remodeling. Prog Retin Eye Res. 2000; 19: 297–321 [DOI] [PubMed] [Google Scholar]
- 17. Morrison JC, Cepurna Ying Guo WO, Johnson EC. Pathophysiology of human glaucomatous optic nerve damage: insights from rodent models of glaucoma. Exp Eye Res. 2011; 93: 156–164 [DOI] [PMC free article] [PubMed] [Google Scholar]
- 18. Neufeld AH, Liu B. Glaucomatous optic neuropathy: when glia misbehave. Neuroscientist. 2003; 9: 485–495 [DOI] [PubMed] [Google Scholar]
- 19. Nolte C, Matyash M, Pivneva T, et al. GFAP promoter-controlled EGFP-expressing transgenic mice: a tool to visualize astrocytes and astrogliosis in living brain tissue. Glia. 2001; 33: 72–86 [PubMed] [Google Scholar]
- 20. Pittler SJ, Baehr W. Identification of a nonsense mutation in the rod photoreceptor cGMP phosphodiesterase beta-subunit gene of the rd mouse. Proc Natl Acad Sci U S A. 1991; 88: 8322–8326 [DOI] [PMC free article] [PubMed] [Google Scholar]
- 21. Chang B, Smith RS, Hawes NL, et al. Interacting loci cause severe iris atrophy and glaucoma in DBA/2J mice. Nat Genet. 1999; 21: 405–409 [DOI] [PubMed] [Google Scholar]
- 22. Anderson MG, Smith RS, Hawes NL, et al. Mutations in genes encoding melanosomal proteins cause pigmentary glaucoma in DBA/2J mice. Nat Genet. 2002; 30: 81–85 [DOI] [PubMed] [Google Scholar]
- 23. Sternberger LA, Sternberger NH. Monoclonal antibodies distinguish phosphorylated and nonphosphorylated forms of neurofilaments in situ. Proc Natl Acad Sci U S A. 1983; 80: 6126–6130 [DOI] [PMC free article] [PubMed] [Google Scholar]
- 24. Jeon CJ, Strettoi E, Masland RH. The major cell populations of the mouse retina. J Neurosci. 1998; 18: 8936–8946 [DOI] [PMC free article] [PubMed] [Google Scholar]
- 25. Johnson EC, Deppmeier LM, Wentzien SK, Hsu I, Morrison JC. Chronology of optic nerve head and retinal responses to elevated intraocular pressure. Invest Ophthalmol Vis Sci. 2000; 41: 431–442 [PubMed] [Google Scholar]
- 26. Lam TT, Kwong JM, Tso MO. Early glial responses after acute elevated intraocular pressure in rats. Invest Ophthalmol Vis Sci. 2003; 44: 638–645 [DOI] [PubMed] [Google Scholar]
- 27. Bushong EA, Martone ME, Jones YZ, Ellisman MH. Protoplasmic astrocytes in CA1 stratum radiatum occupy separate anatomical domains. J Neurosci. 2002; 22: 183–192 [DOI] [PMC free article] [PubMed] [Google Scholar]
- 28. Balaratnasingam C, Morgan WH, Bass L, et al. Elevated pressure induced astrocyte damage in the optic nerve. Brain Res. 2008; 1244: 142–154 [DOI] [PubMed] [Google Scholar]
- 29. Tezel G, Hernandez MR, Wax MB. In vitro evaluation of reactive astrocyte migration, a component of tissue remodeling in glaucomatous optic nerve head. Glia. 2001; 34: 178–189 [DOI] [PubMed] [Google Scholar]
- 30. Sun D, Lye-Barthel M, Masland RH, Jakobs TC. Structural remodeling of fibrous astrocytes after axonal injury. J Neurosci. 2010; 30: 14008–14019 [DOI] [PMC free article] [PubMed] [Google Scholar]
- 31. Kalmar B, Kittel A, Lemmens R, Kornyei Z, Madarasz E. Cultured astrocytes react to LPS with increased cyclooxygenase activity and phagocytosis. Neurochem Int. 2001; 38: 453–461 [DOI] [PubMed] [Google Scholar]
- 32. Ito U, Nagasao J, Kawakami E, Oyanagi K. Fate of disseminated dead neurons in the cortical ischemic penumbra: ultrastructure indicating a novel scavenger mechanism of microglia and astrocytes. Stroke. 2007; 38: 2577–2583 [DOI] [PubMed] [Google Scholar]
- 33. Nguyen JV, Soto I, Kim KY, et al. Myelination transition zone astrocytes are constitutively phagocytic and have synuclein dependent reactivity in glaucoma. Proc Natl Acad Sci U S A. 2011; 108: 1176–1181 [DOI] [PMC free article] [PubMed] [Google Scholar]