

Abstract
Drug-induced liver injury is a serious and frequently occurring adverse drug reaction in the clinics and is hard to predict during preclinical studies. Today, primary hepatocytes are the most frequently used cell model for drug discovery and prediction of toxicity. However, their use is marred by high donor variability regarding drug metabolism and toxicity, and instable expression levels of liver-specific genes such as cytochromes P450. An in vitro model system based on human embryonic stem cells (hESC), with their unique properties of pluripotency and self-renewal, has potential to provide a stable and unlimited supply of human hepatocytes. Much effort has been made to direct hESC toward the hepatic lineage, mostly using 2-dimensional (2D) cultures. Although the results are encouraging, these cells lack important functionality. Here, we investigate if hepatic differentiation of hESC can be improved by using a 3-dimensional (3D) bioreactor system. Human ESCs were differentiated toward the hepatic lineage using the same cells in either the 3D or 2D system. A global transcriptional analysis identified important differences between the 2 differentiation regimes, and we identified 10 pathways, highly related to liver functions, which were significantly upregulated in cells differentiated in the bioreactor compared to 2D control cultures. The enhanced hepatic differentiation observed in the bioreactor system was also supported by immunocytochemistry. Taken together, our results suggest that hepatic differentiation of hESC is improved when using this 3D bioreactor technology as compared to 2D culture systems.
Introduction
Liver injuries are found to occur frequently and cause suffering and distrust in the public healthcare. Drug-induced liver injury (DILI), in particular, is a major problem since these incidences in many cases cause severe hepatic injury, are difficult to predict, and often are identified only after marketing of the drug. In fact, DILI is one of the most frequent reasons for the withdrawal of an approved drug from the market, and accounts for up to 50% of acute liver failure cases [1,2]. DILI is also one of the most common reasons that clinical trials of new therapeutic agents are terminated. Thus, because of the severity and rarity of these DILI reactions, a large number of drugs have been withdrawn from the market since 1990 [3]. As a result, the medical companies suffer major losses due to unnecessary investments into late clinical phases and loss of momentum in research.
Animal experiments are important tools in drug discovery today. However, animal tests are neither cost effective nor ethical or predictive, as there are major species differences regarding drug metabolism and toxicity. Hence, there is a high demand for innovative human-predictive in vitro test systems with increased predictability. Human primary hepatocytes (hPH), together with cardiomyocytes and neurons, are considered to be the most important cell types for early drug discovery and toxicity studies. However, there is a large and unmet demand of hPH due to the often scarce and unpredictable availability of fresh liver samples. Another issue regarding the use of hepatocytes is the huge variation in cell functions and metabolic capacity, especially Cytochrome P450 (CYP) activities [4,5], which in part may be explained by an interdonor variability.
Human embryonic stem cells (hESC) are one of the most versatile cell types known, due to the capability of self-renewal and the property of pluripotency. Their ability to differentiate into all cell types in the adult human body provides a valuable tool for drug discovery, toxicology research, and regenerative medicine. By directing the hESC toward specific cell types, they have the potential to constitute an almost endless supply of different functional cells types. During the last decades, much effort has been made to derive hepatocytes from hESC, and numerous studies report on hepatocyte-like cells (HEP) that in many aspects resemble their in vivo counterparts [6–9]. However, the hESC-derived HEP have in some aspects demonstrated reduced hepatic functionality when compared to hPH. The research on differentiation of hESC into HEP has mainly been done in 2-dimensional (2D) culture. However, the stem cell 3-dimensional (3D) niche is the basis for differentiation [10] and maintenance of differentiated status [11,12]. Based on that, we have investigated if the differentiation of hESC toward hepatocytes can be improved by using a 3D culture system that better mimics the in vivo situation. For this purpose, we have used a perfused, 4-compartment bioreactor with decentralized nutrient and gas supply to the cells, mimicking the blood flow in the liver. Interestingly, our results presented here show that the extent of hepatic differentiation is improved with 3D culture compared to a conventional 2D culture.
Materials and Methods
Three-dimensional bioreactor technology
The perfused, laboratory-scale bioreactor (Stem cell systems) used consists of a polyurethane housing containing 3 independent, interwoven bundles of capillaries (Fig. 1). The capillaries consist of hollow fiber membranes, creating a 3D scaffold enclosed in a 2-mL volume cell compartment. A more schematic illustration of the bioreactor has been reported by Zeilinger et al. [13]. Two of the capillary bundles consist of hydrophilic medium perfusion membranes with a molecular weight cut-off at approximately MW 500,000. The third bundle is made of hydrophobic multilaminate hollow fiber membrane for gas exchange via diffusion. The 2 medium bundles have a counter-current flow, and together with the integrated gas exchange, the mass exchange and gradient distances conditions are more similar to in vivo conditions (Fig. 1) [14]. The cells are inoculated in the cell compartment around the extracapillary space, and supported by the decentralized medium and gas perfusion. The bioreactor is connected to a standard, medical-grade, dialysis polyvinyl chloride tubing system and integrated into a processor-controlled perfusion device (Stem cell systems), generating a perfusion circuit through the bioreactor. A fresh medium is continuously supplied from a medium bottle and mixed with a recirculating medium. Excess medium flows out into a waste bottle. A port allows sampling from the recirculating medium. The perfusion devise sustains stable and well-controlled conditions regarding temperature (37°C within the perfusion circuit) and gas supply (95% air and 5% CO2). The airflow is kept constant throughout each experiment, while the CO2 flow is adjusted to maintain the medium pH at physiological conditions (pH∼7.4).
FIG. 1.
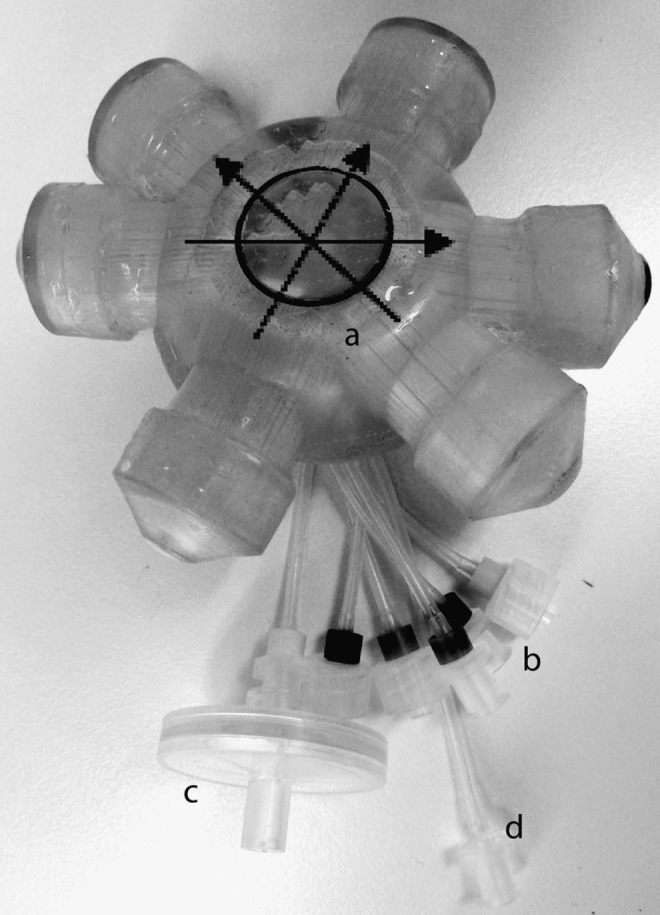
The 3-dimensional (3D) bioreactor technology. A 4-compartment, perfused bioreactor with a 2-mL cell compartment (a) and connections for medium (b) and gas (c) perfusion, together with a port for cell inoculation (d). Filled arrows show medium flow direction, and the dotted arrows indicate gas flow through the bioreactor. A schematic view of the bioreactor is presented by Zeilinger et al. [13].
Preparation and differentiation of hESC toward hepatocytes
The hESC cell line SA121 (Cellartis AB; http://cellartis.com) was derived and characterized as previously described [15]. The undifferentiated cells (UD) were cultured as a monolayer and enzymatically passaged every 3–4 days according to Cellectis culture protocols (DEF-CS™). Induction of hESC into definitive endoderm (DE) was initiated by a 24-h pretreatment in a Cellectis proprietary pretreatment medium supplemented with 5 nM Rock Inhibitor (Merck) [16], followed by 1 day in an RPMI 1640 medium (Invitrogen), supplemented with 1% GlutaMax, 0.1% Pen/Strep, 1× B27 supplement (Invitrogen), and 100 ng/mL Activin A (PreProtech) supplemented with 1 mM sodium butyrate. The medium was then supplemented with only 0.5 mM sodium butyrate the following 5 days and changed with an interval of 1–2 days. At day 7, the DE cells were split with TrypLE™ Select (Invitrogen), suspended in a progenitor medium [composed of Advanced RPMI 1640 (Gibco) supplemented with 1% GlutaMax, 0.1% Pen/Strep, 0.2% FBS (Invitrogen), 50 ng/mL BMP2, 100 ng/mL aFGF, 200 ng/mL BMP4 (Promocell), and 5 ng/mL bFGF (PreProtech) supplemented with 5 nM Rock Inhibitor], and either inoculated into bioreactors, seeded in 2D controls, or seeded in flasks for further differentiation (Fig. 2A). A minimum of 25 million cells were inoculated into the cell compartment of the bioreactors. The cells were perfused with a constant medium recirculation rate of 12 mL/min with a 20 mL/min gas mixture (95% air and 5% CO2). Fresh medium was supplied with a feed rate of 2 mL/h. For the 2D control cultures 75,000 cells/cm2 were seeded on Matrigel-coated 12-well plates in the presence of 5 nM Rock Inhibitor and cultured at 37°C with 5% CO2. The cells were cultured for 3 days in a progenitor medium, followed by 7 days in a knockout DMEM (Invitrogen) supplemented with 1% GlutaMax, 1% NEAA (Invitrogen), 0.1 mM β-mercaptoethanol, 20% knockout serum replacement (Invitrogen) and 1% Pen/Strep, and 1% dimethyl sulfoxide (DMSO) with a medium change every second day. At day 12, the cells were differentiated into a progenitor (PRO) stage and were split with TrypLE Select, and either inoculated in the bioreactor or seeded in 2D control cultures (Fig. 2A). The cells were further matured into hepatocyte-like cells (HEP) by culturing them in Williams medium E (Gibco) supplemented with SingleQuotes (without GA1000; Lonza), 1% GlutaMax, 1% Pen/Strep, 10 ng/mL oncostatin M, 20 ng/mL HGF (Promocell), 0.1 μM dexamethasone, and 0.5% DMSO (Sigma) with a medium change every second day. The DE and PRO bioreactors were cultured separate, but in parallel, in the same perfusion system and under identical external conditions throughout the differentiation process.
FIG. 2.

Schematic overview of the experimental setup and hierarchical clustering. (A) Cells were inoculated into the bioreactors at 2 different stages during the differentiation process: either as definitive endoderm (DE) at day 7 or as hepatic progenitors (PRO) at day 12. The differentiation was initiated with undifferentiated cells (UD) in 2-dimensional (2D) at day 0. At day 7, the DE cells were passaged (p) and either inoculated into the bioreactor, seeded in 2D controls, or in 2D flasks for further culture. On day 12, PRO cells from the 2D flasks were passaged and either inoculated into bioreactors or seeded in 2D controls. Cells were then cultured for further maturation until day 26, generating hepatocyte-like cells (HEP). (B) A global clustering of the replicated samples of UD, DE, PRO, HEP, and human primary hepatocytes (hPH) group tightly together. Pearson correlation was used as distance measure and average linkage to create the dendrogram. The lengths of the lines indicate quantitative distances between the samples. The differentiated HEP make up a larger cluster. Sample 2D.HEP represent control samples of HEP differentiated in a 2D system without passage at day 12. Sample 2D.HEP.PRO represent control samples of HEP differentiated in a 2D system and with a passage at day 12. Sample 3D.HEP.DE means HEP that are differentiated in the 3D system and inoculated in the bioreactor at day 7. Sample 3D.HEP.PRO means HEP that are differentiated in the 3D system and inoculated into the bioreactor at day 12. Small letters represent the 4 experimental replicates.
RNA extraction and real-time polymerase chain reaction
Cells were collected at defined time points and stored in RNA Cell Protect (Qiagen) at −20°C until RNA was extracted. Total RNA was extracted from cells using an RNEasy Plus Mini Kit (Qiagen) according to the manufacturer's instruction. About 0.6 μg total RNA was reverse transcribed in a final volume of 20-μL reaction mix of the High Capacity cDNA Reverse transcriptase Kit (Applied Biosystems). Real-time polymerase chain reaction (PCR) was carried out using ready-to-use TaqMan Gene Expression Assays (Applied Biosystems), according to the manufacturer's instructions. CREB-binding protein (CREBBP) and TATA-binding protein (TBP) were used as reference genes.
Microarray experiments
The RNA was quantified using NanoDrop ND-1000 (NanoDrop Technologies). The quality of the RNA and cDNA, labeled by in vitro transcription, was verified using an Agilent Bioanalyzer (Agilent Technologies), and only samples with an RNA integrity number values >7 were accepted for the microarray analysis. Microarray experiments were conducted on samples of UD, DE, PRO, and HEP, differentiated using either the 2D or 3D differentiation system (Fig. 2A). In addition, hPH isolated from the adult liver were included as reference sample. The liver samples originate from 3 different patients who have undergone liver resection (Sahlgrenska Hospital, Gothenburg, Sweden), derived with donor consent. The differentiation experiments were repeated 4 times to generate biological replicates. To measure the mRNA expression, fragmented cDNA was hybridized at 45°C for 16 h to whole-transcript Gene ST 1.0 arrays (Affymetrix), according to instructions from the vendor. The microarrays, covering 33,297 transcripts, were scanned on a GeneChip Scanner 3000 7G (Affymetrix), and expression signals were extracted and normalized using the Expression Console™ (Affymetrix) applying the Robust Multichip Average (RMA) method. RMA is a 3-step procedure, including background subtraction, quantile normalization, and probe summarization. To verify the results of the microarray, 7 of the most significant and relevant up- and downregulated genes were analyzed by real-time PCR (RT-PCR) (as described above).
Data analysis
Identification of differentially expressed transcripts
The reproducibility in the experiments was verified by hierarchical clustering of the global transcriptional dataset using Pearson correlation and average linkage. Three arrays (all from the same experiment) did not group together with their corresponding sample groups and were therefore discarded from the dataset. The dataset was further filtered by removing probe sets with expression values below or close to background levels, and probe sets with log2 values below 5 in all samples were removed from further analysis. Expression values of pluripotent markers in the differentiated samples were used to guide in selection of appropriate background-filtering threshold. For the remaining probe sets, the fold-change (FC) values between paired 2D and 3D samples were calculated for each experiment individually, and one-sample t-test was applied to identify transcripts that were differentially expressed between the 2D and 3D culturing systems. A combined criterion of uncorrected P value <0.05 and FC values >2 was used to identify transcripts with statistical and biological differences [17–19]. Moreover, the set of differentially expressed genes was further filtered to only include genes annotated with official gene symbols. Also, nonhepatic genes were investigated during the stepwise differentiation. A set of 481 genes with expression below background in hPH and above background in UD was monitored during the differentiation.
Analysis of similarities in the global gene expression
To assess the similarity of the hESC-derived hepatocytes to the hPH, the similarities in gene expression across the samples were investigated. A criterion for assessment of similarity based on CV<30% between replicated samples and a FC<1.5 between pairwise comparisons of groups as defined in [20] was used, and the number of genes that fulfilled both these cutoffs was calculated. The FC values were calculated using the average expression of the biological replicates.
Pathway analysis
To explore putative mechanistic effects of the 3D differentiation system, over-representation of pathways among the up- and downregulated genes in the 3D system compared to the 2D system was investigated. All genes with a P value <0.05 (Supplementary Table S1; Supplementary Data are available online at www.liebertpub.com/scd) were used as input to DAVID, and significantly over-represented gene sets in the manually created KEGG pathway database (www.genome.jp/kegg) [21] were identified.
Gene ontology enrichment analysis
The functional properties of genes that showed differential expression using the 3D differentiation system compared to the 2D system were investigated. A Gene ontology (GO) [22] enrichment analysis was performed using the DAVID bioinformatics resource [23], and significantly over-represented GO annotations for biological process (BP), molecular function (MF), and cellular component (CC) among the up- versus downregulated genes were identified. All enrichment calculations were performed as previously described [24]. Again, all genes with a P value <0.05 (Supplementary Table S2) were used as the input to the enrichment analyzes, and all genes represented on the arrays were used as the reference list. The hypergeometric test was applied to identify significantly over-represented annotations (P<0.01) from all 3 categories using the GO Fat set, in which the broadest terms are filtered as described in the documentation for DAVID [23].
Determination of metabolic parameters
Samples from the recirculating medium were taken every 2–3 days for biochemical analyses done at the clinical chemistry laboratory at the Karolinska University Hospital. The metabolic activity of the cells was measured by glucose consumption and lactate production. Hepatocellular injury was determined by lactate dehydrogenase (LDH), aspartate aminotransferase (ASAT), and alanine aminotransferase (ALAT) release.
Cytochrome P450 activity experiments
At the end of the differentiation procedure (day 23), the basal CYP activity was measured. The feeding of the fresh medium was stopped, leaving only the recirculating medium to perfuse the cells. A CYP cocktail was added through the sampling port and mixed with the medium, generating final concentrations of 3 μM midazolam (Dormicum; Roche Pharma), 9 μM diclofenac, 26 μM phenacetin (Sigma-Aldrich), and 100 μM bupropion (Toronto Research Chemicals). About 200 μL samples were taken after 10-h and 24-h incubation and frozen at −20°C until analyzed. After the CYP activity experiment, the bioreactor circuit was rinsed with 50 mL medium, and the fresh medium feeding was reconnected to the standard, continuous operation mode. The metabolite concentrations of 1-hydroxymidazolam, paracetamol, 4-hydroxydiclofenac, and hydroxybupropion in the medium were analyzed at AstraZeneca as previously described [25].
Immunohistochemistry
At day 26 of differentiation, the bioreactors were shut down and disconnected. The top of the bioreactor was cut open, and the capillary layers with surrounding cells were carefully removed as a block, without disrupting the structure. The sample was transferred to a histology cassette, fixed in 5% formaldehyde, dehydrated with increasing concentrations of ethanol, primed with xylene, and then embedded in wax. From the material left in the bioreactor, a sample of cells was collected for RNA analysis. The block of cells and capillaries from the bioreactor was sent for preparation at a histological technical center (Histo-center AB; www.histocenter.se) where it was cut into ∼5-μm sections and stained with hematoxylin–eosin or antibodies for α-1-antitrypsin (A1AT), breast cancer resistance protein (BCRP; ABcam), and cytochrome P450 3A4 (CYP3A4, Cypex). The human liver, used as the reference sample, was derived from the Karolinska University Hospital (Huddinge, Sweden) by qualified medical staff and with donor-informed consent according to ethics and institutional guidelines. Immunofluorescence microphotographs were taken using a Zeiss LSM 710 confocal microscopy with Zen 2008 software (Carl Zeiss).
Results
Hierarchical clustering
Results from the global hierarchical clustering showed that samples clustered tightly together groupwise for UD, DE, PRO, HEP, and hPH (Fig. 2B). Notably, no significant difference of mRNA expression at the global scale was observed between inoculating cells at the DE stage or at the PRO stage into the bioreactor. As shown in Fig. 2B, these 2 groups make one large cluster in the dendrogram.
Differentially expressed genes
Genes that were differentially expressed using the 3D system compared to the 2D system were identified using a combined criterion of P value <0.05 and FC>2. After filtering the low-expressed transcripts, 29,160 probe sets remain in the dataset. In total, 4,345 of these had a P value <0.05 and of these were 2,834 annotated with an official gene symbol, and 1,056 were upregulated when the differentiation was performed in the bioreactor, and 1,778 were downregulated. To increase the biological relevance of our results, genes with transcriptional differences FC<2 between the 3D and 2D systems were filtered. Considering these criteria, in total, 102 genes were upregulated, and 63 genes were downregulated (Supplementary Table S1) when the hepatocyte differentiation was performed in the bioreactor compared to in the 2D differentiation system (Fig. 3A). A set of 481 genes identified as not expressed in hPH and with expression above background in UD were monitored during differentiation, and a stepwise silencing of 55% of these genes was observed; 80 genes were downregulated at day 7, and 144 additional genes were downregulated at day12, and another 39 genes were downregulated at day 26 (3D) (Fig. 3B). To verify the microarray results, we analyzed 7 of the most significant down- and upregulated genes by RT-PCR (Fig. 4 and Supplementary Table S1). Indeed, the results from these analyses are in accordance with the microarray results.
FIG. 3.

Differentially expressed genes. (A) One-sample t-test identified 4,345 transcripts with uncorrected P value <0.05. Of these had 2,834 official gene symbol annotations; 1,056 were upregulated, and 1,778 were downregulated in the 3D culturing system compared to the 2D system. In total, 102 of the upregulated genes were more than 2-fold induced, and 63 were more than 2-fold repressed using the bioreactor system. (B) A set of 481 nonhepatic genes showed expression below background in hPH and above background in UD. These genes were monitored during hepatic differentiation, and at day 7, 401 of these showed gene expression (80 were downregulated at this step), and at day 12, 257 of these showed gene expression (144 were downregulated), and at day 26 (3D), were 218 of these genes still expressed. In total, 263 (55%) of the monitored 481 nonhepatic genes were silenced during this differentiation regime. FC, fold change.
FIG. 4.

Verification of the microarray results. To verify the microarray results, a set of the most significant up- and downregulated genes (selected from Supplementary Table S1) was analyzed with real-time–polymerase chain reaction (RT-PCR) using mRNA from 4 individual experiments. The results from these analyses are in accordance with the microarray results. CREB-binding protein (CREBBP) and TATA-binding protein (TBP) were used as reference genes. The data were analyzed using one-way analysis of variance (Dunnett's multiple comparison test) and are shown as mean fold change±standard deviation (FC±SD), with *P<0.05 compared to 2D.
Similarity in gene expression between hESC derivatives and hPH
To examine the similarities of the transcriptional profiles between the hESC derivatives and hPH, the number of genes that display a high similarity across the different samples was determined (Fig. 5). We used a stringent similarity threshold of FC<1.5, and transcripts with a high variation within the biological replicates (CV>30%) were excluded from the calculation. A clear pattern of stepwise maturation was observed during the hepatic differentiation, and interestingly, the 3D differentiated hepatocytes (HEP 3D) showed the highest similarity to hPH with 17,893 transcripts that fulfilled our similarity criteria. When comparing the 2D differentiated hepatocytes (HEP 2D) with hPH, in total, 104 fewer transcripts fulfilled the similarity criteria. Expectedly, the similarity to hPH was lower in the less-mature derivatives, and in the PRO sample, 16,989 transcripts were similarly expressed as in hPH. The corresponding number of when comparing DE to hPH was 15,968 transcripts.
FIG. 5.

Similarity in gene expression between human embryonic stem cell (hESC) derivatives and hPH. To examine the similarities of the transcriptional profiles between the hESC derivatives and the hPH, the number of genes that display a high similarity across the different samples was determined. We used a stringent similarity threshold of FC<1.5, and transcripts with a high variation within the biological replicates (CV>30%) were excluded from the calculation. A clear pattern of stepwise maturation was observed during the hepatic differentiation, with the highest similarity to hPH for the 3D differentiated hepatocyte-like cells (HEP 3D), with 17,893 transcripts. When comparing the 2D differentiated hepatocyte-like cells (HEP 2D) with hPH, in total, 104 fewer transcripts fulfilled the similarity criteria. For the PRO and the DE samples, 16,989 and 15,968 transcripts, respectively, were similarly expressed compared to hPH.
GO enrichment analysis
The functional properties of the differentially expressed genes were further explored with respect to the GO annotation categories. Results from this analysis show that in the BP category, a large fraction of the enriched annotations is connected to various metabolic processes, and in the CC category, many of the annotations are associated to lipoprotein particles that are important for cholesterol transport and mainly synthesized in the liver or in the intestine. In the MF category are, for example, sterol and cholesterol transport and tetrapyrrole and heme-binding annotations over-represented (Supplementary Table S2). Similar dominance of liver-related annotations was not observed for the downregulated genes (Supplementary Table S2).
Pathways affected by 3D differentiation
Results from the global transcriptional data reveal interesting mechanistic effects on the pathway level, when differentiation was performed using the bioreactor system. Using as input, the list of 1,056 genes (Supplementary Table S1), identified by one-sample t-test as upregulated in 3D differentiation, 10 over-represented KEGG pathways, were identified (Table 1). Interestingly, these pathways are highly related to liver functions supporting the hypothesis that 3D culturing systems promotes hepatic differentiation. Moreover, in total, 19 KEGG pathways were over-represented among the 1,778 downregulated genes during 3D differentiation (Table 2). Notably, many of these downregulated pathways are associated with apoptosis and cell proliferation, which most likely is an indication that 3D differentiation promotes the maturation processes in the cells, although it cannot be excluded that it could be a result of residual, stable, nonproliferating subpopulations of cells in the reactor.
Table 1.
Over-Represented Pathways Among the Set of Genes That Were Induced in 3-Dimensional Cultures
| KEGG Id | Pathway | Count | P valuea | Genes |
|---|---|---|---|---|
| hsa04142 | Lysosome | 14 | 4.42E-03 | SGSH, TCIRG1, NAGLU, LIPA, MFSD8, HEXA, CLTC, CTSL1, GLA, CTSE, CTSD, AP4B1, CTNS, CLN5 |
| hsa00140 | Steroid hormone biosynthesis | 8 | 6.45E-03 | HSD3B2, AKR1C2, CYP3A5, CYP11A1, HSD17B1, HSD11B2, HSD17B7, CYP19A1 |
| hsa04920 | Adipocytokine-signaling pathway | 9 | 1.58E-02 | LEP, TNFRSF1A, CPT1B, G6PC, NFKBIA, JAK2, CHUK, CPT1A, ACSL5 |
| hsa04610 | Complement and coagulation cascades | 9 | 1.86E-02 | F11, F13B, C8B, C3, C6, SERPINA5, KLKB1, CPB2, PLAU |
| hsa04621 | NOD-like receptor signaling pathway | 8 | 3.06E-02 | CXCL1, HSP90AA1, CXCL2, NFKBIA, NAIP, CARD6, CHUK, CCL7 |
| hsa00591 | Linoleic acid metabolism | 5 | 4.56E-02 | CYP3A5, CYP2C19, CYP2C18, CYP2C9, PLA2G1B |
| hsa02010 | ABC transporters | 6 | 6.20E-02 | ABCG8, ABCB8, ABCG5, ABCB11, ABCC6P2, ABCD4, ABCC6 |
| hsa00980 | Metabolism of xenobiotics by cytochrome P450 | 7 | 7.16E-02 | GSTA1, AKR1C2, CYP3A5, CYP2C19, CYP2C18, CYP2C9, MGST1 |
| hsa00982 | Drug metabolism | 7 | 8.12E-02 | GSTA1, CYP3A5, CYP2C19, CYP2C18, CYP2C9, CYP2D6, MGST1 |
| hsa04060 | Cytokine–cytokine receptor interaction | 19 | 8.94E-02 | CXCL1, IL2RB, ACVRL1, CXCL2, TNFSF9, CCL7, CCNL2, LEP, TNFRSF1A, IL17A, CCL14, CCL20, INHBE, CXCR4, CLCF1, CSF2RB, IL2RG, RTEL1, IFNGR1 |
Not adjusted for multiple testing.
Table 2.
Over-Represented Pathways Among The Set of Genes That Were Repressed in 3-Dimensional Cultures
| KEGG Id | Pathway | Count | P valuea | Genes |
|---|---|---|---|---|
| hsa04120 | Ubiquitin-mediated proteolysis | 29 | 1.30E-05 | UBE2Z, UBE2G1, PML, CDC34, UBE3C, CUL3, KLHL9, UBE2D1, FBXW11, UBE2MP1, DDB1, UBE4B, UBE2J1, UBE2L6, HERC4, UBE2I, UBE2L3, UBE2Q1, CDC27, RNF7, NEDD4, PIAS3, UBA2, TRIM32, UBE2W, SMURF2, PIAS1, UBE2S, UBE2E1 |
| hsa03010 | Ribosome | 21 | 3.96E-05 | RPL15, RPL26, RPLP2, RPS27L, RPL23A, RPL39, RPS8, RPS19, RPS29, RPS16, RPL7, RPL41, RPL18A, RPL6, RPL21, RPLP0, RPL9, RPS15, RPL8, RPL5, RPS27A |
| hsa05200 | Pathways in cancer | 49 | 1.78E-04 | MITF, FGF11, FGF10, PTEN, AKT1, CCNE1, RHOA, RALA, PIK3CA, RARB, NOS2, FGF2, AKT3, PLD1, BCR, CTBP2, RALBP1, FADD, CDK6, FGF21, CDK2, CCND1, CRKL, PIAS3, PIAS1, GSTP1, BID, WNT5A, GRB2, EGLN3, PML, TFG, KIT, BCL2L1, TCF7L1, PTK2, KRAS, RAC3, LAMB1, BMP4, SMAD3, FZD5, FZD6, LAMA1, CDKN1A, HDAC2, HDAC1, WNT7A, CRK, PTENP1 |
| hsa05220 | Chronic myeloid leukemia | 17 | 5.75E-04 | CTBP2, BCR, GRB2, SMAD3, CDK6, BCL2L1, PTPN11, AKT1, CCND1, CDKN1A, CRKL, HDAC2, KRAS, HDAC1, PIK3CA, CRK, AKT3 |
| hsa04910 | Insulin-signaling pathway | 23 | 2.78E-03 | GRB2, PHKB, FLOT2, PRKCI, MKNK2, MKNK1, RPS6KB1, IRS1, PRKX, AKT1, PRKAR2B, EIF4EBP1, CRKL, KRAS, EIF4E, PYGL, PRKAR1B, GYS1, PIK3CA, PRKAA2, PTPN1, CRK, AKT3 |
| hsa04210 | Apoptosis | 17 | 3.00E-03 | BID, DFFA, FADD, BCL2L1, CAPN2, PRKX, TRADD, AKT1, PRKAR2B, TNFRSF10C, TNFSF10, TNFRSF10B, MYD88, PRKAR1B, PIK3CA, IL1A, AKT3 |
| hsa05222 | Small-cell lung cancer | 16 | 5.34E-03 | CDK6, BCL2L1, PTEN, CDK2, AKT1, CCNE1, LAMA1, PTK2, CCND1, PIAS3, PIK3CA, PIAS1, RARB, NOS2, LAMB1, PTENP1, AKT3 |
| hsa00970 | Aminoacyl-tRNA biosynthesis | 10 | 7.49E-03 | WARS, TARS, NARS, HARS2, GARS, EPRS, WARS2, CARS2, MTFMT, TARSL2 |
| hsa04144 | Endocytosis | 27 | 8.70E-03 | RAB5B, TSG101, ADRBK2, ASAP1, EEA1, KIT, AP2B1, HSPA2, RAB11A, DNAJC6, AP2M1, GIT1, PLD2, PLD1, RAB4A, RUFY1, PRKCI, LDLRAP1, NEDD4, RAB22A, SH3KBP1, RAB5A, VPS24, SMURF2, EPN2, RNF41, PIP4K2B |
| hsa05221 | Acute myeloid leukemia | 12 | 1.03E-02 | AKT1, CCND1, EIF4EBP1, KRAS, GRB2, PML, PIK3CA, RPS6KB1, PIM2, KIT, TCF7L1, AKT3 |
| hsa04115 | p53-signaling pathway | 13 | 1.33E-02 | BID, ZMAT3, CDK6, RRM2B, PTEN, CDK2, SESN3, CCNE1, EI24, CCND1, CDKN1A, TNFRSF10B, SHISA5, PTENP1 |
| hsa04012 | ErbB-signaling pathway | 15 | 1.72E-02 | GRB2, MAP2K4, RPS6KB1, AKT1, NCK2, PTK2, CDKN1A, EIF4EBP1, CRKL, KRAS, PAK2, NCK1, PIK3CA, CRK, AKT3 |
| hsa05218 | Melanoma | 13 | 1.84E-02 | MITF, FGF11, FGF10, CDK6, FGF21, PTEN, AKT1, CCND1, CDKN1A, KRAS, PIK3CA, FGF2, PTENP1, AKT3 |
| hsa05130 | Pathogenic Escherichia coli infection | 11 | 2.37E-02 | NCK2, CTTN, KRT18, ROCK1, TUBB2B, NCK1, YWHAQ, RHOA, TUBB6, ARPC5, TUBB4Q |
| hsa03018 | RNA degradation | 11 | 2.37E-02 | PATL1, PAPOLA, CNOT8, DCP2, DCP1B, DCP1A, ENO2, PAPOLG, CNOT7, CNOT6, C1D |
| hsa03022 | Basal transcription factors | 8 | 2.86E-02 | STON1-GTF2A1L, GTF2E1, TAF12, GTF2A1, TAF6, TAF7, TAF9B, TBPL1 |
| hsa04666 | Fc-gamma R-mediated phagocytosis | 15 | 3.44E-02 | PLD2, PLD1, LYN, LIMK1, ASAP1, RPS6KB1, ARPC5, AKT1, CRKL, CFL2, PIK3CA, MARCKS, CRK, AKT3, PIP4K2B |
| hsa04310 | Wnt-signaling pathway | 21 | 3.72E-02 | WNT5A, PPP2R1A, CTBP2, NKD2, ROCK1, PPP2R5B, SMAD3, CSNK2A1P, FZD5, TCF7L1, PRKX, FZD6, SENP2, CCND1, CSNK2A1, RAC3, PPP2CA, RHOA, RUVBL1, PLCB1, WNT7A, FBXW11 |
| hsa05212 | Pancreatic cancer | 12 | 4.55E-02 | AKT1, PLD1, CCND1, KRAS, RALBP1, RAC3, SMAD3, RALA, PIK3CA, CDK6, BCL2L1, AKT3 |
Not adjusted for multiple testing.
Real-time PCR analysis
To follow the differentiation process, the cell differentiation was monitored at different time points. During the first 7 days of differentiation, the expression of Nanog and octamer-binding transcription factor 4 (Oct-4) were dramatically decreased (Fig. 6A), and were further decreased until day 12. Alpha-fetoprotein (AFP) became detectable at day 12 (Fig. 6B). At the end of the experiment, at day 26 in the differentiation process, the expression of a large number of hepatic markers, enzymes, and transporters was analyzed. The expression levels are generally increasing along with the differentiation procedure. When comparing the expression levels in the 3D differentiated cells (HEP 3D) to the 2D differentiated cells (HEP 2D), CYP7A1, CYP2C9, and CYP3A4 were significantly induced (Fig. 6C).
FIG. 6.

Characterization of the differentiated cells. Gene expression of Nanog, octamer-binding transcription factor 4 (Oct4) and alpha-fetoprotein (AFP), and several liver-specific genes were analyzed by RT-PCR at different time points as UD, DE, PRO, hepatocyte-like cells differentiated in 2D (HEP 2D), and hepatocyte-like cells differentiated in 3D (HEP 3D). (A) The expression of markers for UD, Nanog and Oct4, decreased as the differentiation process progressed. The data are shown as mean±SD FC and analyzed with a one-way analysis of variance (Dunnett's multiple comparison test) compared to expression levels in UD, with *P<0.05 and ***P<0.001. (B) The mRNA expression of the hepatic progenitor marker AFP increased during the progress of differentiation. The data are shown as mean±SD FC and analyzed with a one-way analysis of variance (Dunnett's) compared to the expression levels in UD. (C) The expression levels of different liver-specific genes generally increased during the differentiation process and in several genes, significantly increased for the cells differentiated in 3D. The mRNA expression levels are shown from 3–5 independent experiments. CREBBP was used as the reference gene. The data are shown as mean±SD FC and analyzed with a one-way analysis of variance (Dunnett's multiple comparison test) compared to the expression levels in HEP 3D cells, with *P<0.05 and **P<0.01. Only the significant differences between HEP 2D and HEP 3D are shown in the figure.
Metabolic activity
The metabolic parameters of the medium circulating in the bioreactors were examined every 2–3 days during the differentiation period. Throughout the whole differentiation time in the bioreactor, the cells were metabolically active by consuming glucose and, in comparable levels, produced lactate (Fig. 7). During the differentiation from DE to PRO cells, the turnover was high; in total, 15–25 mg glucose was consumed, and comparable amounts of lactate were produced. When the cells reached the PRO stage, the levels evened out to about 10 mg glucose consumed and lactate produced and was stable throughout the rest of the differentiation process. The absolute levels of glucose and lactate were similar for DE and PRO bioreactors (Fig. 7A). When inoculated into the bioreactors, the cells showed sign of stress, primarily by LDH leakage (Fig. 7B). The stress was most likely due to the enzymatic dissociation before the inoculation. The cells rapidly adapted, and after a few days, the stress markers measured (ALAT, ASAT, and LDH) were back to low and stable levels (Fig. 7B).
FIG. 7.

Biochemical analysis of the medium circulating in the bioreactors. The total levels of glucose and lactate production/consumption (A) and the release of aspartate aminotransferase, alanine aminotransferase, and lactate dehydrogenase (B) in the bioreactors. The data are shown as mean values of 3 independent bioreactor experiments started at day 7 (DE) or day 12 (PRO) after onset of differentiation. The bars represent the mean values (n=3)±S.E.M.
When treated with a CYP cocktail, the HEP in bioreactors, inoculated with DE cells or PRO cells, both produced phenacetin O-dealkylase, bupropion hydroxylase, and 1-hydroxymidazolam metabolites, indicating CYP1A1/2-, CYP2B6-, and CYP3A4-mediated activities (data not shown). However, the metabolite levels produced were low compared to hPH, and the values differed largely between different bioreactors, probably due to a dilution effect as a result of the large medium volume in the circuit (about 7 mL). Moreover, comparison between the bioreactors is problematic, since the final number of differentiated cells in the bioreactors is unknown.
Immunoassaying of bioreactor sections
After 26 days of differentiation, the cell material together with the interwoven capillaries was removed and embedded in wax. Stained slides show that the cells successfully arranged themselves between the capillaries (capillaries visible in Fig. 8A). The HEP showed signs of hepatocyte-like functions such as A1AT (Fig. 8A) and CYP3A4 (Fig. 8C) expression. The apical efflux transporter BCRP (Fig. 8B) was also present in the bioreactor tissue.
FIG. 8.

Immunostaining of bioreactor slides. At the end of the experiment, at day 26 of differentiation, the capillaries and cell material were fixated and embedded in wax. Slides from the human liver were stained as control. Slides from the bioreactor (caps letters) and from liver tissue (lowercase letters) were stained with antibodies for α-1-antitrypsin (A and a), breast cancer resistance protein (B and b), and cytochrome P450 3A4 (C and c). Scale bar, 10 μm. Color images available online at www.liebertpub.com/scd
Discussion
hESC have many unique characteristics and hence hold great potential as a cell source in basic research, drug development, pharmacological toxicity screening, and cell-based therapies in regenerative medicine. We have developed a highly reproducible and feeder-free culture system that can be fully automated for large-scale propagation and differentiation of embryonic stem cells into HEP. In this article, we show that the functionality of our differentiated HEP is further improved by 3D culture, compared to when differentiated accordingly in the standard 2D culture.
Several studies report on hESC differentiation to functional HEP by using directed developmental signaling [6,8,9,26,27], but up to recent years, the hepatocyte-directed differentiation of hESC has mainly been done in 2D culture, and so far, no one has produced highly functional hepatocytes. Embryonic stem cells are derived from the inner mass of blastocyst-stage embryos [28,29], and when disrupted from their complex microenvironment and plated in 2D culture, the loss of structural architecture will affect the cell differentiation and maturation process [10]. The importance of a 3D organization for maintaining acquired properties of specialized cells, for example, in the liver is also well known. Recent work by Chen et al. shows that primary hepatocytes transferred to a 2D culture rapidly dedifferentiate, resulting in a population of adult liver PRO [11] with loss of most hepatic functions [12]. This emphasizes that 3D culture is important not only for hepatic hESC differentiation but also to maintain their differentiated status. During the recent years, different 3D cultures have been described for hepatic differentiation of fetal liver cells, as well as stem cells. These include stirred bioreactors [30], porous scaffolds, or extracellular matrices [31,32]. These 3D cultures, together with traditional 2D assays, are all static culture systems with a discontinuous medium change and gas exchange usually only via diffusion from the surrounding.
The 3D bioreactor technology used in this study consists of a cell compartment perfused in a decentralized way, allowing the cells to be continuously supplied with nutrients and with a sustained gas exchange (Fig. 1). The bioreactor technique described here thus offers a more controlled and dynamic culture system for the differentiation of hESC into HEP. It has successfully been used for regenerative medicine as extracorporal liver devices [14,33]. Previous work by Zeilinger et al. has proven it beneficial for culture of hPH, where when cultured in the 3D bioreactor described, the human liver cells retain more in vivo-like properties and functions compared to 2D cultures [13]. The cells also arranged themselves in tissue-like structures [14,34]. This perfused 3D system has also shown to promote spontaneous differentiation of mouse ESC [35]. It has also been used for hepatic differentiation of hESC [36]. In that study, a larger model (8-mL cell compartment) of the bioreactor was used, coated with Matrigel, and cells were cultured on feeder cells (mouse embryonic fibroblast) were used. In our study, we stepwise guide the hESC through hepatic development, via DE, foregut endoderm, and hepatic PRO to HEP, by mimicking the in vivo embryonic liver development [7]. In the developing embryo, the formation of DE takes place in a monolayer of cells [37]. We therefore initiated the differentiation to DE in 2D culture. Moreover, we compared the same batch of cells differentiated in the bioreactor to cells cultured in 2D. To evaluate how timing of inoculation into the bioreactor affected the continued differentiation, the 3D culture was initiated at 2 different stages during differentiation: either as DE cells or as PRO cells.
To reveal novel findings concerning transcriptional patterns and mechanistic pathways that may be affected by the 3D culturing system, a global gene expression analysis was performed, which uncovered highly interesting results. The hierarchical clustering of the global transcription profiles confirmed the stability and the reproducibility of the differentiation system, and as shown in Fig. 2B, replicates of the different developmental stages clustered tightly together. However, no classification between the time points of inoculation into the bioreactor was achieved (Fig. 2B), indicating that this parameter may be less important for the outcome of the 3D differentiation system used in this study. The differential gene expression analysis demonstrates interesting transcriptional differences between the 2D and 3D cultured cells (Fig. 3A, B). In total 1,056 genes were detected as significantly upregulated, and 1,778 were downregulated in the 3D culturing system compared to the 2D cultures. Although statistically significant, many of these genes showed rather small FC between the compared groups. Nevertheless, when investigating the functional properties of these differentially expressed genes, the group of upregulated genes in the 3D culturing system showed a strong over-representation of annotations involved in different metabolic processes connected to various liver functions. Among the over-represented annotations for upregulated genes were for example, glycerolipid metabolic process, regulation of lipid transport, regulation of cholesterol transport, cholesterol homeostasis, and lipid homeostasis, indicating improved hepatic function in the 3D cultures, as the liver plays a vital role in the production and clearance of a large number of lipoproteins [38]. We also performed a pathway analysis that showed significant upregulation of 10 pathways that all are associated to liver functions (Table 1). Interestingly, among the upregulated pathways are, for example, metabolism of xenobiotics by cytochrome P450, recently reviewed as the most important pathway to resemble in in-vitro technologies for drug biotransformation studies [39]. The lysosome pathway is, for example, connected to autophagy that is involved in major fields of hepatology and liver diseases [40]. Moreover, the NOD-like receptor-signaling pathway is induced in the 3D differentiation system. Both NOD1 and NOD2 mRNAs and proteins were recently shown to be highly expressed in hepatocytes in the mouse liver [41]. The ABC transporters are responsible for secretion of bile salts, and the importance of these transporters in various liver diseases is highlighted in a recent review by Nicolaou et al. [42]. Furthermore, the adipocytokine-signaling pathway has previously been studied in mice, where adiponectin was demonstrated to halt the progression of liver fibrosis [43]. Among the downregulated pathways in the 3D cultured cells compared to the 2D control cultures were, for example, pathways associated to apoptosis, cancer, and proliferation (Table 2). This result is particularly interesting, as it indicates an increased maturation of HEP differentiated in the 3D system. However, a selective downregulation of genes involved in apoptosis and proliferation as a result of residual, stable, nonproliferating subpopulations of cells in the bioreactor cannot be completely excluded, although considered highly unlikely. Interestingly, a similarity analysis demonstrated that by using the 3D differentiation regime, the fraction of transcripts with similar expression levels as in hPH, was increased compared to the 2D differentiation regime (Fig. 5).
The differentiation progress of hESC toward hepatic PRO was confirmed by RT-PCR, where the expression levels of Nanog and Oct-4, markers for UD, decreased while AFP, a marker for hepatic PRO, generally increased with time of differentiation (Fig. 6A, B). Moreover, the gene expression levels of a large number of hepatic genes, phase I and II enzymes, and transporters were gradually increased with time of differentiation (Fig. 6C). When comparing the gene expression levels in 3D differentiated cells to 2D differentiated cells, CYP7A1, CYP2C9, and CYP3A4 were expressed in significant higher levers in the 3D differentiated cells (Fig. 6C), which suggests a more mature organization of the hepatocytes in this 3D system. The immunocytochemistry data provided further evidence that the stem cells differentiated toward functional hepatocytes, showing A1AT and CYP3A4 production (Fig. 8A, C). The cells also express the BCRP transporter at similar patterns as seen in the liver slides (Fig. 8B).
Our results clearly show that the differentiation of hESC in this specific bioreactor 3D culture system generates HEP that expresses a larger number of hepatocyte-specific characters compared to conventional 2D cultures. The results presented are promising and show that a 3D culture approach appears to constitute an important step in the process of deriving functional HEP and for preserving their differentiated status. However, it is clear that additional modifications to the directed differentiation procedure of the hESC have to be made to generate fully differentiated hepatocytes. There are continuously new reports describing additional findings in developmental signaling physiology, important for hESC differentiation toward hepatic cells [44,45]. The specific 3D technique used here is in its infancy, and the bioreactor system has to be further characterized and developed. Based on studies on primary hepatocytes, we have determined that a newer type of bioreactor with a smaller cell compartment provides better culture condition for the cells. In future experiments, the timing when adding growth factors and their gradual changes during the differentiation process are also crucial factors that will be better monitored [45]. Moreover, possible binding of the added growth factors to the bioreactor and tubing will be better evaluated. We will also investigate whether coating [46] of the bioreactor can improve the differentiation process [46].
In conclusion, in this article, we show that the functionality of HEP can be improved by differentiation in a dynamic 3D perfusion system compared to differentiation in a standard 2D culture. This dynamic bioreactor technology could, when further optimized, provide a useful tool for derivation of functional HEP for use in applications such as drug discovery, toxicity testing, and clinical applications.
Supplementary Material
Acknowledgments
This study was in part supported by grants from the Swedish Research Council and from Seurat-1 EU/Colipa (SCR&Tox), and the University of Skövde, Sweden, under a grant from the Knowledge Foundation [2010/0069].
Author Disclosure Statement
Magnus Ingelman-Sundberg, Louise Sivertsson, and Jane Synnergren have no conflicts of interest related to this study. Petter Björquist and Janne Jensen are employed by Cellectis Stem Cells, Cellartis AB. This work will be reused in a thesis/dissertation from Karolinska Institutet entitled “Novel human in vitro systems for studies of drug induced hepatotoxicity” by Louise Sivertsson.
References
- 1.Lee KS. Oh SJ. Kim HM. Lee KH. Kim SK. Assessment of reactive metabolites in drug-induced liver injury. Arch Pharm Res. 2011;34:1879–1886. doi: 10.1007/s12272-011-1108-x. [DOI] [PubMed] [Google Scholar]
- 2.Daly AK. Using genome-wide association studies to identify genes important in serious adverse drug reactions. Annu Rev Pharmacol Toxicol. 2012;52:21–35. doi: 10.1146/annurev-pharmtox-010611-134743. [DOI] [PubMed] [Google Scholar]
- 3.Need AC. Motulsky AG. Goldstein DB. Priorities and standards in pharmacogenetic research. Nat Genet. 2005;37:671–681. doi: 10.1038/ng1593. [DOI] [PubMed] [Google Scholar]
- 4.Ingelman-Sundberg M. Sim SC. Gomez A. Rodriguez-Antona C. Influence of cytochrome P450 polymorphisms on drug therapies: pharmacogenetic, pharmacoepigenetic and clinical aspects. Pharmacol Ther. 2007;116:496–526. doi: 10.1016/j.pharmthera.2007.09.004. [DOI] [PubMed] [Google Scholar]
- 5.Madan A. Graham RA. Carroll KM. Mudra DR. Burton LA. Krueger LA. Downey AD. Czerwinski M. Forster J, et al. Effects of prototypical microsomal enzyme inducers on cytochrome P450 expression in cultured human hepatocytes. Drug Metab Dispos. 2003;31:421–431. doi: 10.1124/dmd.31.4.421. [DOI] [PubMed] [Google Scholar]
- 6.Touboul T. Hannan NR. Corbineau S. Martinez A. Martinet C. Branchereau S. Mainot S. Strick-Marchand H. Pedersen R, et al. Generation of functional hepatocytes from human embryonic stem cells under chemically defined conditions that recapitulate liver development. Hepatology. 2010;51:1754–1765. doi: 10.1002/hep.23506. [DOI] [PubMed] [Google Scholar]
- 7.Brolen G. Sivertsson L. Bjorquist P. Eriksson G. Ek M. Semb H. Johansson I. Andersson TB. Ingelman-Sundberg M. Heins N. Hepatocyte-like cells derived from human embryonic stem cells specifically via definitive endoderm and a progenitor stage. J Biotechnol. 2010;145:284–294. doi: 10.1016/j.jbiotec.2009.11.007. [DOI] [PubMed] [Google Scholar]
- 8.Yildirimman R. Brolen G. Vilardell M. Eriksson G. Synnergren J. Gmuender H. Kamburov A. Ingelman-Sundberg M. Castell J, et al. Human embryonic stem cell derived hepatocyte-like cells as a tool for in vitro hazard assessment of chemical carcinogenicity. Toxicol Sci. 2011;124:278–290. doi: 10.1093/toxsci/kfr225. [DOI] [PMC free article] [PubMed] [Google Scholar]
- 9.Greenhough S. Medine CN. Hay DC. Pluripotent stem cell derived hepatocyte like cells and their potential in toxicity screening. Toxicology. 2010;278:250–255. doi: 10.1016/j.tox.2010.07.012. [DOI] [PubMed] [Google Scholar]
- 10.Fuchs E. Tumbar T. Guasch G. Socializing with the neighbors: stem cells and their niche. Cell. 2004;116:769–778. doi: 10.1016/s0092-8674(04)00255-7. [DOI] [PubMed] [Google Scholar]
- 11.Chen Y. Wong PP. Sjeklocha L. Steer CJ. Sahin MB. Mature hepatocytes exhibit unexpected plasticity by direct dedifferentiation into liver progenitor cells in culture. Hepatology. 2012;55:563–574. doi: 10.1002/hep.24712. [DOI] [PMC free article] [PubMed] [Google Scholar]
- 12.Donato MT. Lahoz A. Castell JV. Gomez-Lechon MJ. Cell lines: a tool for in vitro drug metabolism studies. Curr Drug Metab. 2008;9:1–11. doi: 10.2174/138920008783331086. [DOI] [PubMed] [Google Scholar]
- 13.Zeilinger K. Schreiter T. Darnell M. Soderdahl T. Lubberstedt M. Dillner B. Knobeloch D. Nussler AK. Gerlach JC. Andersson TB. Scaling down of a clinical three-dimensional perfusion multicompartment hollow fiber liver bioreactor developed for extracorporeal liver support to an analytical scale device useful for hepatic pharmacological in vitro studies. Tissue Eng Part C-Methods. 2011;17:549–556. doi: 10.1089/ten.TEC.2010.0580. [DOI] [PubMed] [Google Scholar]
- 14.Schmelzer E. Mutig K. Schrade P. Bachmann S. Gerlach JC. Zeilinger K. Effect of human patient plasma ex vivo treatment on gene expression and progenitor cell activation of primary human liver cells in multi-compartment 3D perfusion bioreactors for extra-corporeal liver support. Biotechnol Bioeng. 2009;103:817–827. doi: 10.1002/bit.22283. [DOI] [PubMed] [Google Scholar]
- 15.Heins N. Englund MC. Sjoblom C. Dahl U. Tonning A. Bergh C. Lindahl A. Hanson C. Semb H. Derivation, characterization, and differentiation of human embryonic stem cells. Stem Cells. 2004;22:367–376. doi: 10.1634/stemcells.22-3-367. [DOI] [PubMed] [Google Scholar]
- 16.Watanabe K. Ueno M. Kamiya D. Nishiyama A. Matsumura M. Wataya T. Takahashi JB. Nishikawa S. Nishikawa S. Muguruma K. Sasai Y. A ROCK inhibitor permits survival of dissociated human embryonic stem cells. Nat Biotechnol. 2007;25:681–686. doi: 10.1038/nbt1310. [DOI] [PubMed] [Google Scholar]
- 17.Dalman MR. Deeter A. Nimishakavi G. Duan ZH. Fold change and p-value cutoffs significantly alter microarray interpretations. BMC Bioinformatics. 2012;13(Suppl 2):S11. doi: 10.1186/1471-2105-13-S2-S11. [DOI] [PMC free article] [PubMed] [Google Scholar]
- 18.McCarthy DJ. Smyth GK. Testing significance relative to a fold-change threshold is a TREAT. Bioinformatics. 2009;25:765–771. doi: 10.1093/bioinformatics/btp053. [DOI] [PMC free article] [PubMed] [Google Scholar]
- 19.Patterson TA. Lobenhofer EK. Fulmer-Smentek SB. Collins PJ. Chu TM. Bao W. Fang H. Kawasaki ES. Hager J, et al. Performance comparison of one-color and two-color platforms within the microarray quality control (MAQC) project. Nat Biotechnol. 2006;24:1140–1150. doi: 10.1038/nbt1242. [DOI] [PubMed] [Google Scholar]
- 20.Synnergren J. Ameen C. Jansson A. Sartipy P. Global transcriptional profiling reveals similarities and differences between human stem cell-derived cardiomyocyte clusters and heart tissue. Physiol Genomics. 2012;44:245–258. doi: 10.1152/physiolgenomics.00118.2011. [DOI] [PubMed] [Google Scholar]
- 21.Kanehisa M. Goto S. Hattori M. Aoki-Kinoshita KF. Itoh M. Kawashima S. Katayama T. Araki M. Hirakawa M. From genomics to chemical genomics: new developments in KEGG. Nucleic Acids Res. 2006;34:D354–D357. doi: 10.1093/nar/gkj102. [DOI] [PMC free article] [PubMed] [Google Scholar]
- 22.Ashburner M. Ball CA. Blake JA. Botstein D. Butler H. Cherry JM. Davis AP. Dolinski K. Dwight SS, et al. Gene ontology: tool for the unification of biology. The Gene Ontology Consortium. Nat Genet. 2000;25:25–29. doi: 10.1038/75556. [DOI] [PMC free article] [PubMed] [Google Scholar]
- 23.Dennis G., Jr. Sherman BT. Hosack DA. Yang J. Gao W. Lane HC. Lempicki RA. DAVID: database for annotation, visualization, and integrated discovery. Genome Biol. 2003;4:P3. [PubMed] [Google Scholar]
- 24.Synnergren J. Akesson K. Dahlenborg K. Vidarsson H. Ameen C. Steel D. Lindahl A. Olsson B. Sartipy P. Molecular signature of cardiomyocyte clusters derived from human embryonic stem cells. Stem Cells. 2008;26:1831–1840. doi: 10.1634/stemcells.2007-1033. [DOI] [PubMed] [Google Scholar]
- 25.Darnell M. Schreiter T. Zeilinger K. Urbaniak T. Soderdahl T. Rossberg I. Dillner B. Berg AL. Gerlach JC. Andersson TB. Cytochrome P450-dependent metabolism in HepaRG cells cultured in a dynamic three-dimensional bioreactor. Drug Metab Dispos. 2011;39:1131–1138. doi: 10.1124/dmd.110.037721. [DOI] [PubMed] [Google Scholar]
- 26.Hay DC. Zhao D. Ross A. Mandalam R. Lebkowski J. Cui W. Direct differentiation of human embryonic stem cells to hepatocyte-like cells exhibiting functional activities. Cloning Stem Cells. 2007;9:51–62. doi: 10.1089/clo.2006.0045. [DOI] [PubMed] [Google Scholar]
- 27.Agarwal S. Holton KL. Lanza R. Efficient differentiation of functional hepatocytes from human embryonic stem cells. Stem Cells. 2008;26:1117–1127. doi: 10.1634/stemcells.2007-1102. [DOI] [PubMed] [Google Scholar]
- 28.Thomson JA. Itskovitz-Eldor J. Shapiro SS. Waknitz MA. Swiergiel JJ. Marshall VS. Jones JM. Embryonic stem cell lines derived from human blastocysts. Science. 1998;282:1145–1147. doi: 10.1126/science.282.5391.1145. [DOI] [PubMed] [Google Scholar]
- 29.Reubinoff BE. Pera MF. Fong CY. Trounson A. Bongso A. Embryonic stem cell lines from human blastocysts: somatic differentiation in vitro. Nat Biotechnol. 2000;18:399–404. doi: 10.1038/74447. [DOI] [PubMed] [Google Scholar]
- 30.Ishikawa M. Sekine K. Okamura A. Zheng YW. Ueno Y. Koike N. Tanaka J. Taniguchi H. Reconstitution of hepatic tissue architectures from fetal liver cells obtained from a three-dimensional culture with a rotating wall vessel bioreactor. J Biosci Bioeng. 2011;111:711–718. doi: 10.1016/j.jbiosc.2011.01.019. [DOI] [PubMed] [Google Scholar]
- 31.Liu T. Zhang S. Chen X. Li G. Wang Y. Hepatic differentiation of mouse embryonic stem cells in three-dimensional polymer scaffolds. Tissue Eng Part A. 2010;16:1115–1122. doi: 10.1089/ten.TEA.2009.0391. [DOI] [PubMed] [Google Scholar]
- 32.Matsumoto K. Mizumoto H. Nakazawa K. Ijima H. Funatsu K. Kajiwara T. Hepatic differentiation of mouse embryonic stem cells in a three-dimensional culture system using polyurethane foam. J Biosci Bioeng. 2008;105:350–354. doi: 10.1263/jbb.105.350. [DOI] [PubMed] [Google Scholar]
- 33.Gerlach JC. Encke J. Hole O. Muller C. Ryan CJ. Neuhaus P. Bioreactor for a larger scale hepatocyte in vitro perfusion. Transplantation. 1994;58:984–988. doi: 10.1097/00007890-199411150-00002. [DOI] [PubMed] [Google Scholar]
- 34.Zeilinger K. Holland G. Sauer IM. Efimova E. Kardassis D. Obermayer N. Liu M. Neuhaus P. Gerlach JC. Time course of primary liver cell reorganization in three-dimensional high-density bioreactors for extracorporeal liver support: an immunohistochemical and ultrastructural study. Tissue Eng. 2004;10:1113–1124. doi: 10.1089/ten.2004.10.1113. [DOI] [PubMed] [Google Scholar]
- 35.Gerlach JC. Hout M. Edsbagge J. Bjorquist P. Lubberstedt M. Miki T. Stachelscheid H. Schmelzer E. Schatten G. Zeilinger K. Dynamic 3D culture promotes spontaneous embryonic stem cell differentiation in vitro. Tissue Eng Part C Methods. 2010;16:115–121. doi: 10.1089/ten.tec.2008.0654. [DOI] [PMC free article] [PubMed] [Google Scholar]
- 36.Miki T. Ring A. Gerlach J. Hepatic differentiation of human embryonic stem cells is promoted by three-dimensional dynamic perfusion culture conditions. Tissue Eng Part C Methods. 2011;17:557–568. doi: 10.1089/ten.TEC.2010.0437. [DOI] [PubMed] [Google Scholar]
- 37.Wells JM. Melton DA. Vertebrate endoderm development. Annu Rev Cell Dev Biol. 1999;15:393–410. doi: 10.1146/annurev.cellbio.15.1.393. [DOI] [PubMed] [Google Scholar]
- 38.Cooper ME. Akdeniz A. Hardy KJ. Effects of liver transplantation and resection on lipid parameters: a longitudinal study. Aust N Z J Surg. 1996;66:743–746. doi: 10.1111/j.1445-2197.1996.tb00734.x. [DOI] [PubMed] [Google Scholar]
- 39.Fasinu P. Bouic PJ. Rosenkranz B. Liver-based in vitro technologies for drug biotransformation studies—a review. Curr Drug Metab. 2012;13:215–224. doi: 10.2174/138920012798918426. [DOI] [PubMed] [Google Scholar]
- 40.Rautou PE. Mansouri A. Lebrec D. Durand F. Valla D. Moreau R. Autophagy in liver diseases. J Hepatol. 2010;53:1123–1134. doi: 10.1016/j.jhep.2010.07.006. [DOI] [PubMed] [Google Scholar]
- 41.Scott MJ. Chen C. Sun Q. Billiar TR. Hepatocytes express functional NOD1 and NOD2 receptors: a role for NOD1 in hepatocyte CC and CXC chemokine production. J Hepatol. 2010;53:693–701. doi: 10.1016/j.jhep.2010.04.026. [DOI] [PMC free article] [PubMed] [Google Scholar]
- 42.Nicolaou M. Andress EJ. Zolnerciks JK. Dixon PH. Williamson C. Linton KJ. Canalicular ABC transporters and liver disease. J Pathol. 2012;226:300–315. doi: 10.1002/path.3019. [DOI] [PubMed] [Google Scholar]
- 43.Chuang JH. Wang PW. Tai MH. An adipocentric view of liver fibrosis and cirrhosis. Chang Gung Med J. 2004;27:855–868. [PubMed] [Google Scholar]
- 44.Hay DC. Fletcher J. Payne C. Terrace JD. Gallagher RCJ. Snoeys J. Black JR. Wojtacha D. Samuel K, et al. Highly efficient differentiation of hESCs to functional hepatic endoderm requires ActivinA and Wnt3a signaling. Proc Natl Acad Sci U S A. 2008;105:12301–12306. doi: 10.1073/pnas.0806522105. [DOI] [PMC free article] [PubMed] [Google Scholar]
- 45.Takayama K. Inamura M. Kawabata K. Katayama K. Higuchi M. Tashiro K. Nonaka A. Sakurai F. Hayakawa T. Furue MK. Mizuguchi H. Efficient generation of functional hepatocytes from human embryonic stem cells and induced pluripotent stem cells by HNF4 alpha transduction. Mol Ther. 2012;20:127–137. doi: 10.1038/mt.2011.234. [DOI] [PMC free article] [PubMed] [Google Scholar]
- 46.Engler AJ. Sen S. Sweeney HL. Discher DE. Matrix elasticity directs stem cell lineage specification. Cell. 2006;126:677–689. doi: 10.1016/j.cell.2006.06.044. [DOI] [PubMed] [Google Scholar]
Associated Data
This section collects any data citations, data availability statements, or supplementary materials included in this article.