

Abstract
Tonic receptors convey stimulus duration and intensity and are implicated in homeostatic control. However, how tonic homeostatic signals are generated, and how they reconfigure neural circuits and modify animal behavior is poorly understood. Here we show that C. elegans O2-sensing neurons are tonic receptors that continuously signal ambient [O2] to set the animal’s behavioral state. Sustained signalling relies on a Ca2+ relay involving L-type voltage-gated Ca2+ channels, the ryanodine and the IP3 receptors. Tonic activity evokes continuous neuropeptide release, which helps elicit the enduring behavioral state associated with high [O2]. Sustained O2 receptor signalling is propagated to downstream neural circuits, including the hub interneuron RMG. O2 receptors evoke similar locomotory states at particular [O2], regardless of previous d[O2]/dt. However, a phasic component of the URX receptors’ response to high d[O2]/dt, as well as tonic-to-phasic transformations in downstream interneurons, enable transient reorientation movements shaped by d[O2]/dt. Our results highlight how tonic homeostatic signals can generate both transient and enduring behavioral change.
Keywords: O2 sensing, tonic signaling, neural circuits, homeostasis, IP3 receptor, ryanodine receptor, channelrhodopsin, halorhodopsin, cameleon, guanylate cyclase, Caenorhabditis elegans
INTRODUCTION
Sensory neurons can exhibit phasic, tonic, or phasic-tonic signalling. Phasic receptors adapt rapidly, signal changes in stimulus intensity, and typically function over broad dynamic ranges. They allow animals to monitor changing environmental features. Most sensory receptors that have been genetically dissected are phasic1,2,3. In contrast, tonic receptors adapt slowly, and communicate stimulus duration and intensity. Phasic-tonic receptors combine phasic and tonic properties (e.g.4). For many sensory modalities, including vision, sound, and smell, nervous systems convey both dynamic and static information5,6. For example retinal photoreceptors and cochlear hair cells transmit a range of stimulus intensities for long periods by changing the tonic rate of transmitter release at ribbon synapses7. Tonic receptors are functionally diverse8, and include proprioceptors9, nociceptors10, chemoreceptors11,6 and mechanoreceptors5. Typically, these receptor neurons have been characterized electrophysiologically, but the molecular mechanisms underlying their sustained signalling are unclear. Also poorly understood is how their tonic output influences neural circuit properties and behavior.
Many mammalian homeostatic responses involve tonically signalling circuits. These include circuits controlling body temperature12, arterial pressure13, and CO2 and O2 levels14. Although these circuits are not well understood, in both vertebrates and invertebrates homeostatic imbalance often alters behavior. In C. elegans, homeostatic responses allow animals to escape high (21%) and low (< 5%) ambient [O2]15. Avoidance of high [O2] involves the AQR, PQR and URX neurons15,16,17,18,19, neurons first characterized because they promote C. elegans aggregation20,21. Rising [O2] is thought to stimulate their activity by activating atypical soluble guanylate cyclases15,21, thereby opening cGMP-gated cation channels. Avoidance of low [O2] is less well understood but involves the ciliated head neuron BAG19.
Here we show that AQR, PQR and URX are tonic receptors that cause long-lasting changes in neural circuit activity and persistently set C. elegans behavior according to [O2]. We identify a Ca2+ relay that sustains this tonic signalling. By combining different stimulus dynamics, halorhodopsin and channelrhodopsin activation, and Ca2+ imaging, we elucidate how these neurons can evoke transient and enduring behavioral change.
RESULTS
Tonic O2 sensors couple behavioral state to O2 levels
To ask if C. elegans behavioral state is persistently reset by [O2], we recorded animals in different O2 environments (Supplementary Fig. 1). We focussed on mutants defective in the npr-1 neuropeptide receptor, since the reference C. elegans strain, N2 (Bristol), has acquired a gain-of-function mutation in this receptor during laboratory cultivation that inhibits some O2-evoked responses22,23. For comparison, we studied the Hawaiian wild isolate CB4856, which retains the natural npr-1 allele22,23. Altering [O2] evoked persistent behavioral change in npr-1 and CB4856 animals. At 21% O2 these animals moved rapidly on food, even after 2 hours (Fig. 1a,b). By contrast in 7% O2 the animals moved slowly and dwelt locally, even after 2 hours (Fig. 1c). These enduring behavioral states remained sensitive to [O2]: changing [O2] switched behavior in seconds (Fig. 1a–c). Thus, C. elegans persistently alters behavior according to [O2].
Figure 1.
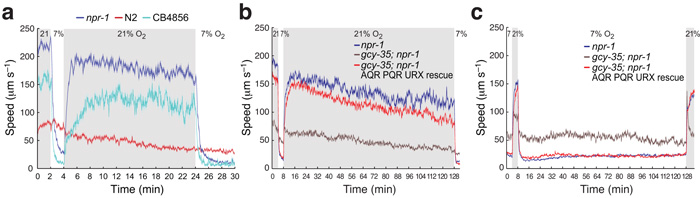
High and low ambient O2 evoke different enduring behavioral states. (a–c) The Hawaiian wild strain CB4856 and npr-1(ad609) animals, but not N2 animals, maintain high locomotory activity on food as long as ambient O2 is 21% (a, b), and low locomotory activity as long as O2 is 7% (c). npr-1 animals lacking the O2-binding soluble guanylate cyclase GCY-35 maintain intermediate locomotory activity at both high and low O2 tensions (b, c), although they show a brief small increase in speed when O2 rises to 21% after being held at 7% O2. Each line in this (and subsequent) figures represents the mean response of all animals of one genotype. Error bars (lighter shading) in all figures depict standard error of the mean. Blue areas indicate periods of 21% O2. For each genotype n>80 animals.
Two mechanisms could explain the impact of [O2] on behavior. First, O2 receptors could be tonically activated, continuously signalling [O2] to downstream circuits. Second, O2 sensors could respond transiently to changes in [O2] but persistently alter downstream circuits. C. elegans O2 sensors include the head neurons BAG, URX, and AQR, and the tail neuron PQR15,18,19,. AQR, PQR and URX neurons are activated by rising [O2]18,19, and regulate turning behavior and locomotory activity in response to transient changes in [O2] 16,17. To examine if these neurons tonically signalled [O2] we visualised their responses to long-lasting stimuli in immobilized animals, using the calcium sensor cameleon YC3.6024. In parallel we monitored behavioral responses to the same stimulus (Fig. 2a,c,e,g). URX, AQR and PQR neurons displayed biphasic responses to a 7% to 21% O2 shift (Fig. 2c,e,g; Supplementary Fig. 2a–c). As [O2] rose, [Ca2+] rose, peaked and then declined to a plateau significantly higher than baseline [Ca2+] at 7% O2. The Ca2+ plateau persisted while [O2] was 21%, in our longest experiment 20 minutes (Fig. 2c,e,g; Supplementary Fig. 2a–c). Upon return to 7% O2, [Ca2+] rapidly fell to levels observed previously at this [O2]. To extend our analysis we imaged O2-evoked Ca2+ responses of URX and PQR neurons in npr-1 animals freely moving on E. coli food. The responses obtained resembled those of immobilized animals, although they were noisier (Fig. 2i, j), reflecting the difficulty of imaging neural responses in fast-moving animals. Together, our data suggest that AQR, PQR and URX neurons signal tonically in high [O2].
Figure 2.

The AQR, PQR and URX O2 sensors are tonic receptors.
(a) Locomotory activity of npr-1(ad609) animals experiencing the same O2 stimulus profile as in the imaging experiments below (c,e,g).
(c,e,g) O2–evoked Ca2+ responses in the URX, AQR and PQR neurons in immobilized npr-1 animals visualized using cameleon YC3.60. The O2 upstep elicits an initial Ca2+ peak (indicated by a high YFP/CFP ratio) followed by a sustained plateau of elevated Ca2+ that remains significantly higher than the ratio at 7% O2 as long as [O2] is 21%. *** P < 0.001 (two-tailed t-test on YFP/CFP ratios during a 30s period before the downstep compared with 30s afterwards).
(b,d,f,h) O2-evoked Ca2+ responses in URX (b,f) and PQR (d,h) are disrupted by mutations in the itr-1 IP3 receptor (b,d) or the unc-68 ryanodine receptor (f,h). The itr-1(sa73) allele is a hypomorph; unc-68(e540) is a splice acceptor mutation and probable null. Cell-specific RNAi of itr-1, using pgcy-32::itr-1 sense and antisense constructs, also strongly attenuates sustained O2-evoked responses in URX (b).
(i,j) O2-evoked Ca2+ responses in the URX (i) and PQR (j) neurons in freely moving npr-1 lite-1 animals visualized using cameleon YC3.60. * P < 0.05 (two-tailed t-test for the three minute periods before and after the O2 downstep).
The O2 responses of AQR, PQR and URX require the GCY-35 and GCY-36 atypical soluble guanylate cyclases18,19. To link tonic signalling by these neurons with the behavioral states observed at high and low [O2], we recorded the behavior of gcy-35 mutants at different [O2] over 2 hours. gcy-35; npr-1 mutants failed to switch behavior, moving at about 50 μm/s in both 7% and 21% O2 (Fig. 1b,c). This phenotype was rescued by expressing gcy-35 cDNA specifically in AQR, PQR and URX (Fig. 1b,c), or in URX only (Supplementary Fig. 3a,b). Our data suggest that sustained high and low signalling by AQR, PQR and URX underpin the persistent behavioral states observed in high and low [O2].
We also investigated the role of the BAG O2-sensors in persistent O2 responses. Ablating BAG or disrupting its O2 response by deleting the gcy-33 soluble guanylate cyclase19, did not abolish the persistent behavioral differences we observed in npr-1 animals at 21% and 7% O2, although gcy-33; npr-1 mutants exhibited increased locomotory activity at low O2 (Supplementary Fig. 3c–h). Thus, under our experimental conditions BAG neurons play a minor role in responses to high and low O2.
The ryanodine and IP3 receptors sustain tonic signalling
O2-evoked changes in [cGMP] in AQR, PQR and URX are thought to control cGMP-gated ion channels that include TAX-2 and TAX-4 subunits15,18-21. Disrupting these channels abolishes O2-evoked Ca2+ responses in these neurons18,19. Disrupting EGL-19, the sole C. elegans L-type voltage-gated Ca2+ channel (VGCC) α1 subunit, had similar phenotypes (Supplementary Fig. 4 and25), suggesting that L-VGCC amplify the sensory potential, as reported in other C. elegans neurons26,27. We hypothesized that sustained O2-evoked Ca2+ signalling might involve Ca2+ release from the endoplasmic reticulum. To test this, we imaged mutants defective in the IP3 receptor, encoded in C. elegans by the itr-1 gene, and in the ryanodine receptor, encoded by unc-68. In animals bearing a reduction-of-function mutation of the IP3 receptor, itr-1(sa73), URX and PQR often did not respond to a rise in [O2], although in some animals the neurons responded normally (Fig. 2b,d, Supplementary Fig. 5f). Cell-specific knockdown of itr-1 in AQR, PQR and URX by RNAi gave a stronger phenotype: a switch from 7% to 21% O2 evoked an initial Ca2+ peak but the sustained Ca2+ plateau at 21% O2 was strongly reduced (Fig. 2b and Supplementary Fig. 5e). Mutations in the ryanodine receptor also strongly reduced the sustained Ca2+ responses evoked in URX and in PQR by high [O2] (Fig. 2f,h and Supplementary Fig. 5b,c). These data suggest that activation of L-VGCC by the sensory potential is potentiated by Ca2+ release through the ryanodine and IP3 receptors during sustained signalling.
Halorhodopsin and channelrhodopsin control of O2 sensors
To investigate if tonic signalling from O2-sensing neurons was required for continuous fast movement at 21% O2 we acutely inhibited these neurons using halorhodopsin28. Upon exposure to green light, npr-1 lite-1 animals grown on retinal and expressing NpHR-mCherry in AQR, PQR and URX sharply reduced their movement on food. Control animals grown without retinal showed no behavioral change (Fig. 3a,b and Supplementary Film 1). These data suggest tonic signalling from AQR, PQR and URX sustains rapid movement in high O2.
Figure 3.

Light control of O2 receptor activity using Halorhodopsin and Channelrhodopsin.
(a) Inhibiting AQR, PQR, URX activity using Halorhodopsin reduces the locomotory activity of feeding animals kept at 21% O2, but does not alter the speed of animals at 7% O2. The shaded area indicates illumination with green light. Control animals were grown without the cofactor all-trans retinal (ATR). n>90 animals.
(b) Mean speed of animals in (a) in the 3 min before, during and after light stimulation. *** P < 0.001 (1-way ANOVA).
(c) Activating the AQR, PQR and URX neurons, or only URX, using Channelrhodopsin-mCitrine induces high locomotory activity in animals kept at 11% O2. Control animals expressed the channel but were grown without all-trans retinal. Gray indicates activation by blue light. n>40 animals.
(d) Mean speed of animals from (c) in the 3 min before, during and after light stimulation. *** P < 0.001 (1-way ANOVA).
(e,f) Light-induced stimulation of locomotory activity in animals expressing ChR2-mCitrine in AQR, PQR and URX persists while blue light is on. Animals were sequentially exposed to 15 s and 15 min of blue light, indicated by gray areas. Results in (f) quantify speeds for periods indicated by black bars in (e). n>60 animals.
(g,h) Light activation of animals in which ChR2-mCitrine is visible only in AQR+PQR, AQR, or PQR, compared to control animals. n>40 animals. (h) shows quantitation of data in (g) for the 3 min before, during and after light stimulation. *** P < 0.001 (1-way ANOVA).
To test this, we asked if tonically activating AQR, PQR or URX, using Channelrhodopsin-2 (ChR2), could induce npr-1 animals kept at 11% O2 to move rapidly. We monitored ChR2 expression by tagging it with mCitrine. To disrupt lite-1-dependent avoidance of blue light we used an npr-1 lite-1 mutant background. Upon exposure to blue light, animals expressing functional ChR2 in AQR, PQR and URX substantially increased movement (Fig. 3c,d and Supplementary Film 2). When light was switched off, animals resumed slow movement. Control animals grown without retinal showed no response. Fast movement was indistinguishable from that of the same animals kept at 21% O2 without light activation. To extend our analysis, we gave npr-1 lite-1 animals expressing pgcy-32::ChR2-mCitrine light stimuli of different length. We first illuminated animals kept at 11% O2 for 15s with blue light, then, after an interval, exposed them to blue light for 15 minutes (Fig. 3e,f). When blue light came on briefly animals only transiently sped up; by contrast, sustained blue light elicited sustained fast movement. In both cases, when light was switched off, animals returned to the slow movement typical of npr-1 animals in 11% O2. These results suggest that tonic activation of AQR, PQR or URX can induce sustained fast movement in npr-1 animals kept at low O2.
To ask if each of the O2-sensing neurons could activate locomotion, we exploited the variable expression of transgene arrays, and selected animals in which ChR2-mCitrine was visible in a subset of the neurons. In animals with ChR2-mCitrine visible only in URX, blue light stimulated movement, but to a lesser extent than in animals expressing ChR2 in AQR, PQR and URX (Fig. 3c,d). Animals expressing ChR2 in AQR or PQR alone also increased locomotory activity in blue light compared to control animals, but expression in both neurons gave stronger responses (Fig. 3g,h). In all cases increased speed persisted in blue light and returned to pre-stimulation levels when light was switched off. Our results suggest that tonic activation of any one of AQR, PQR and URX can stimulate sustained fast movement .
Neuroexocytosis from O2 sensors promotes rapid movement
To examine if release of synaptic vesicles or dense core vesicles from O2 sensors helped sustain rapid movement in 21% O2, we created transgenic animals expressing a pgcy-32::tetanus toxin::gfp polycistronic contruct. By cleaving synaptobrevin tetanus toxin disrupts neuroexocytosis29. We then monitored the behavior of animals expressing GFP, and therefore tetanus toxin, in AQR, PQR and URX, or only in URX (Fig. 4a). Animals with transgene expression visible only in URX showed a weak reduction in locomotory activity in 21% O2. By contrast, animals expressing the transgene in all three neurons moved much more slowly than non-transgenic controls at 21% O2, but retained the ability to slow down appropriately in 7% O2. These data suggest that neuroexocytosis from one or more O2-sensor sustains rapid movement in high [O2].
Figure 4.

Neuropeptide release from O2-sensors promotes the O2-evoked switch in behavioral state.
(a) Expressing tetanus toxin (Tetx) in AQR, PQR and URX neurons strongly reduces the locomotory activity evoked by 21% O2. By contrast, animals with Tetx expression in URX alone exhibit only a weak reduction in activity. The timeline of the O2 stimulus is plotted in gray. Horizontal bars indicate statistical comparison of the genotype of the same color with npr-1 during the given period. *** P < 0.001 (1-way ANOVA). n>70 animals.
(b) INS-1-RFP fluorescence colocalizes with the dense core vesicle marker IDA-1-GFP in PQR ventral process.
(c) High [O2] induces tonic release of INS-1::EYFP from O2-sensing neurons. Shown is EYFP fluorescence in the posterior coelomocyte, which gives an indirect measure of the INS-1::EYFP released. Animals defective in unc-64 syntaxin show little EYFP fluorescence in coelomocytes but increased fluorescence in the PQR cell body consistent with decreased release of INS-1::EYFP.
(d) Knocking down the carboxypeptidase E egl-21 by cell-specific RNAi in AQR, PQR and URX neurons strongly reduces the ability of npr-1 animals to move rapidly in 21% O2, but not to move slowly in 7% O2. Control animals were from the same strain but do not express RNAi transgenes. An RNAi-resistant version of egl-21 cDNA expressed in AQR,PQR and URX substantially rescued O2 responses to the knock-down animals. The timeline of the O2 stimulus is plotted in gray. *** P < 0.001 (1-way ANOVA). n>80 animals.
Previous work reported slightly different results, finding only a small effect of a pgcy-32::tetx transgene on locomotory activity30. This discrepancy may reflect variable expression of toxin from extrachromosomal arrays.
O2 sensors tonically release neuropeptides in high O2
As AQR, PQR and URX are peptidergic neurons31, we examined if they differentially release neuropeptides at high and low [O2]. In C. elegans, secreted GFP-tagged proteins are removed from body fluid by coelomocytes, which consequently become fluorescent32,33. This allows release of fluorescently-tagged neuropeptides to be followed by monitoring coelomocyte fluorescence34. To exploit this, we expressed RFP-tagged insulin-like peptide-1 (INS-1) specifically in AQR, PQR and URX, using the gcy-32 promoter. We confirmed that INS-1-RFP was correctly targeted by co-localizing it with the dense core vesicle marker IDA-1-GFP (Fig. 4b). We then tracked coelomocyte fluorescence intensity when animals were exposed to 7%, 21% or 25% O2 for different lengths of time. During 4 hours of exposure to 7% O2 we observed no change in coelomocyte fluorescence (Fig. 4c). In contrast after a switch to 21% O2 coelomocyte fluorescence increased for 1 hour and then plateaued. Animals switched to 25% O2 showed larger increases in coelomcyte fluorescence that continued to rise throughout the 4-hour exposure to this [O2].
To confirm that accumulation of tagged INS-1 in coelomocytes reflected evoked release, we repeated the experiment in unc-64 syntaxin mutants, which have defects in dense core vesicle release. unc-64 mutants showed increased fluorescence from in the cell body of PQR but very little fluorescence in coelomocytes that was unaltered by O2 experience (Fig. 4c). These results suggest that high [O2] evokes tonic release of neuropeptides from one or more O2-sensor.
EGL-21 Carboxypeptidase E is required in O2 sensors for rapid movement
To investigate if neuropeptide release from O2 sensory neurons modified behaviour, we first asked if disrupting egl-21, the worm ortholog of carboxypeptidase E (CPE), altered O2 responses. EGL-21 removes basic C-terminal amino acids: without it most prepropeptides cannot be processed into functional neuropeptides35,36. Disrupting egl-21 switched the sign of the O2 response: egl-21; npr-1 animals sped up when [O2] fell, and slowed down when [O2] rose (Supplementary Fig. 6). Thus, peptide signalling is required for wild-type responses to changes in [O2].
egl-21 is expressed widely in the nervous system35. To examine if it is required in O2-sensors for appropriate O2 responses we downregulated it specifically in these neurons, using targeted RNAi. npr-1 animals expressing egl-21 sense and antisense RNA in AQR, PQR and URX moved appropriately slowly in 7% O2, but sped up much less than non-transgenic siblings when switched to 21% O2 (Fig. 4d). This phenotype could be rescued by expressing an RNAi-insensitive egl-21 transgene in AQR, PQR and URX, confirming the effect was specific (Fig. 4d). These data suggest that neuropeptide release from one or more O2 sensors when [O2] is high promotes rapid C. elegans movement.
O2 sensors tonically control downstream neural circuits
We next examined how the activity of O2 sensors modulated downstream circuits in npr-1 animals, using YC3.60 as a Ca2+ reporter. URX has gap junctions and makes synapses with RMG and AUA interneurons37. A switch from 7 to 21% O2 elicited increased [Ca2+] in the RMG and AUA cell bodies that persisted while [O2] was 21% (Fig. 5a,b). Upon returning animals to 7% O2, [Ca2+] quickly returned to levels previously observed at this [O2]. The O2-evoked Ca2+ responses in RMG were abolished in gcy-35; npr-1 mutants, suggesting they reflected input from URX and/or AQR and PQR (Fig. 5c). The O2-evoked Ca2+ responses in AUA interneurons were attenuated but not abolished in gcy-35; npr-1 mutants (Fig. 5d). The residual O2 sensitivity could reflect the activity of other atypical soluble guanylate cyclases expressed in AQR, PQR and URX, namely GCY-32, GCY-34 and GCY-37; these have previously been shown to modify behavioral responses to O216. Thus, AUA and RMG interneurons, like the O2 sensors themselves, are tonically regulated by [O2].
Figure 5.

Tonic activation of O2 sensors is propagated to downstream interneurons, which are required for persistent behavioral change.
(a) A 7 to 21% O2 switch elicits a Ca2+ spike in RMG interneurons, followed by a Ca2+ plateau that persists while O2 levels are high. The plot shows relative ratio change (ΔR/R) compared to the baseline (mean ratio during 1 min in the first period at 7% O2, immediately before the shift to 21% O2).
(b) A 7 to 21% O2 switch elicits a rise in Ca2+ in AUA interneurons that persists while O2 levels are high.
(c) O2-evoked responses in RMG are disrupted in gcy-35 mutants.
(d) O2-evoked responses in AUA are strongly attenuated in gcy-35 mutants.
(e) Mutations in gcy-35, but not egl-21, disrupt O2-evoked Ca2+ responses in URX neurons. Loss of unc-13 transiently enhances O2-evoked URX Ca2+ responses.
(f,g) An unc-13 mutation enhances O2-evoked Ca2+ responses in AUA transiently (f), whereas a mutation in egl-21 strongly attenuates them (g).
(h,i) Ablating RMG abolishes O2-evoked changes in the locomotory activity of npr-1 animals. RMG(–) npr-1 animals move at speeds intermediate to those displayed by mock-ablated animals at 7% and 21% O2. The timeline of the O2 stimulus is plotted in gray in (i,j). Horizontal red bars indicate statistical comparison of the ablated animals with the mock controls during the given period. n>40 animals.
(j) Ablating AUA neurons only has a small effect on control of locomotory activity by [O2]. n>40 animals.
Ablating RMG and AUA interneurons alters O2 responses
To investigate how O2 sensors modulate AUA, we imaged its O2-evoked Ca2+ responses in mutants defective in synaptic transmission or neuropeptide synthesis. To control for the possibility that altered AUA activity reflected defects in the O2 sensors, we also imaged URX responses in the mutants. Loss of unc-13, which disrupts synaptic vesicle release but not dense core vesicle communication, did not reduce O2-evoked Ca2+ responses in AUA or URX but potentiated the initial responses of both neurons (Fig. 5e,f). By contrast, loss of egl-21 substantially reduced O2-evoked responses in AUA without altering URX responses (Fig. 5e,g). These data suggest that O2-evoked Ca2+ responses in AUA partly reflect tonic peptidergic input.
To examine the roles of RMG and AUA in O2-evoked behavioral responses we ablated them using a laser microbeam. Removing RMG abolished [O2]-dependent changes in speed: ablated animals moved at speeds intermediate to those of npr-1 animals kept at 21% and 7% O2 (Fig. 5h,i). Ablating AUA had modest affects: naïve AUA(–) animals were only slightly slower than mock-ablated controls at 21% O2, and slowed down strongly when [O2] fell to 7% (Fig. 5j). These data suggest sustained O2-evoked changes in [Ca2+] in RMG contribute to the high and low locomotory states of C. elegans at high and low [O2].
Head and tail O2 sensors promote opposite escape responses
Besides evoking persistent changes in speed according to [O2], O2 sensors elicit transient re-orientation movements in response to changing O2 concentration, d[O2]/dt. A 7% to 21% rise in [O2] induces a bout of reversals and turns lasting 1–2 minutes that usually leads to a change in direction of travel. These transient responses are disrupted in gcy-35; npr-1 mutants, but can be restored by transgenic expression of gcy-35 in AQR, PQR and URX, or URX alone (17; Fig. 7c–f and Supplementary Fig. 7f–i).
Figure 7.

Behavioral and neuronal responses to different d[O2 ]/dt.
(a) Ca2+ imaging of URX neurons in immobilized worms exposed to slow (0.2% s−1) and fast (2% s−1) switches between 7% and 21% O2. Measured [O2] timeline is plotted in gray. *** P < 0.001 (during 20s periods, two-tailed t-test).
(b–l) Behavioral responses of animals on food to the stimulus regime shown in (b). Horizontal bars indicate comparison of the genotype of the same color with npr-1 (c,d,g–j) or gcy-35;npr-1 (e,f) or mock ablated (k,l) animals during the given period.
(b) Locomotory speed follows [O2] regardless of d[O2]/dt in npr-1 animals. Control gcy-35;npr-1 animals show little O2 response.
(c,d) Proportion of npr-1 and gcy-35;npr-1 animals reversing (c) or turning (d) during slow and rapid rises in [O2]. (e,f) Expressing gcy-35::gfp in AQR, PQR, URX neurons or in URX alone in gcy-35;npr-1 mutants restores reversal (e) and turning (f) responses to both slow and fast O2 changes. *** P < 0.001 (two-tailed chi-square test). n>80 animals for each genotype.
(g,h) O2-evoked reversal (g) and turning (h) behaviors of animals expressing tetanus toxin in AQR, PQR and URX or only in URX. Data from same movies as in Fig. 4a. n>70 animals.
(i,j) RNAi knockdown of egl-21 carboxypeptidase E in AQR, PQR and URX reduces O2-evoked reversals and turning. Data from same movies as in Fig. 4d. n>80 animals.
(k,l) The RMG interneuron contributes to O2-evoked reversal and turning. Data from same movies as in Fig. 5i. n>40 animals.
To show explicitly that activating URX head neurons evokes reversal we selectively activated them using ChR2-EYFP. To keep O2 sensor activity low when blue light was absent, we maintained animals at 7% O2 using our microfluidic arena. We then shone a circle of blue light that illuminated only the head of npr-1 animals expressing ChR2 in URX and PQR for 1.5–2 sec. To restrict blue light to a small area we used a prototype programmable array microscope (PAM), a fluorescence microscope in which a spatial light modulator is placed in the primary image plane (Fig. 6a). Simultaneously, we observed behavioral changes using trans-illumination with yellow light. As predicted, activating URX elicited reversal behavior (Fig. 6d,e and Supplementary Film 3), in animals grown with the ChR2 cofactor retinal.
Figure 6.

Anterior O2 sensors direct reversals whereas posterior sensors direct forward movement.
(a) Simplified working principle of the programmable array microscope. A Liquid Crystal on Silicon (LCoS) chip acts as a spatial light modulator, where every pixel functions as an aperture that can be ‘opened’ or ‘closed’ independently. ChR2-EYFP was excited with blue light from a Nd:YAG laser.
(b) Device for targeting a puff of O2 to different body regions. The O2 mixture is pumped out of the narrow glass capillary (see g,h).
(c) Animals expressing Channelrhodopsin-EYFP in the URX and PQR neurons were selectively illuminated with a circle of blue light in the head or tail region only (see d–f).
(d) Responses of npr-1 lite-1 animals expressing ChR2-EYFP in URX and PQR neurons when blue light is restricted to head (top) or tail (bottom) regions. The illuminated region is indicated by a circle. Stimulation of the head induces a reversal; stimulation of the tail induces forward movement.
(e,f) Quantification of behavioral responses of npr-1 pgcy-32::ChR2-EYFP and npr-1;lite-1 pgcy-32::ChR2-EYFP animals elicited by light-activation of URX neurons (e), or PQR tail neurons (f). ATR, all-trans retinal. *** P < 0.001 (two-tailed Fisher’s exact test).
(g,h) Behavioral responses of npr-1 animals kept at 7% O2 to a puff of 21% or 7% O2. g indicates responses to a head-directed puff; h indicates responses to a tail-directed puff. The responses evoked by 21% O2 are abolished in gcy-35;npr-1 mutants. *** P < 0.001 (two-tailed Fisher’s exact test).
We next examined how selectively activating PQR altered C. elegans’ movement. Since O2 diffuses slowly in water, sharp gradients can be generated even across the 1 mm separating the sensory endings of URX in the head and PQR in the tail of adults (Fig. 6c)17. We speculated that unlike for URX, activating PQR neurons would promote acceleration without prior re-orientation, allowing animals to escape efficiently if the tail but not the head detects high [O2]. To test this, we used the PAM to selectively illuminate the tail of animals expressing pgcy-32::ChR2-EYFP while keeping them at 7% O2. As predicted, activating PQR elicited acceleration without reversal (Fig. 6d,f and Supplementary Film 4). For both URX and PQR light activation experiments we rarely observed light-evoked behavioral responses in animals grown without retinal, and we obtained similar results in npr-1 lite-1 mutants, confirming that responses do not reflect innate light-avoidance.
To test directly if elevated [O2] at the head and tail elicited different behavioral responses, we directed a 2 s puff of 21% O2 at either end of npr-1 and gcy-35; npr-1 animals kept at 7% O2 (Fig. 6b,c). To control for behaviors elicited by mechanical stimulation we also puffed 7% O2. Puffing 21% O2 at the head of npr-1 animals robustly evoked reversal (Fig. 6g and Supplementary Film 5), whereas directing 21% O2 at the tail elicited acceleration (Fig. 6h and Supplementary Film 6). Puffing 7% O2 at the head or the tail of npr-1 animals kept at 7% O2 had minimal affects on behavior (Fig. 6g,h). Both head and tail responses to 21% O2 were reduced to control (7% O2) levels in gcy-35; npr-1 mutants. These data indicate that C. elegans head and tail O2 sensors can elicit escape from high O2 in opposite directions.
Neural coding of behavioral responses coupled to d[O2]/dt
We explored how O2 receptors encode both persistent changes in speed, and transient re-orientation responses. Two models, not exclusive, could explain short-lived responses. First, a phasic component of the O2-evoked Ca2+ responses in these neurons could drive the re-orientations. Second, tonic output from the sensors could be transformed into phasic responses in downstream interneurons.
To investigate these models we varied d[O2]/dt 60-fold by switching animals between 7% and 21% O2 at different rates, and analyzed Ca2+ traces and behavioral responses. The d[O2]/dt stimuli we used were 2% s−1, 0.2% s−1, and 0.03% s−1 (we used the latter only for behavioral studies); each was experimentally validated (Supplementary Fig. 1a,b). For d[O2]/dt = 0.2% s−1, [Ca2+] in URX rose gradually as [O2] increased from 7% to 21%, and then plateaued (Fig. 7a). By contrast, at d[O2]/dt = 2% s−1 URX generated an overshoot - a transient Ca2+ peak that decayed to the plateau level observed for the slower d[O2]/dt stimulus (Fig. 7a). Thus, URX displays both phasic and tonic signalling properties, but the phasic Ca2+ responses are evident only at high d[O2]/dt under our imaging conditions. AQR and PQR showed small Ca2+ peaks at both fast and slow d[O2]/dt (Supplementary Fig. 7a,b).
We next measured the behavioral responses of animals exposed to the d[O2]/dt used in our imaging experiments. The final speed of animals after [O2] had stabilized was similar, regardless of d[O2]/dt, as expected if speed were coupled to the [Ca2+] plateau in the O2 sensors (Fig. 7b and Supplementary Fig. 7c). By contrast, and as expected for a phasic response, varying d[O2]/dt altered the pattern of reversals and omega turns (where animals turn deeply and touch their own tail). Animals reversed and turned as long as [O2] changed, even when d[O2]/dt was very small (Fig. 7c,d; Supplementary Fig. 7d,e). Altering d[O2]/dt also altered the probability of reversals and turns. Transgenic rescue of gcy-35 mutants confirmed that URX could account for most of these responses (Fig. 7c–f and Supplementary Fig. 8b,c), although this does not exclude redundant roles for other neurons. Together, our data suggest URX encodes reversals and turns in two ways. The phasic component of its Ca2+ response at high d[O2]/dt correlates with high probability of a reversal immediately after a fast O2 switch. Conversely, the absence of a phasic Ca2+ response in URX at low d[O2]/dt suggests a tonic-to-phasic transformation of input from O2 sensors in downstream circuits, enabling reversals and turns to cease when dO2/dt and d[Ca2+]/dt = 0 even if [Ca2+] in URX remains persistently elevated.
Neural circuits mediating transient responses to O2
We next examined how manipulations that disrupted tonic control of speed modified phasic re-orientation responses. Expressing tetanus toxin in AQR, PQR and URX attenuated both reversal and turning when [O2] rose (Fig. 7g,h and Supplementary Fig. 8d,e), implicating neuroexocytosis in these responses. Toxin expression in URX alone reduced turning but not reversals (Fig. 7g,h). RNAi knockdown of egl-21 in AQR, PQR and URX attenuated reversals and turns evoked by a 7% to 21% O2 switch both at high and low dO2/dt (Fig. 7i,j and Supplementary Fig. 8f,g). These phenotypes were partly rescued by an RNAi resistant transgene, suggesting that neuropeptide release from O2 sensors contributes to these phasic responses. Ablating RMG interneurons, which abolished modulation of movement by [O2], also reduced the reversals and turns elicited when [O2] rose (Fig. 7k,l and Supplementary Fig. 8h,i). Thus, similar outputs from O2 sensors shape transient and persistent behavioral responses to O2 change.
AVA interneurons respond phasically to changes in O2
C. elegans reversal behavior is controlled by a set of interconnected pre-motor interneurons called AVA, AVD and AVE37,38. Ca2+ imaging of freely moving animals suggests reversals occur whenever AVA [Ca2+] rises39. AQR, PQR, URX, RMG, and AUA each synapse onto one or more of AVA, AVD and AVE. We therefore examined whether tonic activation of AQR/PQR/URX/RMG/AUA following a rise in [O2] elicited persistent or transient changes in AVA [Ca2+].
We first imaged O2-evoked Ca2+ responses in AVA in npr-1 animals tethered by glue with food present (Fig. 8a). In these animals, AVA [Ca2+] decreased when [O2] dropped from 21% to 7% (Fig. 8a). Returning [O2] to 21% led to a rapid rise in AVA Ca2+, consistent with the increased reversal rates we observed in behavioral assays. High [Ca2+] in AVA was not, however, tonically maintained at 21% O2, but fluctuated between high and low levels as expected if animals were sporadically attempting to reverse. Thus, AVA neurons respond to the ‘onset’ and ‘offset’ of an O2 stimulus but do not display sustained changes in [Ca2+], suggesting a tonic-to-phasic transformation between O2 sensors and AVA interneurons.
Figure 8.

The AVA interneurons display phasic responses to changes in O2.
(a) AVA neural activity visualized in individual immobilized npr-1(ad609) animals expressing pnmr-1::YCD3 cameleon. E. coli food was spread around the head of the animals glued onto the agarose pad. Traces show inhibition of AVA activity in response to a drop in [O2], and activation of AVA when [O2] rises. Animals kept in 21% O2 show prolonged bouts of high AVA activity, alternating with periods of low activity, that are not observed in freely moving animals (b, below). Gray areas indicate 21% O2.
(b) AVA neural activity visualized in individual freely moving npr-1(ad609) animals expressing pnmr-1::YCD3 cameleon. AVA activity and reversals increase when [O2] rises from 7 to 21%. Blue, red and green sections of the traces indicate periods of forward movement, reversals, or no movement respectively. Missing sections of individual traces are due to animals moving out of the field of view. In both (a) and (b) AVA does not display tonic (sustained) activation, but phasic responses (peaks and troughs).
In the imaging experiments above using tethered npr-1 animals, AVA was active more than half the time when animals were at 21% O2. However in our behavioral experiments, much fewer than 50% of npr-1 animals reversed at any one time in 21% O2 (Fig. 7c; Supplementary Fig. 8d,f,h). Moreover reversals were much briefer than the bouts of high AVA activity we imaged in immobilized animals (Fig. 8a; Supplementary Fig. 9a,b). We speculated this discrepancy reflected either attempts by immobilized animals to escape by long reversals or a need for feedback from locomotor activity to terminate AVA responses. To investigate this, we imaged AVA responses to O2 stimuli in freely moving animals while simultaneously monitoring locomotion (Fig. 8b). Under these conditions AVA exhibited much shorter bouts of high [Ca2+] for a much smaller proportion of the time (compare Figs. 8a and b). As in immobilized animals, a rise in [O2] elicited a rise in AVA [Ca2+] and this coincided with reversal behavior. The short periods when [Ca2+] was rising correlated with reversals, whereas long periods when [Ca2+] was falling or low correlated with forward locomotion or rest. Unlike in immobilized animals, we did not observe sharp drops in AVA [Ca2+] when we switched freely moving animals from 21% to 7% O2, probably because AVA [Ca2+] at the end of the 3 minute 21% O2 period was already close to baseline. Our data suggest that tonic signalling from O2 sensors evoke phasic responses in AVA neurons, which correlate with reversals.
DISCUSSION
Tonically signalling neurons and neural circuits are widespread but poorly understood. Here we show that the C. elegans O2-sensing neurons AQR, PQR and URX are tonic receptors whose sustained signalling sets the behavioral state according to ambient [O2]. High [O2] evokes tonic high [Ca2+] in these neurons, leading to tonic peptide release, long-lasting changes in downstream neural circuit activity, and sustained rapid movement in feeding animals (Supplementary Fig. 10a,b). Low [O2] results in persistently low [Ca2+], and sustained slow movement.
To maintain elevated [Ca2+] for minutes and hours the O2 sensors use a relay of cGMP-gated ion channels, L-type voltage-gated Ca2+ channels, and IP3 and ryanodine receptor Ca2+ channels (Supplementary Fig. 10a). IP3 receptors are generally thought to require inositol trisphosphate (IP3) for activation, suggesting O2-sensing neurons have an unknown source of this molecule40. In other systems ryanodine receptors are activated via either physical interaction with L-VGCC, as in skeletal muscle, or by Ca2+-induced Ca2+ release (CICR), as in cardiac muscle41. Varying d[O2]/dt affects neither the persistent Ca2+ plateau nor the consequences for locomotory activity once [O2] has stabilized, suggesting the signaling system sets up and maintains a steady state of elevated Ca2+ according to [O2]. CICR might be expected to operate in ‘all-or-none’ fashion, but is often finely tuned to the magnitude and duration of the trigger, typically Ca2+ entry via L-VGCC, suggesting unknown counteracting control mechanisms42. Both behavior and steady state [Ca2+] can change in seconds when [O2] varies, indicating that the activity of IP3 and ryanodine receptors remains coupled to the signal transduction mechanism measuring [O2]. A simple model is that different [O2] elicit different persistent levels of cGMP, leading to graded changes in sensory potential by activating cGMP-gated channels. The membrane potential change is amplified by L-VGCC. The cGMP channels, or a proportion of L-VGCC that inactivate very slowly but whose activity remains linked to [cGMP], could provide the Ca2+ influx to sustain ryanodine and IP3 receptor signaling. Such a tonically acting mechanism requires a balanced return of Ca2+ to the ER, to enable continued signaling for many minutes and probably hours at high [O2].
Part of the sustained response to changes in [O2] is mediated by neuropeptides. Targeted RNAi knockdown of neuropeptide biogenesis in AQR, PQR and URX neurons strongly attenuates their ability to promote rapid movement in 21% O2, without interfering with the ability to inhibit movement at 7% O2. The downstream targets are unknown, but neuropeptide signaling by volume transmission can allow communication with cells not in direct synaptic communication43. It will be interesting to examine whether sustained neuropeptide release is a leitmotiv of tonically signalling neurons.
The two post-synaptic targets of URX we imaged, AUA and RMG, both exhibit persistent changes in [Ca2+] following changes in [O2] (Supplementary Fig. 10b). In the case of AUA, this partly depends on peptidergic signalling. In the case of RMG, based on the anatomy, communication is likely via gap junctions. The weak behavioral effect of tetanus toxin expression in URX alone would be consistent with this scenario. We have not explored the ion channels that allow persistent elevated Ca2+ in either AUA or RMG. However RMG is functionally required for the O2-evoked persistent changes in locomotory activity. It will be interesting to examine how far tonic signalling from O2 sensors propagates through the C. elegans nervous system.
Besides persistently coupling rate of movement to [O2], URX can transiently elicit reversals and turns when [O2] rises16. At least two features enable tonically signalling URX sensors to elicit reversals with appropriate timing across a 60-fold range of d[O2]/dt. First, rapid but not slow rises in [O2] elicit a Ca2+ spike that correlates with a high probability of reversal. Second, Ca2+ imaging suggests the AVA interneurons, which elicit reversals, respond phasically to tonic input from O2 sensors. This enables a slow rise in [O2] to elicit a sequence of reversals, and ensures that reversals and turns are suppressed when [O2] stabilizes, despite continued signalling from the sensors.
The location of URX in the head, and PQR in the tail, together with the circuitry properties associated with these neurons, allow C. elegans to avoid high O2 in two ways: by reversing, turning and accelerating away when the head (and URX) encounters high [O2]; and by accelerating away without changing direction of travel when the tail (and PQR) but not the head encounters high [O2]. The opposite signs of these behavioral responses would facilitate migration down spatial O2 gradients away from high [O2]. This arrangement is reminiscent of gentle touch avoidance in C. elegans, where anterior and posterior touch sensors evoke opposite escape responses38. A potential difference is that O2 sensors could allow head-to-tail comparisons if PQR tonically sustains forward movement in high [O2] unless over-ruled by increased phasic URX/AQR – AVA activity. We have not explored this here. Sustained activation of locomotion provides a potent way to escape aversive environments, particularly when directional avoidance cues are absent, whereas sustained inhibition of movement facilitates accumulation in favourable ones.
In summary, our data demonstrate a causal link between tonically signalling sensory neurons and persistent behavioral states. Tonically signalling neural circuits have been described in many mammalian brain areas, for example midbrain dopaminergic neurons, but the way these relate to behavioral state is poorly understood. The tonic signalling system we have studied serves a homeostatic role in O2 sensing. Tonic receptors are apt as controllers of an animal’s internal milieu. In primates, many interoceptive homeostatic systems feed into the insula where they have been proposed to communicate a sense of the animal’s wellbeing and to contribute to mood and behavioral state44. It will be interesting to examine if tonic signalling by O2 sensors play a similar role, modulating the strength of a range of C. elegans sensory responses according to ambient O2 levels.
METHODS
Molecular cloning and worm maintenance followed standard protocols. Gases were supplied by BOC and humidified before use.
Microfluidics
Soft lithography was used to create microfluidic devices45. Devices were designed in AutoCAD (Autodesk) and printed on a photomask at 128000 dpi. To make master moulds a silicon wafer was spin coated with a 200 μm layer of SU-8 2150 photoresist (MicroChem) at 2000 rpm for 30 s and patterned by photolithography. To create devices 3 mm of polydimethylsiloxane (PDMS) prepolymer mixture (Sylgard 184, Dow Corning) was poured over the mould and cured for >1 d at room temperature (Supplementary Fig. 1a). In- and outlets were connected to gas supplies with PE50 polyethylene tubing (Intramedic).
Behavioral assays
Temporal gradient assays
21-25 adult C. elegans were picked and allowed to settle for 1 hour on 5 cm NGM plates seeded 1 day earlier with 40 μl of E. coli OP50. The microfluidic behavioural arena (Supplemental Fig. 1a) was then lowered over the worms. After 1 min a syringe pump (PHD 2000, Harvard Apparatus) started pumping gas at a flow rate of 3 ml/min. Videorecording using a Grasshopper 20S4M-C CCD camera (Point Grey Research) began after a further minute. Teflon valves (AutoMate Scientific) allowed rapid switching between two gas mixtures delivered from the same pump, by shunting flow either to the chamber or to an air exhaust. Valves were controlled by TTL pulses from the camera, using a custom-built frame counter that enabled switching at precise timepoints.
In the gcy-35 rescue experiments, transgenic animals were pre-selected by picking worms expressing GCY-35::GFP.
Spatial assays
Experiments were performed in a hypoxia chamber at 7% O2, to maintain low activity in the O2–sensing neurons. A drawn-out microcapillary was connected to 21% (test) or 7% (control) O2 pumped at 800 μl min−1. The tip of the microcapillary was brought close to the nose or tail of individual animals and their behavioral response scored visually. Responses were categorised as 1. reversal, 2. no change of behaviour, 3. acceleration (from resting or backward movement), or 4. stalling, (slowing after prior forward or backward movement). Responses were only counted if they occurred within 2 sec of stimulation. Significance was assessed using Fisher’s exact test for each response category.
Assays with slow temporal gradients of [O2]
Two syringe pumps were programmed to deliver a constant gas flow into the microfluidic arena, but with varying contribution from each pump (Supplementary Fig. 1b). For a two minute shift from 21% to 7% O2, pump A (supplying 21% O2) changed its speed from 2 ml/min to 0 ml/min over 2 min, while pump B (supplying 7% O2) was ramped up from 0 to 2 ml/min at the same time. Pump speeds were adjusted every 0.5 sec. To obtain smooth piston movement we used glass syringes (Summit). [O2] in behavioral or imaging microfluidic chambers was measured using a spot optode (PreSens).
Behavioural analysis
Speed, reversals and omega turns were quantified as described previously48. We excluded objects representing anything other than single animals from analysis by monitoring the size of tracked objects and sudden increases in their perimeter (indicating two worms touching).
Reversals and Omega turns were identified from changes in the path direction of each tracked object’s centroid, with characteristic shape properties used to distinguish the two. Parameters for reversal detection were a minimum turn angle of 150° and a minimum reversal distance of 0.3 mm. For the analysis, data from multiple replicates of each assay were pooled. Statistics are based on the total number of valid observations in all video frames in the corresponding time period. Proportions are an instantaneous measure of a behavioural state in the population. Behavioural results are shown in 8 s bins for speed or 10 s bins for reversal and omega turns.
Optogenetic control of neural activity
ChR-246, codon-optimised for C. elegans and C-terminally tagged with mCitrine, or Halorhodopsin28 tagged with mCherry, were expressed from the gcy-32 promoter. Worms were grown on plates supplemented with 30 μl of 5 mM all-trans retinal (Sigma), dissolved in ethanol. Control animals were grown on plates supplemented with 30 μl of ethanol. Animals were pre-selected for fluorescence in one or more of the AQR, PQR, URX neurons. For each assay, 10-13 adult hermaphrodites were transferred to low peptone NGM plates seeded 2 days prior with 30 μl of E. coli OP50, and left for 1 h. 10 min before the recording, the plate was transferred to a Perspex chamber and kept at 7, 11 or 21% O2. Films were recorded on a Leica M165FC dissecting microscope with a Grasshopper camera at 2 frames s−1. Animals were exposed to 18 mW/cm2 green light (Halorhodopsin) or 13 mW/cm2 blue light (Channelrhodopsin) for 3 min. Animals were also observed 3 min before and after stimulation using dim white light. Speed was determined as described above and statistically significant differences in mean speeds assessed (excluding the first 10 s after stimulus change) using 1-way ANOVA with Bonferroni’s Multiple Comparison Test.
In the mosaic experiments, we excluded worms with detectable fluorescence in non-selected neurons visible under a dissecting microscope. To test whether ChR2 expression below this detection limit could affect behaviour, we stimulated worms from a line expressing ChR2 in AQR, PQR and URX stably but so weakly that it was visible under a compound microscope with a 40x objective, but not under the dissecting microscope. Blue light illumination did not significantly increase speed of these worms (data not shown).
Spatially selective light activation of ChR2 in O2-sensing neurons with a programmable array microscope
A detailed description of the programmable array microscope (PAM) prototype used for selective illumination of head or tail regions can be found in50. The PAM is an epifluorescence microscope that includes in the primary image plane an array of small liquid crystal apertures that can be independently activated at high speed. This array serves as the spatial light modulator (SLM) and consists of a 1280×1024 pixel Liquid Crystal on Silicon (LCoS) chip. By dynamically changing the pattern of apertures on the SLM any illumination scheme can be implemented. Both excitation and emission light paths pass through the SLM. Blue excitation light (473 nm) was generated with a Nd:YAG laser (intensity was ~ 0.5 mW/cm2 at the specimen plane). The transmission image was not synchronized with and unaltered by the state of the LCoS, which has a much higher refresh rate than the frame rate of the CCD camera used for acquiring images (1.44 kHz vs. 30 fps). Therefore, worm behaviour could be observed using trans-illumination while using the PAM’s selective illumination capabilities. Pixels at the border between ‘on’ and ‘off’ regions on the SLM have slightly different intensity. By adjusting illumination intensity to emphasize these border regions it was possible to accurately locate the excitation spot in the final camera images.
Transgenic animals expressing ChR2-EYFP in URX and/or PQR neurons were picked onto seeded NGM plates >30 min before the experiment. The animals were placed under a custom-built microfluidic arena connected to a syringe pump delivering 7% O2 at 1.6 ml min−1 starting 3 min before light stimulation. The stimulation could only be performed with still animals. Animals exhibiting frequent spontaneous reversals or moving at high speed were excluded. Individual animals were stimulated up to 10x with a 1 min delay in between; responses generally did not decrease across repetitions. Responses were classified and statistically assessed in the same way as for the spatial stimulation with O2 puffs.
Calcium imaging
Ca2+ imaging of immobilised animals was done as described previously18. Recordings were carried out at 2 frames s−1 on an inverted compound microscope (Axiovert, Zeiss), using a 40x C-Apochromat lens, a Cascade II 512 EMCCD camera and Metamorph software (Molecular Devices). Worms were glued to agarose pads (2% in M9 buffer) using Nexaband S/C or Dermabond tissue adhesive (Closure Medical). Glued worms were placed under the microfluidic device and remained alive in the chamber for >30 min. Photobleaching was limited using a 2.0 neutral density filter. Exposure time was 100 ms except for AVA (250 ms). The ratio of the background-subtracted fluorescence in the CFP and YFP channels was calculated with Jmalyze49. Mean fluorescence ratio (YFP/CFP) plots and heatmaps of individual responses were made in Matlab (MathWorks). For statistical comparisons, all data points from individual traces during selected periods of the recording were collated. Statistical tests were made with Prism (GraphPad). Generally, worms that showed no responses to O2 stimuli were excluded from the mean ratio traces, except where the proportion of responding animals in the compared genotypes differed: then, all traces were included in the calculation. Transgenes used for imaging include: pgcy-32::YC3.60 (AQR, PQR, URX); pflp-8::YC3.60 (URX, AUA); pnmr-1::YCD (AVA); pnpr-1::YC3.60 (RMG).
Calcium imaging in freely moving animals
Worms were imaged on 5 cm plates filled with low-peptone NGM. To reduce surface inhomogeneities, plates were incubated at 60°C for 1 h 16–20 h before imaging, dried at room temperature for another hour, then seeded with 5 μl of E. coli OP50. Imaging was performed using a Zeiss Axio Observer D1 inverted epifluorescence microscope with a ProScan II motorized stage system (Prior). A diffuser in the aperture stop helped homogenize and reduce the intensity of the excitation light, which was then filtered for CFP excitation and reflected by a dichroic mirror onto the worms. Light was collected through the same 10x 0.3NA Zeiss achromat objective used to deliver excitation light. Emitted light was passed through an Optosplit II beam splitter (Cairn Research) to selectively collect YFP and CFP emission wavelengths. The two channels were recorded side-by-side on a Cascade II 1024 EMCCD camera (Photometrics). Worms were kept in the field of view by moving the stage manually using a joystick, with the acceleration rate set to its lowest value to disturb the animal as little as possible. To reconstruct the speed and trajectory of the worm, stage position was continuously queried and logged using a Prior Terminal macro.
To deliver gas stimuli, we placed a 500 μm deep rectangular PDMS chamber over the worm, with inlets connected to a PHD 2000 syringe pump (Harvard Apparatus) at a flow rate of 120 μl s−1. Valves placed between the syringes and the PDMS chamber allowed rapid switching between different gas mixtures at pre-specified frames of the recording. We analysed the resulting movies using a custom-written Matlab program. By selecting worms where the neuron of interest strongly expressed the fluorescent sensor, we could track the centroid of the neuron using an algorithm identifying the brightest pixel in both YFP and CFP channels independently. We then calculated the mean of the 20 brightest pixels within a 7–pixel radius of the centroid for both channels independently, and subtracted from this the median pixel intensity of the respective channel as the background. We obtained the YFP/CFP ratio from these intensity values and subtracted a crosstalk correction value of 0.6.
Cell-specific RNA interference
Nucleotides 565-1302 of egl-21 cDNA and its reverse sequence were separately cloned into pExpression vectors downstream of the gcy-32 promoter (0.6kb). unc-119 worms were co-injected with an unc-119 rescue construct and either ccGFP (egl-21 sense) or ccRFP (egl-21 antisense) co-injection marker. Lines established from these injections were crossed with npr-1(ad609) worms and then each other to create npr-1(ad609) ccGFP ccRFP gcy-32::egl-21(sense) gcy-32::egl-21(antisense) strains. Several such lines obtained from different injection events showed a reduction in aggregation. To rescue the egl-21 knockdown, an RNAi-resistant and codon-optimised47 egl-21 cDNA construct under control of the gcy-32 promoter was co-injected with elt-2::GFP into the knockdown strain. RNAi of itr-1 employed the same procedure; the pgcy-32::itr-1 sense and antisense transgenes spanned IV:7689422 – 7690120 of the itr-1 sequence.
Coelomocyte assay
For coelomocyte imaging, we grew an integrated pgcy-32::ins-1::EYFP transgenic line on food at 21% O2 until adulthood. Worms were separated and incubated for different lengths of time at 7%, 21% and 25% O2. The posterior coelomocyte was imaged in young adults oriented laterally. Coelomocyte average fluorescence was determined using Metamorph software. For co–localisation studies the maximum intensity fluorescence along the PQR ventral neurite was evaluated using the linescan function.
Cell ablations
Laser ablations were conducted following standard procedure51. RMG/AUA were identified by GFP fluorescence and ablated in L1 or L2 stage. Loss of the ablated cells was confirmed by observing loss of fluorescence in the adult.
Supplementary Material
ACKNOWLEDGEMENTS
We thank the Caenorhabditis Genetics Centre and the C. elegans Knockout Consortia for strains, members of the Schafer and de Bono Labs for comments and insights in the course of this work and Paul Dear for assistance with microfabrication. K. E. B. acknowledges support by EU Marie Curie Actions, EMBO, the Swiss National Science Foundation and DAAD. Supported by Advanced ERC grant 269058-ACMO.
Footnotes
Supplementary Data Supplementary data includes a comprehensive strain list, 10 Supplementary Figures and 6 Supplementary Movies.
AUTHOR CONTRIBUTIONS K.E.B. and P.L. did Ca2+ imaging, behavioural assays, laser ablation, peptide assay and optogenetic experiments; H.L.S. helped with behavioural assays; P.L. and Z.S. developed the setup for Ca2+ imaging in freely moving animals; O.F., M.T and B.H. designed and built the programmable array microscope; O.F., P.L. and K.E.B. conducted PAM experiments; R.J.M. and Z.S. wrote software; K.E.B., P.L. and M.d.B. designed experiments, interpreted results and wrote the paper.
REFERENCES
- 1.Suzuki H, et al. Functional asymmetry in Caenorhabditis elegans taste neurons and its computational role in chemotaxis. Nature. 2008;454:114–117. doi: 10.1038/nature06927. [DOI] [PMC free article] [PubMed] [Google Scholar]
- 2.Kimura KD, Miyawaki A, Matsumoto K, Mori I. The C. elegans thermosensory neuron AFD responds to warming. Curr Biol. 2004;14:1291–1295. doi: 10.1016/j.cub.2004.06.060. [DOI] [PubMed] [Google Scholar]
- 3.Zufall F, Leinders-Zufall T. The cellular and molecular basis of odor adaptation. Chem Senses. 2000;25:473–481. doi: 10.1093/chemse/25.4.473. [DOI] [PubMed] [Google Scholar]
- 4.Barth FG. A phasic-tonic proprioceptor in the telson of the crayfish Procambarus clarki (Girard) Journal of Comparative Physiology A. 1964;48:181–189. [Google Scholar]
- 5.McGlone F, Reilly D. The cutaneous sensory system. Neurosci Biobehav Rev. 2010;34:148–159. doi: 10.1016/j.neubiorev.2009.08.004. [DOI] [PubMed] [Google Scholar]
- 6.Madrid R, Sanhueza M, Alvarez O, Bacigalupo J. Tonic and phasic receptor neurons in the vertebrate olfactory epithelium. Biophys J. 2003;84:4167–4181. doi: 10.1016/S0006-3495(03)75141-8. [DOI] [PMC free article] [PubMed] [Google Scholar]
- 7.Matthews G, Fuchs P. The diverse roles of ribbon synapses in sensory neurotransmission. Nat Rev Neurosci. 2010;11:812–822. doi: 10.1038/nrn2924. [DOI] [PMC free article] [PubMed] [Google Scholar]
- 8.Pearson KG, Rowell CH. Functions of tonic sensory input in insects. Ann N Y Acad Sci. 1977;290:114–123. doi: 10.1111/j.1749-6632.1977.tb39721.x. [DOI] [PubMed] [Google Scholar]
- 9.Proske U, Gandevia SC. The kinaesthetic senses. J Physiol. 2009;587:4139–4146. doi: 10.1113/jphysiol.2009.175372. [DOI] [PMC free article] [PubMed] [Google Scholar]
- 10.Gold MS, Gebhart GF. Nociceptor sensitization in pain pathogenesis. Nat Med. 2010;16:1248–1257. doi: 10.1038/nm.2235. [DOI] [PMC free article] [PubMed] [Google Scholar]
- 11.Kleineidam C, Romani R, Tautz J, Isidoro N. Ultrastructure and physiology of the CO2 sensitive sensillum ampullaceum in the leaf-cutting ant Atta sexdens. Arthropod Struct Dev. 2000;29:43–55. doi: 10.1016/s1467-8039(00)00012-8. [DOI] [PubMed] [Google Scholar]
- 12.Morrison SF, Nakamura K, Madden CJ. Central control of thermogenesis in mammals. Exp Physiol. 2008;93:773–797. doi: 10.1113/expphysiol.2007.041848. [DOI] [PMC free article] [PubMed] [Google Scholar]
- 13.Dampney RA, et al. Long-term regulation of arterial blood pressure by hypothalamic nuclei: some critical questions. Clin Exp Pharmacol Physiol. 2005;32:419–425. doi: 10.1111/j.1440-1681.2005.04205.x. [DOI] [PubMed] [Google Scholar]
- 14.Feldman JL, Mitchell GS, Nattie EE. Breathing: rhythmicity, plasticity, chemosensitivity. Annu Rev Neurosci. 2003;26:239–266. doi: 10.1146/annurev.neuro.26.041002.131103. [DOI] [PMC free article] [PubMed] [Google Scholar]
- 15.Gray JM, et al. Oxygen sensation and social feeding mediated by a C. elegans guanylate cyclase homologue. Nature. 2004;430:317–322. doi: 10.1038/nature02714. [DOI] [PubMed] [Google Scholar]
- 16.Cheung BH, Cohen M, Rogers C, Albayram O, de Bono M. Experience-dependent modulation of C. elegans behavior by ambient oxygen. Curr Biol. 2005;15:905–917. doi: 10.1016/j.cub.2005.04.017. [DOI] [PubMed] [Google Scholar]
- 17.Rogers C, Persson A, Cheung B, de Bono M. Behavioral motifs and neural pathways coordinating O2 responses and aggregation in C. elegans. Curr Biol. 2006;16:649–659. doi: 10.1016/j.cub.2006.03.023. [DOI] [PubMed] [Google Scholar]
- 18.Persson A, et al. Natural variation in a neural globin tunes oxygen sensing in wild Caenorhabditis elegans. Nature. 2009;458:1030–1033. doi: 10.1038/nature07820. [DOI] [PubMed] [Google Scholar]
- 19.Zimmer M, et al. Neurons detect increases and decreases in oxygen levels using distinct guanylate cyclases. Neuron. 2009;61:865–879. doi: 10.1016/j.neuron.2009.02.013. [DOI] [PMC free article] [PubMed] [Google Scholar]
- 20.Coates JC, de Bono M. Antagonistic pathways in neurons exposed to body fluid regulate social feeding in Caenorhabditis elegans. Nature. 2002;419:925–929. doi: 10.1038/nature01170. [DOI] [PubMed] [Google Scholar]
- 21.Cheung BH, Arellano-Carbajal F, Rybicki I, De Bono M. Soluble Guanylate Cyclases Act in Neurons Exposed to the Body Fluid to Promote C. elegans Aggregation Behavior. Curr. Biol. 2004;14:1105–1111. doi: 10.1016/j.cub.2004.06.027. [DOI] [PubMed] [Google Scholar]
- 22.Weber KP, et al. Whole genome sequencing highlights genetic changes associated with laboratory domestication of C. elegans. PLoS One. 2010;5:e13922. doi: 10.1371/journal.pone.0013922. [DOI] [PMC free article] [PubMed] [Google Scholar]
- 23.Rockman MV, Kruglyak L. Recombinational landscape and population genomics of Caenorhabditis elegans. PLoS Genet. 2009;5:e1000419. doi: 10.1371/journal.pgen.1000419. [DOI] [PMC free article] [PubMed] [Google Scholar]
- 24.Nagai T, Yamada S, Tominaga T, Ichikawa M, Miyawaki A. Expanded dynamic range of fluorescent indicators for Ca(2+) by circularly permuted yellow fluorescent proteins. Proc Natl Acad Sci U S A. 2004;101:10554–10559. doi: 10.1073/pnas.0400417101. [DOI] [PMC free article] [PubMed] [Google Scholar]
- 25.Arellano-Carbajal F, et al. Macoilin, a conserved nervous system-specific ER membrane protein that regulates neuronal excitability. PLoS Genet. 2011;7:e1001341. doi: 10.1371/journal.pgen.1001341. [DOI] [PMC free article] [PubMed] [Google Scholar]
- 26.Hilliard MA, et al. In vivo imaging of C. elegans ASH neurons: cellular response and adaptation to chemical repellents. Embo J. 2004 doi: 10.1038/sj.emboj.7600493. [DOI] [PMC free article] [PubMed] [Google Scholar]
- 27.Suzuki H, et al. In vivo imaging of C. elegans mechanosensory neurons demonstrates a specific role for the MEC-4 channel in the process of gentle touch sensation. Neuron. 2003;39:1005–1017. doi: 10.1016/j.neuron.2003.08.015. [DOI] [PubMed] [Google Scholar]
- 28.Zhang F, et al. Multimodal fast optical interrogation of neural circuitry. Nature. 2007;446:633–639. doi: 10.1038/nature05744. [DOI] [PubMed] [Google Scholar]
- 29.Schiavo G, Matteoli M, Montecucco C. Neurotoxins affecting neuroexocytosis. Physiol Rev. 2000;80:717–766. doi: 10.1152/physrev.2000.80.2.717. [DOI] [PubMed] [Google Scholar]
- 30.Macosko EZ, et al. A hub-and-spoke circuit drives pheromone attraction and social behaviour in C. elegans. Nature. 2009;458:1171–1175. doi: 10.1038/nature07886. [DOI] [PMC free article] [PubMed] [Google Scholar]
- 31.Li C, Kim K, Nelson LS. FMRFamide-related neuropeptide gene family in Caenorhabditis elegans. Brain Res. 1999;848:26–34. doi: 10.1016/s0006-8993(99)01972-1. [DOI] [PubMed] [Google Scholar]
- 32.Fares H, Greenwald I. Genetic analysis of endocytosis in Caenorhabditis elegans: coelomocyte uptake defective mutants. Genetics. 2001;159:133–145. doi: 10.1093/genetics/159.1.133. [DOI] [PMC free article] [PubMed] [Google Scholar]
- 33.Fares H, Grant B. Deciphering endocytosis in Caenorhabditis elegans. Traffic. 2002;3:11–19. doi: 10.1034/j.1600-0854.2002.30103.x. [DOI] [PubMed] [Google Scholar]
- 34.Sieburth D, Madison JM, Kaplan JM. PKC-1 regulates secretion of neuropeptides. Nat Neurosci. 2007;10:49–57. doi: 10.1038/nn1810. [DOI] [PubMed] [Google Scholar]
- 35.Jacob TC, Kaplan JM. The EGL-21 carboxypeptidase E facilitates acetylcholine release at Caenorhabditis elegans neuromuscular junctions. J Neurosci. 2003;23:2122–2130. doi: 10.1523/JNEUROSCI.23-06-02122.2003. [DOI] [PMC free article] [PubMed] [Google Scholar]
- 36.Husson SJ, et al. Impaired processing of FLP and NLP peptides in carboxypeptidase E (EGL-21)-deficient Caenorhabditis elegans as analyzed by mass spectrometry. J Neurochem. 2007;102:246–260. doi: 10.1111/j.1471-4159.2007.04474.x. [DOI] [PubMed] [Google Scholar]
- 37.White JG, Southgate E, Thomson JN, Brenner S. The structure of the nervous system of the nematode Caenorhabditis elegans. Philosophical Transactions of the Royal Society of London B. 1986:1–340. doi: 10.1098/rstb.1986.0056. [DOI] [PubMed] [Google Scholar]
- 38.Chalfie M, et al. The neural circuit for touch sensitivity in Caenorhabditis elegans. J Neurosci. 1985;5:956–964. doi: 10.1523/JNEUROSCI.05-04-00956.1985. [DOI] [PMC free article] [PubMed] [Google Scholar]
- 39.Ben Arous J, Tanizawa Y, Rabinowitch I, Chatenay D, Schafer WR. Automated imaging of neuronal activity in freely behaving Caenorhabditis elegans. J Neurosci Methods. 2010;187:229–234. doi: 10.1016/j.jneumeth.2010.01.011. [DOI] [PubMed] [Google Scholar]
- 40.Taylor CW, Tovey SC. IP(3) receptors: toward understanding their activation. Cold Spring Harb Perspect Biol. 2010;2:a004010. doi: 10.1101/cshperspect.a004010. [DOI] [PMC free article] [PubMed] [Google Scholar]
- 41.Lanner JT, Georgiou DK, Joshi AD, Hamilton SL. Ryanodine receptors: structure, expression, molecular details, and function in calcium release. Cold Spring Harb Perspect Biol. 2010;2:a003996. doi: 10.1101/cshperspect.a003996. [DOI] [PMC free article] [PubMed] [Google Scholar]
- 42.Stern MD, Cheng H. Putting out the fire: what terminates calcium-induced calcium release in cardiac muscle? Cell Calcium. 2004;35:591–601. doi: 10.1016/j.ceca.2004.01.013. [DOI] [PubMed] [Google Scholar]
- 43.Nassel DR. Neuropeptide signaling near and far: how localized and timed is the action of neuropeptides in brain circuits? Invert Neurosci. 2009;9:57–75. doi: 10.1007/s10158-009-0090-1. [DOI] [PubMed] [Google Scholar]
- 44.Craig AD. How do you feel--now? The anterior insula and human awareness. Nat Rev Neurosci. 2009;10:59–70. doi: 10.1038/nrn2555. [DOI] [PubMed] [Google Scholar]
- 45.Qin D, Xia Y, Whitesides GM. Soft lithography for micro- and nanoscale patterning. Nat Protoc. 2010;5:491–502. doi: 10.1038/nprot.2009.234. [DOI] [PubMed] [Google Scholar]
- 46.Nagel G, et al. Light activation of channelrhodopsin-2 in excitable cells of Caenorhabditis elegans triggers rapid behavioral responses. Curr Biol. 2005;15:2279–2284. doi: 10.1016/j.cub.2005.11.032. [DOI] [PubMed] [Google Scholar]
- 47.Redemann S, et al. Codon adaptation-based control of protein expression in C. elegans. Nat Methods. 2011;8:250–252. doi: 10.1038/nmeth.1565. [DOI] [PubMed] [Google Scholar]
- 48.Bretscher AJ, et al. Temperature, oxygen, and salt-sensing neurons in C. elegans are carbon dioxide sensors that control avoidance behavior. Neuron. 2011;69:1099–1113. doi: 10.1016/j.neuron.2011.02.023. [DOI] [PMC free article] [PubMed] [Google Scholar]
- 49.Kerr RA, Schafer WR. Intracellular Ca2+ imaging in C. elegans. Methods in molecular biology. 2006;351:253–264. doi: 10.1385/1-59745-151-7:253. [DOI] [PubMed] [Google Scholar]
- 50.Hagen GM, Caarls W, Lidke KA, De Vries AH, Fritsch C, Barisas BG, Arndt-Jovin DJ, Jovin TM. Fluorescence recovery after photobleaching and photoconversion in multiple arbitrary regions of interest using a programmable array microscope. Microsc Res Tech. 2009;72:431–440. doi: 10.1002/jemt.20686. [DOI] [PMC free article] [PubMed] [Google Scholar]
- 51.Bargmann CI, Avery L. Laser killing of cells in Caenorhabditis elegans. Methods Cell Biol. 1995;48:225–250. doi: 10.1016/s0091-679x(08)61390-4. [DOI] [PMC free article] [PubMed] [Google Scholar]
Associated Data
This section collects any data citations, data availability statements, or supplementary materials included in this article.