

Abstract
Many psychological learning theories have noted commonalities between aversive states produced by presentation of negative reinforcers, such as electric shock, and the omission of expected positive reinforcers, such as food. Here, three groups of rats received training with one auditory cue paired with shock and another with the omission of expected food, a shock-paired cue and a food-omission control cue, or a food-omission cue and a shock control cue. Food-omission cues were established by contrast with food delivery; after extensive light–food pairings, the light was followed by the food-omission cue instead of food. Aversiveness of the food-omission cue was assessed with a conditioned punishment procedure, in which presentation of that cue was made contingent on performance of one previously trained instrumental response, whereas a second response had no consequences. We found that rats with lesions of amygdala central nucleus (CeA) showed impaired acquisition of freezing to the cue paired with shock and no evidence for acquisition of aversive properties by the cue that accompanied the omission of expected food. Furthermore, analyses of Arc and Homer1a mRNAs after rats were exposed to a two-epoch test procedure that allowed assessment of gene expression produced by two different test stimuli showed that both food-omission and shock-paired cues generated more neuronal activity in CeA than appropriate control cues. However, the number of neurons that were activated by both shock and food-omission cues was not significantly greater than expected by chance. Thus, under these test conditions, different subsets of CeA neurons represented these two aversive states.
Introduction
Cues that predict biologically significant events come to control motivational or emotional states. For example, signals for electric shock acquire the ability to elicit various behavioral and autonomic measures of fear, to serve as conditioned reinforcers for new aversive learning, and to enhance ongoing instrumental shock-avoidance behavior. Each of these emotional consequences is mediated by the amygdala (Gewirtz and Davis, 1977; Davis, 2000; LeDoux, 2003; Choi et al., 2010).
The amygdala plays a similar role in the acquisition of emotional/motivational consequences of appetitive conditioning, often described as incentive learning (Berridge, 2001). Lesions of various amygdala subnuclei impair the normal ability of cues paired with food delivery to serve as conditioned reinforcers (Hatfield et al., 1996), to modulate ongoing instrumental behavior (e.g., pavlovian-instrumental transfer; Corbit and Balleine, 2005, 2011), and to modulate consummatory behavior (e.g., cue-potentiated feeding; Petrovich et al., 2005, 2009).
Attempts to specify the relations and interactions between learned appetitive and aversive states played an important role in the development of modern learning theory. For example, cues paired with the omission of expected shock have been found to acquire the ability to both inhibit fear and to reward new instrumental learning (Lolordo, 1969), and cues paired with the omission of expected food have been shown to acquire aversive properties (Amsel, 1958). Such outcomes led many theorists to propose mutually inhibitory relations among learned motivational states or responses (Mowrer, 1947, 1960; Rescorla and Solomon, 1967). For example, cues paired with the presentation and omission of shock, respectively, would control fear and a positive state of “relief” (Mowrer, 1960) or “safety” (Bolles, 1972), and cues paired with presentation and omission of food would control positive states of incentive, or “hope,” and negative states of “disappointment” or “frustration” (Amsel, 1958; Mowrer, 1960).
There has been relatively little neurobiological analysis of such motivational states derived from the omission of an expected event. Here, we examined the role of the amygdala central nucleus (CeA) in aversive learning acquired to cues paired with shock and to cues paired with the omission of expected food. We focused on the CeA because of its well-documented involvement in both fear conditioning (Koo et al., 2004) and incentive learning (Corbit and Balleine, 2005; Mahler and Berridge, 2009) and because of observations that CeA neurons code the omission of expected rewards (Calu et al., 2010) and that CeA function is critical for the enhanced learning that normally occurs after the surprising omission of rewards (Holland and Gallagher, 1993a,b, 1999).
Rats received stimuli paired with the omission of expected food, the delivery of shock, or neither (control stimulus). Conditioned punishment tests showed that the food-omission cue was aversive. In experiment 1, we used an Arc/Homer1a immediate-early gene (IEG) activation procedure to determine that both shock and food-omission cues activated more CeA neurons than control cues but that these populations of neurons were non-overlapping. In experiment 2, we found that CeA lesions impaired the acquisition of negative value to either the shock or food-omission cues.
Materials and Methods
Subjects.
Experimentally naive male Long–Evans rats (Charles River Laboratories), weighing ∼300–325 g on arrival, were individually caged and maintained on a 12 h light/dark cycle (lights on at 7:00 AM). After 5 d of acclimation to vivarium conditions, during which time they were handled extensively, rats were reduced to 85% of their free-feeding weight by restricting their access to food and were maintained at this weight during all procedures. They were allowed ad libitum access to water throughout the experiment. There were 40 rats in experiment 1 and 46 in experiment 2.
Apparatus.
The behavioral training apparatus consisted of four individual chambers (22.9 × 20.3 × 20.3 cm) with aluminum front and back walls, clear acrylic sides and top, and a floor made of 0.48 cm stainless steel rods spaced 1.9 cm apart. A dimly illuminated food cup was recessed in the center of the front wall. An infrared photocell placed just inside the food cup was polled (1 kHz) by computer circuitry to record the time each rat spent with its head in the food cup. Each chamber was enclosed in a sound-resistant shell. A speaker, used to present auditory conditioned stimuli (CS), was mounted on the inside wall of the inner shell, 10 cm above the experimental chamber and even with the front wall of the chamber. A 6 W lamp was mounted behind a jeweled lens on the front wall, 10 cm above the food cup; illumination of this lamp served as a light conditioned stimulus. Instrumental procedures were performed using two metal chains 0.8 cm in diameter and 16 cm in length, which were attached to electronic switches mounted atop each training chamber. Chains were lowered through the training chamber ceiling during instrumental procedures and hung 3.5 cm in front of the food cup and 6.5 cm to either side of it. The number of chain pulls each rat produced was recorded by computer circuitry monitoring the closure of the switches caused by each chain pull. Ventilation fans provided masking noise (70 dB). Constant dim illumination was provided by a 6 W lamp behind a dense red lens mounted next to the speaker. A television camera was mounted within each shell to provide a view of the chamber; the output from each camera was digitized, merged into a single image of all four chambers, and recorded on videotape.
Behavioral training procedures.
Table 1 provides an outline of the key behavioral procedures used in these experiments. Rats were randomly assigned to one of three groups. Rats in the omission + shock (O-S) group received training with both food-omission and shock cues. Rats in group O-SC (omission-shock control) received food-omission cue training and shock control cue training, in which that control cue was explicitly unpaired with shock delivery. Rats in group OC-S (omission control-shock) received omission control cue training, in which presentations of that control cue was unrelated to presentation or omission of food, and shock cue training. Experiment 1 was conducted in three identical replications, with four rats in each group in each replication. Experiment 2 was also conducted in three identical replications, with varying numbers (noted below in Histology Results) of CeA-lesioned and sham-lesioned rats in each group.
Table 1.
Outline of behavioral procedures
| Group | Instrumental training | Appetitive training (phase 1) | Shock/food-omission training (phase 2) | Omission cue test | Arc/Homer1a test |
|---|---|---|---|---|---|
| O-S | Left chain→food | Light→food | Light→food; tone→shock | Left chain→noise | Noise/home/tone |
| Right chain→food | Light→food | Light→noise→nothing | Right chain→nothing | ||
| OC-S | Left chain→food | Light→food | Light→food; tone→shock | Left chain→noise | Noise/home/tone |
| Right chain→food | Light→food | Noise→nothing | Right chain→nothing | ||
| O-SC | Left chain→food | Light→food | Light→food; tone, shock | Left chain→noise | Noise/home/tone |
| Right chain→food | Light→food | Light→noise→nothing | Right chain→nothing |
The group designations indicate the nature of training received. Group O-S received training with both a food-omission cue and a shock-paired cue, group OC-S received training with a control cue unpaired with food or food-omission and with a shock-paired cue, and group O-SC received training with a food-omission cue and a control cue unpaired with shock. The roles of tone and noise cues, left and right chains, and their combinations were fully counterbalanced throughout the experiments. In experiment 2, the Arc/Homer1a test was replaced by a test of the shock cue comparable with the previous omission cue test.
All rats first received one 64-min session to train them to approach and eat from the food cup during food delivery. This session included 16 deliveries of two 45-mg fruit punch food pellets (Test Diets), the food reward used throughout the experiment.
The rats next received 10 sessions of instrumental chain-pull training, to prepare rats for a conditioned punishment test, used to assess the aversive properties of the food-omission and control cues. In session 1, rats were trained to acquire chain pulling by allowing them access to the left chain. In this session, each chain pull led to delivery of one fruit punch pellet. To enhance the probability of initial chain pulling, the chain was baited with a paste made from crushed grain pellets, sucrose, and water. Each rat's session was terminated after it performed at least 50 chain pulls. Rats were trained in the same way during session 2 except that the right chain was used instead of the left. In the remaining sessions, which were 32 min in duration, rats were trained on successively higher random ratio (RR) schedules, to increase their rate of instrumental responding. Sessions 3 and 4 gave rats access to the left and right chain, respectively, which produced fruit punch pellets on an RR-5 schedule. Sessions 5–10 gave rats alternating access to the left and right chains, which produced fruit punch pellets on an RR-10 schedule. In experiment 2, the order of training with the left and right chains was counterbalanced in sessions 1–4, and the sequence of sessions 5–10 was randomized.
Rats then received 64 min sessions of phase 1 appetitive training to establish the illumination of the light as a signal for food. In each of these sessions, they received 16 presentations of a 10 s light stimulus, followed immediately by the delivery of two fruit punch food pellets. In experiment 1, sessions were continued until each of the three groups spent on average >40% of their time in the food cup during the last 5 s of the light cue (range of five to seven sessions). In experiment 2, all rats received six sessions of light training.
Over the next 13 d, the rats received phase 2 training to establish auditory cues as signals for shock, the omission of the food pellets normally predicted by the light cue, or no event. In each of the 10 64-min appetitive training sessions in this phase, rats in all three groups received four reinforced presentations of the light cue to maintain the light–food association. In addition, rats that received omission cue training (groups O-S and O-SC) received 12 presentations of a serial compound stimulus comprising the 10 s light cue followed immediately by a 10 s auditory omission cue (a 78 dB, 1500 Hz tone or a 78 dB white noise, counterbalanced); no food was delivered on these trials. Rats in group OC-S, whose training was designed to leave that auditory cue relatively neutral, received 12 presentations of a lone 10 s auditory control cue, intermixed with the four reinforced light presentations.
Three sessions of shock cue training were intermixed within phase 2 appetitive training (sessions 5, 9, and 13). The rats in groups O-S and OC-S were trained to establish the auditory cue that was not used in omission cue training (noise or tone, counterbalanced) as a signal for shock, whereas the rats in group O-SC were given training designed to leave that cue relatively neutral. In each of these sessions, the rats in groups O-S and OC-S received four 10-s presentations of the auditory cue, followed immediately by delivery of electric shock (0.35 mA, 0.5 s; model H13-15; Coulbourn Instruments) through the metal bars comprising the training chamber floor. Rats in group O-SC received four 10-s presentations of the auditory cue, explicitly unpaired with four intermixed unsignaled shock deliveries, in each of these sessions.
The next two (experiment 2) or three (experiment 1) sessions were instrumental chain-pull reminder sessions in which rats received alternating 32-min sessions of RR-10 training with the left and right chains in an attempt to reestablish chain pulling at a high rate in preparation for the instrumental choice test. Rats in experiment 1 received a second reminder session with the left chain to increase left chain responding to original training levels.
An instrumental choice test of conditioned punishment was then conducted to examine whether the omission cue training was successful in establishing aversive properties to that cue. In this 30 min test, both the left and right chains were simultaneously present. Pulls on the “cue” chain (left or right, counterbalanced) produced a 2 s presentation of the omission cue (groups O-S and O-SC) or the control cue (group OC-S) on an RR-5 schedule, and pulls on the other, “no-cue,” chain had no consequence. A decrease in pulling on the cue chain relative to pulling on the no-cue chain was taken to mean that the cue had acquired aversive properties. This reduction was compared with the difference (if any) noted in group OC-S, which contrasted chain pulls with no consequence and those that yielded presentations of the control cue.
After this instrumental choice test, the rats in experiment 1 were given a cycle of omission cue and/or shock cue retraining, which consisted of three sessions of phase 2 appetitive cue training, followed by one session of shock cue training. These sessions were identical to those encountered earlier in phase 2 and were intended to prepare subjects for subsequent Arc/Homer1a testing.
In the Arc/Homer1a test, two different cues were presented in a temporal arrangement, allowing the mRNAs of Arc and Homer1a to be used for labeling purposes (Vazdarjanova and Guzowski, 2004). Rats were placed into the training chambers for 5 min, during which time they received two presentations of one of the auditory cues used in training. The rats were then returned to their home cages in the colony room for 20 min. Next, they were returned to the training chambers for a final 5 min, during which they received two presentations of the other auditory cue. At the end of this last 5 min period, rats were removed from the chambers and transported to a perfusion room, in preparation for histological analysis (below). The two cues presented were the reward omission and shock cues in group O-S, the omission and control cues in group O-SC, and the shock and control cues in group OC-S. The order in which the cues were presented was fully counterbalanced with respect to both the training history of the cues and their physical identity (tone or noise). As negative controls, one rat from each training group was withheld from the Arc/Homer1a behavioral test and instead was prepared for histological analysis immediately after removal from its home cage.
In experiment 2, the rats did not receive omission/shock retraining or Arc/Homer1a testing. Instead, after the initial instrumental choice test, these rats were given an additional pair of RR-10 retraining sessions (one for each chain), followed by a second instrumental choice test. The purpose of this test was to assess the conditioned punishment properties of the shock-paired cue in sham and CeA-lesioned rats. This test was identical to the first one, except that pulls on the cue chain yielded 2 s presentations of the cue not presented in the first choice test, that is, the shock cue in groups O-S and OC-S, and the control cue in group O-SC, on an RR-5 schedule. For half of the rats in each group, the cue chain was the same as in the first choice test, and, for the other half, the cue chain in the second choice test had been the no-cue chain in the first test.
Behavioral observation procedures.
Freezing behavior, which served as the primary measure of conditioning to the shock cue, was evaluated by scoring behavior from videotaped recordings of training and testing sessions. An instantaneous sampling procedure was used in which ongoing behavior was recorded at 1.25 s intervals (signaled by a click recorded on the videotape) during the 30 s before shock cue presentation and throughout the shock cue itself. Freezing was defined as the absence of all body movement except that required for breathing.
Behavioral data analysis.
The measure of food-based conditioned responding was the percentage of time each rat spent with its head in the recessed food cup during the last half of each 10 s interval of cue presentations. The percentage of observations on which freezing occurred served as the measure of shock-based learning. The measures of instrumental responding were the rate of chain pulling (responses per minute) and a preference ratio [cue chain responding/(cue chain responding + no cue chain responding)]. The use of a preference ratio reduced variation produced by individual differences among the rats in the overall rate of chain pulling. In addition, the preference ratio in the test session was normalized against the preference ratio in training by dividing each rat's preference ratio in test by its preference ratio from the last two training sessions. The use of this normalized ratio removed any confound with any individual rats' chain preferences established in initial chain-pull training. The normalized preference ratio would be 1.0 with no change in preference, <1.0 if preference shifted away from the cue chain, and >1.0 if preference shifted toward the cue chain, as a result of reward omission training condition.
These measures were initially subjected to ANOVAs that included all training groups, lesions (experiment 2 only), and counterbalancing variables (noise/tone identity of omission and shock cues and/or choice of left or right chain as cue chain) as between-subject variables, and cue function (shock cue/omission cue), chain function (cue or no-cue chain), and blocks of trials or minutes as within-subject variables. None of the counterbalancing variables interacted significantly with the other variables, so we excluded those variables from the analyses reported here. Post hoc comparisons used Tukey's honestly significant difference procedure, corrected for unequal n values (if necessary) using the Spotvoll/Stoline procedure. p < 0.05 was used as the criterion for statistical significance throughout.
Histological procedures (experiment 1).
Immediately after the second 5-min Arc/Homer1a test period, rats were deeply anesthetized with isoflurane (Aerrane; Henry Schein) and perfused with 200 ml of 0.9% saline, followed by 400 ml of cold 4% paraformaldehyde in 0.1 m phosphate buffer (PB). Perfusion with saline began 90–120 s after the completion of the test session, and the fixative reached the brain within 4–5 min after the test session. The brains were removed, stored overnight in 4% paraformaldehyde with 20% (w/v) sucrose at 4°C, rapidly frozen with dry ice, and kept at −80°C. Most (n = 9) brains from the last of three replications were stored intact at −80°C, for subsequent whole-brain autoradiographic study, not reported here. Brains from the first two replications [n = 24, of which one (group O-SC) was unusable because of poor perfusion] were sectioned with a sliding microtome under RNase-free conditions, and eight series of 30 μm coronal sections were collected into ice-cold 0.1 m PBS. Immediately after slicing, tissue was mounted on slides (Superfrost Plus; Thermo Fisher Scientific), vacuum dried overnight at room temperature, and then stored in air-tight containers with desiccant at −80°C. Although each slide included tissue from a single rat, all subsequent processing of the slides was conducted in a fully counterbalanced manner, such that each in situ run included equal numbers of slides of brains from each training condition, in a systematically intermingled order, which in turn was counterbalanced across runs. Finally, one of the eight tissue series was stained with thionin to serve as an anatomical guide when acquiring images from adjacent series processed with in situ hybridization.
Double-label fluorescence in situ hybridization.
Double-label fluorescence in situ hybridization for the IEGs Arc and Homer1a was performed on tissue sections according to protocols modified from those of Petrovich et al. (2005). First, Arc cRNA probes incorporating digoxigenin–UTP and Homer1a cRNA probes incorporating fluorescein–UTP were generated using a commercial transcription kit (MaxScript; Ambion) and premixed RNA-labeling nucleotide mixes containing either digoxigenin- or fluorescein-labeled UTP (Roche Applied Science). The plasmid used for generating Arc riboprobes contained full-length cDNA (∼3.0 kbp) of the Arc transcript (Lyford et al., 1995). The antisense riboprobe for Homer1a was directed to the 3.50 kb 3′ untranslated region (UTR) of the Homer1a mRNA (Bottai et al., 2002). Riboprobes were purified with EtOH precipitation, and their integrity was confirmed by dot-blot analysis.
Next, slides were equilibrated in 0.1 m PBS and treated with proteinase K in 12% SDS buffer at 37°C. They were then washed with 0.25% acetic anhydride/0.32% acetic acid/1.5% triethanolamine, equilibrated in 2× SSC, and dehydrated through serial ethanol solutions. A hybridization solution containing the cRNA probes was applied to the tissue, which was then hybridized for 20 h at 60°C.
After hybridization, slides were equilibrated in 4× SSC and treated with 50% formamide (v/v) in 4× SSC at 60°C. After treatment with RNase (60 μg/ml), slides were washed in descending concentrations of SSC (2×, 1×, 0.5×, and 0.1×) at 60°C. Tissue was then switched to the Tris buffer system and blocked for 30 min [blocking agent supplied with PerkinElmer Life and Analytical Sciences Tyramide Signal Amplification system; see below]. Slides were then incubated with anti-digoxigenin horseradish peroxidase (HRP) antibody conjugate (Roche Applied Science) overnight at room temperature. The next day, a cyanine 3 (Cy3) substrate kit (NEL704A; PerkinElmer Life and Analytical Sciences) was used to detect Arc. Slides were then treated with 4% H2O2 to quench any residual HRP activity. The fluorescein-labeled probe targeting the 3′ UTR of Homer1a was detected by treating slides with anti-fluorescein–HRP conjugate (Roche Applied Science) overnight at room temperature and then with a fluorescein isothiocyanate (FITC) substrate kit (NEL701A; PerkinElmer Life and Analytical Sciences). Nuclei were counterstained with DAPI (Vectashield Hardset with DAPI; Vector Laboratories).
In the second replication of this experiment, we initially found higher than normal background riboprobe expression. Consequently, we modified the above protocol slightly to decrease this background. First, we purified riboprobes with spin columns (Sephadex G-50; Roche) instead of EtOH precipitation. Second, we hybridized the slides for 16 h instead of 20 h, and finally, we treated the slides with anti-digoxigenin and anti-fluorescein antibodies for 2 h instead of overnight.
Brain sections processed with combined double-label fluorescence in situ hybridization were analyzed with fluorescence microscopy. Images were acquired on a Carl Zeiss Axioskop fluorescence microscope equipped with a Carl Zeiss Axiocam HRc, Openlab 5 imaging software (Improvision), a 50 W HBO mercury arc lamp (Osram), and three filters for exciting Cy3, FITC, and DAPI wavelengths. After identifying landmarks in the adjacent thionin-stained sections, one section (Swanson, 1998, plate 25) displaying medial CeA (mCeA) and one section (Swanson, 1998, plate 27) displaying lateral CeA (lCeA) was analyzed in each brain. We sampled equal areas from each subregion in each rat. A procedure was used to manually acquire z-stacks composed of ∼4- to 5-μm-thick optical sections through each of these two regions of interest. It involved (1) adjusting the focal knob of the microscope so nuclei were just out of focus, (2) advancing the focus a constant amount into the focal direction, (3) capturing an image with the 40× objective with each of the three filters to form an image triplet, and (4) repeating steps 2 and 3 until nuclei became focused and then unfocused, indicating that images had been acquired through the entire thickness of the section. A typical brain section produced approximately eight image triplets, which could be digitally combined into eight sequential slices (see below). Exposure time (1 s) remained constant for all images. Adobe Photoshop CS 8.0 (Adobe Systems) was used to optimize image gain for detecting intranuclear signal and to combine image triplets into slices for cell counting.
We used a subset of the sections analyzed here to compare this method to the visualization method we have used previously (H. J. Lee et al., 2005; Petrovich et al., 2005), in which images were acquired with a Carl Zeiss LSM 510 META confocal microscope, focusing and counting throughout the z-stack. In all cases, >80% of the intranuclear IEG signals identified confocally were also identified with the simpler fluorescent procedure, and their categorization was identical. Figure 3, C and D, shows simple fluorescent and confocal images of the same sample slice.
Figure 3.

Arc/Homer1a expression in experiment 1. A shows the percentage (left scale) and numbers of cells per square millimeter (right scale) of CeA neurons that expressed IEGs associated with the presentation of the omission cue alone, the shock cue alone, or both IEGs. Values are collapsed across identity of the IEG (Arc or Homer1a; see Results) and CeA subregions (see Results; Table 2). *p < 0.05, significantly less IEG expression in the control cue conditions than in the omission or shock cue conditions. B shows the reactivation index [double-labeled neurons/(Homer1a only neurons + double-labeled neurons)] for each of the three training groups and the four rats (group O-O) that were tested with the same cue in both epochs of the Arc/Homer1a test. *p < 0.001, significantly higher reactivation index in group O-O (four brains) than in any of the other groups. The group designations indicate the nature of training received. Group O-S (8 brains) received training with both a food omission cue and a shock-paired cue, group OC-S (8 brains) received training with a shock-paired cue and a control cue unpaired with food or food omission, and group O-SC (7 brains) received training with a food-omission cue and a control cue unpaired with shock. C shows fluorescence and D shows confocal images of the same section. Red and green intranuclear foci indicate Arc-expressing and Homer1a-expressing cells, respectively; nuclei are identified by DAPI (blue).
Three types of neurons were encountered: nonlabeled neurons (DAPI only), single-labeled neurons (DAPI + Arc or DAPI + Homer1a intranuclear foci), and double-labeled neurons (DAPI + distinct, non-overlapping Arc and Homer1a intranuclear foci). The numbers of single- and double-labeled neurons in a slice were each expressed as a percentage of the total number of neurons (non-labeled, single-labeled, and double-labeled) counted within the slice. Nuclei that extended past the edges of an image were not included in the analysis. In addition, nuclei that showed overlapping Arc and Homer1a foci (n = 5) in the fluorescent images were discarded. Our comparison of sections imaged with both confocal and fluorescent images indicated that such overlapping foci reflected single-labeled cells in different planes, beyond the resolution of the fluorescent procedure, rather than double-labeled cells. These procedures ensured against double-counting and provided equal opportunity to observe neurons in each behavioral training condition but did not permit unbiased estimating of absolute numbers of neurons of each type found in a target region. Instead, we compared the proportions of single- and double-labeled neurons (of the total numbers of neurons sampled) in comparable sections across the three behavioral training conditions. In addition, we also computed a “reactivation index” (Saddoris et al., 2009), the probability of also displaying Arc labeling given Homer1a labeling. This index estimates the probability that a neuron activated by the first cue tested was also activated by the second cue tested.
Both the neuron percentages and reactivation ratios were subjected to ANOVAs comparable with those used for the behavioral data.
Additional Arc/Homer1a control procedures (experiment 1).
To provide suitable baselines for evaluating the results of experiment 1, an additional cohort of four rats (Group O-O) received training identical to that received by group O-S. However, in the Arc/Homer1a test, those rats received the omission cue in both cue periods, to provide an estimate of the maximum level of double labeling that could be expected in tests of omission cues.
Surgical procedures (experiment 2).
In experiment 2, CeA lesions were made after the rats' completion of initial instrumental chain-pull training but before appetitive or aversive training. Rats were anesthetized with isoflurane gas, and stereotaxic surgery was conducted under aseptic conditions. The neurotoxic and sham CeA lesions were made using stereotaxic coordinates 2.4 mm posterior to bregma and 4.35 mm right and left of the midline, with infusions at a depth of 7.9 mm from the skull surface. Each bilateral CeA lesion (n = 26) was made using 0.25 μl of 10 μg/μl ibotenic acid (Sigma) in PBS solution, infused with a Hamilton 2.0 μl syringe over a 3 min period; sham-lesioned rats (n = 18) received injections of the PBS vehicle only. After surgery, each rat received a single 0.015 ml subcutaneous injection of 0.4 mg/ml buprenorphine hydrochloride (Sigma) for amelioration of pain and was allowed to recover from surgery for 7–10 d before resuming behavioral training.
Histology (CeA lesion assessment in experiment 2).
After completion of the second instrumental choice test in experiment 2, the rats were anesthetized and perfused with 0.9% saline, followed by 4% paraformaldehyde in 0.1 m PB. Brains were removed, postfixed, and cryoprotected overnight in 4% paraformaldehyde in 0.1 m PB containing 12% sucrose, frozen with powdered dry ice, and stored at −80°C. Sections (30 μm) were taken from each brain on a freezing microtome, and every third section was mounted on slides and Nissl stained to evaluate the lesions. Sections of CeA at five coronal planes were identified and photographed. Outlines of the lesion extents were drawn on digital images of CeA from Swanson (1998) using Adobe Photoshop 10.0.1 (Adobe Systems). Calculation of percentage damage was performed within Photoshop by dividing the area (in pixels) of the intersection of lesion and CeA subregion extent by the subregion area. Damage was calculated for the mCeA, lCeA, and capsular divisions of the CeA.
Results
Experiment 1
Chain-pull training
All rats learned to pull the two chains; the initial points in Figure 2, A and B, show chain-pull rates on the final training session. A group × chain side (left/right) × chain function in test (cue/no-cue) × session ANOVA showed no significant effects or interactions involving group (F values <1, p values >0.596). By the end of training, responding on the right chain was greater than on the left (side × session interaction, F(3,99) = 5.57, p = 0.001).
Figure 2.

Instrumental choice test performance in experiment 1. A shows responses to the omission-cue-producing and no-consequence chains in group O-SC, and B shows responses to the control-cue and no-consequence chains in group OC-S. C shows cue preference ratios (cue-producing responses/total responses), normalized by training performance (test preference ratio/preference ratio in the final 2 training sessions). *p = 0.010, significantly lower preference ratio in group O-S than in group OC-S. The group designations indicate the nature of training received. Group O-S received training with both a food-omission cue and a shock-paired cue, and group OC-S received training with a shock-paired cue and a control cue unpaired with food or food omission. There were 12 rats in each behavioral training condition.
Reward and reward omission cue training
In phase 1, all rats rapidly learned to enter the food cup during presentations of the light that signaled food. Performance on the final session of phase 1 is shown in the initial points of Figure 1A. In phase 2, responding to the light was maintained, whereas the auditory reward-omission or unpaired cue came to control low levels of responding (Fig. 1A). ANOVA showed that conditioning was maintained at a higher level in group OC-S, which included only reinforced light trials, than in group O-S (F(1,22) = 5.11, p = 0.034), which included non-reinforced light–tone trials. Similarly, responding to the auditory cue was significantly lower in group OC-S than in group O-S (F(1,22) = 5.69, p = 0.026). This difference probably reflects carryover of responding from the light cue, which immediately preceded auditory cue presentations in group O-S but not in group OC-S. In each of these phases, pre-CS responding was <10% in all groups and did not differ across groups (p values >0.688).
Figure 1.

Acquisition of conditioned food cup (A) and freezing (B) responses in the food omission cue (A) and shock cue (B) training sessions of experiment 1. The leftmost points in A show performance to the light cue on the final light conditioning session. The group designations indicate the nature of training received. Group O-S received training with both a food-omission cue and a shock-paired cue, group OC-S received training with a shock-paired cue and with a control cue unpaired with food or food omission, and group O-SC received training with a food omission cue and a control cue unpaired with shock. There were 12 rats in each behavioral training condition.
Shock cue training and testing
In the three shock sessions of phase 2, freezing was rapidly acquired to the auditory shock cue in group O-S, which received cue–shock pairings, but was displayed at a low level in group O-SC, in which that cue and shock were unpaired (Fig. 1B). These two groups had identical omission cue training but differed in whether the other auditory cue was paired or unpaired with shock. ANOVA showed main effects of group (F(1,22) = 128.82, p < 0.001) and trial (F(11,242) = 7.33, p < 0.001) and a group × trial interaction (F(11,242) = 9.11, p < 0.001). Thus, the shock cue was clearly aversive to the rats in group O-S.
Freezing behavior was maintained to the shock cue in the Arc/Homer1a test but showed little generalization to the omission or control cues. In group O-S, there was 66.7 ± 4.5% freezing to the shock cue and 12.5 ± 5.4% freezing to the omission cue, whereas in group O-SC, there was 2.3 ± 1.7% freezing to the control cue and 3.4 ± 1.5% freezing to the omission cue. A group (O-S or O-SC) × cue (omission or shock/control cue) × cue presentation order (aversive/control cue first vs second) ANOVA showed significant effects of group, cue, and their interaction (F(1,19) > 54.03, p values <0.001). Freezing to the shock/control cue differed (p < 0.001) between the groups (that is, depended on whether the cue had been paired or unpaired with shock), but freezing to the omission cue did not differ between groups (p = 0.145). The numerically higher levels of freezing to the omission cue in group O-S than in group O-SC probably reflects a carryover of freezing from the first to the second test in group O-S rats that received the shock cue first in test; the group × cue × presentation order was also significant (F(1,19) = 5.76, p = 0.027). All in all, these results indicate that accurate knowledge of the training contingencies was maintained throughout testing, with rats freezing only to cues for shock and not to the omission or unpaired control cues.
Instrumental test of the aversive properties of the omission cue
An instrumental conditioned punishment test was conducted to assess the effectiveness of omission cue training in establishing aversive properties to that cue. Responses to the cue chain produced either the omission cue (group O-S) or the unpaired appetitive control cue (group OC-S). Figure 2 shows responding to the two chains in test. These two groups had received identical shock training but differed as to whether the other auditory cue had accompanied the omission of expected food (group O-S) or had been presented in isolation (group OC-S). As the test session proceeded, the rats in group O-S (Fig. 2A) came to suppress responses to the cue chain (relative to the no-cue chain), as would be expected if the omission cue had acquired aversive properties in that group. No such trend was observed in group OC-S (Fig. 2B), in which responses to the cue chain produced presentations of the control cue.
An initial group × chain (cue vs non-cue) × trial blocks ANOVA showed a significant group × chain interaction (F(1,22) = 4.47, p = 0.046). We then focused our statistical analysis on the data from the middle half of the test session (minutes 9–24) so as to exclude data from the initial portions of the session, in which rats had not yet learned the chain-cue contingencies, and from the last portion of the session, in which responding to both chains was mostly extinguished. ANOVA showed a significant group × chain (cue vs no-cue) interaction (F(1,22) = 5.69, p = 0.026), and planned comparisons showed that responding to the cue chain was lower than responding to the no-cue chain in group O-S (p = 0.023) but not in group OC-S (p = 0.366). These differences were not confounded with any initial preferences for one or the other chain; the normalized preference ratios (Fig. 2C) were significantly lower in group O-S than in group OC-S (F(1,20) = 8.06, p = 0.010). Thus, the omission cue was clearly aversive to the rats in group O-S relative to the control cue in group OC-S.
Arc/Homer1a expression
We sampled (mean ± SEM) 123 ± 7 neurons in mCeA and 131 ± 5 neurons in lCeA in each rat. For each rat, we expressed Arc-only, Homer1a-only or double-labeled neurons as a percentage of the total number of neurons sampled in that rat. The three cage control rats, which received the same training as the other rats but were killed for tissue analysis without exposure to the cues or text context, showed <1% labeling for either Arc or Homer1a; their data were not included in subsequent analyses. Initial analysis of the IEG data from the remaining rats in the three training groups revealed no effects of cue identity (noise vs tone), cue presentation order (first vs second), or region (mCeA vs lCeA) on the percentage of sampled neurons expressing IEGs (F values <1, p values >0.330). A main effect of expressed gene (Arc, Homer1a, or both) was observed (F(2,32) = 27.60, p < 0.001). Individual contrasts showed that this effect was entirely attributable to the lower incidence of double labeling for both Arc and Homer1a than either Arc or Homer1a singly (p values <0.001); the percentages of sampled neurons containing Arc versus Homer1a alone were not significantly different (p = 0.529).
Because the percentages of sampled neurons containing Arc or Homer1a were not significantly different, the Arc and Homer1a data were combined, and the data were recast in terms of expression of the shock cue IEG only, omission cue IEG only, and coexpression of both IEGs (Fig. 3A). Thus, in this analysis, the expression of the omission cue IEG (for example) included counts of both Homer1a (for rats in which the omission cue was presented in the first test epoch) and Arc (for rats in which the omission cue was presented in the second test epoch). ANOVA including all three groups, both CeA regions, and these three classes of IEG gene expression again showed a significant effect of IEG (F(2,40) = 31.30, p < 0.001). As in the previous analysis, this effect was entirely attributable to the lower level of double labeling relative to either single label (p values <0.001). Double labeling did not differ across the groups (Fig. 3A, right bars) or subregions (Table 2) (p values >0.649). The comparison of most interest in this ANOVA, the group × expressed gene interaction, indicated that the expression of the IEGs depended on the training of the cue presented in test (shock, omission, or control cue) and was significant (F(4,40) = 7.67, p < 0.001).
Table 2.
Percentage cells (mean ± SEM) expressing IEGs Arc or Homer1a in mCeA and lCeA
| Group | Omission cue | Shock cue | Both cues |
|---|---|---|---|
| mCeA | |||
| O-S | 5.59 ± 1.18 | 8.10 ± 1.56 | 0.74 ± 0.40 |
| OC-S | 2.63 ± 0.60 | 9.48 ± 2.43 | 0.55 ± 0.26 |
| O-SC | 10.11 ± 1.87 | 4.35 ± 0.96 | 0.89 ± 0.34 |
| lCeA | |||
| O-S | 8.53 ± 1.74 | 9.13 ± 2.67 | 1.12 ± 0.36 |
| OC-S | 2.44 ± 0.93 | 10.09 ± 2.15 | 0.99 ± 0.65 |
| O-SC | 7.57 ± 1.27 | 3.66 ± 1.02 | 0.55 ± 0.41 |
Because equal areas and nearly-equal (see Results) numbers of cells were sampled in the two subregions, the percentages shown are directly comparable across subregions. The group designations indicate the nature of training received. Group O-S (8 brains) received training with both a food-omission cue and a shock-paired cue, group OC-S (8 brains) received training with a control cue unpaired with food or food-omission and with a shock-paired cue, and group O-SC (7 brains) received training with a food-omission cue and a control cue unpaired with shock.
The critical test comparisons were those that contrasted IEG expression in group O-S, which was tested with both the shock cue and the omission cue, with IEG expression in the appropriate control groups. Consider first IEG expression in the test epoch that included presentation of the omission or omission control cue (Fig. 3A, left bars). A group (O-S vs OC-S) × region (lCeA vs mCeA) ANOVA showed that the percentage of neurons expressing the IEG appropriate to the test epoch that included the omission cue in group O-S was significantly greater than the percentage of neurons expressing the IEG appropriate to the test epoch that included the omission control stimulus in group OC-S (F(1,14) = 9.35, p = 0.009). IEG expression did not differ significantly as a function of subregion (Table 2) (F(1,14) = 3.00, p = 0.105).
Next, consider IEG expression in the epoch that included the shock or shock control cue (Fig. 3A, middle bars). A comparable ANOVA showed that the percentage of IEG-expressing sampled neurons was significantly greater in group O-S, which received the shock cue, than in group O-SC, which received the shock control cue (F(1,13) = 5.18, p = 0.040). Again, IEG expression did not differ significantly as a function of subregion (Table 2) (F < 1, p = 0.916). Thus, both omission and shock cues in group O-S provoked greater IEG expression in CeA than did their appropriate control cues in groups OC-S and O-SC.
Similar conclusions follow from comparisons of the two control groups, O-SC, which received test presentations of an omission cue and a control cue, and OC-S, which received test presentations of a shock cue and a control cue. IEG expression was greater after presentation of the omission cue in group O-SC than after presentation of the omission control cue in group OC-S (F(1,13) = 19.18, p <0.001) and greater after presentation of the shock cue in group OC-S than after presentation of the shock control cue in group O-SC (F(1,13) = 7.61, p = 0.016). Again, there were no effects of subregions (Table 2) (p values >0.223).
Double labeling
Both omission and shock cues activated more neurons in CeA than control cues. A key question addressed in this experiment was whether the same CeA neurons that were activated by a shock cue were also activated by the cue for food omission, which was also shown to be aversive in the instrumental choice test. As noted previously, the frequency of double labeling (Fig. 3A, right bars) was no greater in group O-S (in which both types of cues were presented in test) than in either of the control groups (in which the tests included one meaningful and one control cue). Previously (Saddoris et al., 2009), we have suggested that a more valuable index of double labeling is given by a “reactivation index,” which indicates the probability that a neuron was activated by the second episode in test (i.e., expressed Arc) given that it was activated by the first test episode (i.e., expressed Homer1a). If all neurons activated in the first test episode were also activated in the second episode, this index [double-labeled neurons/(Homer1a only neurons + double-labeled neurons)] would be 1.0. The right three bars of Figure 3B show this reactivation index in the three training groups. ANOVA showed no differences among these groups (F < 1, p = 0.647), indicating that neurons activated by an omission cue were no more likely to be reactivated by a shock cue (or vice versa) than by control cues.
Double-label concordance
Four additional rats were trained with the procedures of group O-S but were evaluated for Arc/Homer1a after a test that included the omission cue in both test epochs. In each behavioral training phase, the behavior of these rats was similar to that of the rats in group O-S. Of the cells sampled in these additional rats, 5.1 ± 1.8% displayed Homer1a activation only, 5.3 ± 1.1% expressed Arc only, and 8.2 ± 1.6% showed both Arc and Homer1a expression. Double labeling was greater in each of these four rats than in each of the rats in groups O-S, O-SC, and OC-S. The leftmost bar in Figure 3B shows the reactivation index for these four rats. All four of these rats showed higher reactivation indexes than any of the other rats tested. A one-way ANOVA showed a significant effect of group (F(3,23) = 26.21, p < 0.001), with group O-O showing significantly higher scores than each of the other groups (F(1,23) > 54.64, p values <0.001), which did not differ among themselves (p values >0.646). Although a reactivation index of 0.53 in group O-O falls short of the high levels of reactivation seen in studies of reactivation of hippocampal neurons after two exposures to the same environmental context (Vazdarjanova and Guzowski, 2004), it compares favorably with that observed in other studies of amygdala Arc/Homer1a activation (Saddoris et al., 2009).
Experiment 2
Histology
Figure 4A shows composite drawings of the 18 CeA lesions accepted for inclusion in groups O-SC and OC-S, and Figure 4B shows photographs of typical CeA (left) and sham (right) lesions. The average accepted lesion encompassed 54.1 ± 7.0% of mCeA and lCeA (combined) in group O-SC and 50.8 ± 5.4% in group CS. Damage to mCeA was 51.7 ± 7.1 and 48.8 ± 6.8% in those groups, respectively, and damage to lCeA was 62.1 ± 9.1 and 57.1 ± 7.3%. Seven lesions were rejected; five had insufficient damage to CeA (<30% damage to mCeA) in one or both hemispheres, and one included substantial bilateral damage to the adjoining basolateral amygdala regions. Behavioral data from rats with unacceptable lesions were not included in the analyses below. None of the sham-lesioned rats showed damage to CeA beyond minimal cell loss around the injector site.
Figure 4.
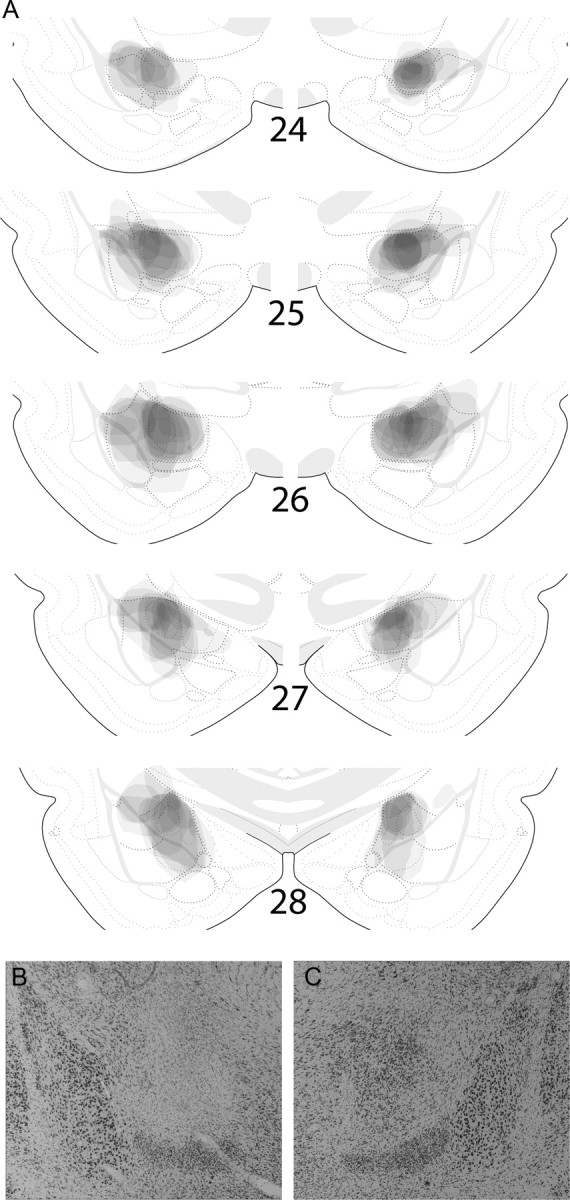
Accepted lesions (n = 18) in experiment 2. A shows drawings of lesion extents at each of five coronal planes. Each lesion extent was drawn in Photoshop with 5.6% (1/n) opacity. Thus, at any locus, the darker the shading, the more rats with damage at that locus. The numbered sections refer to the plate numbers shown in Swanson (1998). B and C show photographs of typical neurotoxic and sham lesions, respectively. Copyrighted drawings from Swanson (1998) used with permission of Elsevier.
Behavior
In experiment 2, the behavioral effects of reward omission training were evaluated by comparing performance involving an auditory cue that accompanied omission of food after a cue for food (group O-SC) with that involving a control auditory cue that was presented unpaired with food or food cues (group OC-S). Likewise, the effects of shock training were evaluated by comparing performance involving another auditory cue that was paired with shock (group OC-S) with that involving an auditory cue that was unpaired with shock (group O-SC). Although the O-S condition, in which one auditory cue was paired with food omission and the other with shock delivery, was critical for Arc/Homer1a testing in experiment 1, for the purposes of experiment 2, it was redundant with the treatments of the other two groups. Thus, only a small number (one CeA-lesioned and three sham-lesioned rats) were trained in this treatment condition in experiment 2. Their performance in the instrumental choice tests was similar to that of the experimental rats in the other two conditions; their data were not included in the statistical analyses below.
Chain-pull, reward, and reward omission cue training
One rat failed to acquire the chain-pull response and was discarded from the study without additional training. Two sham-lesioned rats were discarded after reward training because they failed to acquire conditioned responding to the visual cue; they responded no more during that cue than in the pre-CS periods and that responding did not change over the course of training. The final numbers of rats in each group were as follows: group O-SC, seven sham-lesioned and nine CeA-lesioned rats; and group OC-S, six sham-lesioned and nine CeA-lesioned rats.
The rats rapidly learned to pull both chains; performance on the final pair of training sessions is shown on the far left of each of Figure 6A–D. ANOVA including the rats' future lesion and behavioral treatment assignments, RR training session (1–4), and chain (left or right) showed significant effects of chain (F(1,27) = 14.10, p <0.001) and session (F(3,81) = 32.55, p < 0.001) and of the interaction of those two variables (F(3,81) = 4.55, p = 0.005). No other effects or interactions were significant (p values >0.217).
Figure 6.

Instrumental choice test performance in experiment 2. A and C show responses to the omission-cue producing and no-consequence chains in group O-SC, and B and D show responses to the control-cue and no-consequence chains in group OC-S. E shows cue preference ratios (cue-producing responses/total responses), normalized by training performance (test preference ratio/preference ratio in the final 2 training sessions). *p < 0.05, significantly lower preference ratios in sham-lesioned rats of group O-SC than in any of the other three lesion/training groups. The group designations indicate the nature of training received. Group O-SC (n = 9 lesions and 7 shams) received training with a food-omission cue and a control cue unpaired with shock, and group OC-S (n = 9 lesions and 6 shams) received training with a shock-paired cue and a control cue unpaired with food or food omission.
After recovery from surgery, all rats received light–food pairings for six sessions. Except for the two sham-lesioned rats that were discarded (as noted previously), the rats rapidly learned to enter the food cup during presentations of the light cue. The leftmost points in Figure 5A show performance in the final light–food training session. In phase 2, responding to that light was maintained, whereas responding to the auditory reward-omission cue in group O-SC declined to low levels (Fig. 5A). For responding to the light cue, ANOVA showed no main effects of either group or lesion (F values <1.04, p values >0.317) but significant interactions of each of those variables with session (F(9,243) > 1.92, p values <0.050). ANOVA of tone responding showed a significant main effect of group (F(1,27) = 18.73, p < 0.001) and session (F(9,243) = 7.97, p < 0.001) but no significant effect of lesion or any of the interactions of that variable (F values <1, p values >0.570). A similar ANOVA for the final session of this phase showed that the tone still controlled significantly more responding in group O-SC than in group OC-S (F(1,27) = 5.92, p = 0.022). Finally, ANOVA of pre-CS responding showed only a significant interaction of group × session (F(9,243) = 4.21, p < 0.001); by the end of this phase, pre-CS responding was higher in the rats in group O-SC.
Figure 5.

Acquisition of conditioned food cup (A) and freezing (B) responses in the food omission cue (A) and shock cue (B) training sessions of experiment 2. The leftmost points in A show performance to the light cue on the final light conditioning session. The group designations indicate the nature of training received. Group O-SC (n = 9 lesions and 7 shams) received training with a food-omission cue and a control cue unpaired with shock, and group OC-S (n = 9 lesions and 6 shams) received training with a shock-paired cue and a control cue unpaired with food or food omission.
Instrumental choice test of the aversive properties of the omission cue
The primary data of experiment 2 were the results of the instrumental choice test that evaluated aversive properties of the food-omission cue. Rats were given access to both chains simultaneously; responses on one produced either the omission cue (group O-SC) or the control unpaired appetitive cue (group OC-S) on an RR-5 schedule, and responses on the other had no scheduled consequences. No food was available in this test. As in experiment 1, we expected the effects of conditioned punishing properties of the omission cue to be most evident in the middle half of the test, after opportunity to learn the test response-cue contingencies but before excessive extinction of chain pulling.
Figure 6 shows responding on the two chains over the course of test 1 in the four lesion/treatment groups. Sham-lesioned rats showed a pattern of responding similar to the rats in experiment 1. As the test proceeded, rats in group O-SC (Fig. 6A) suppressed responding to the cue chain, which yielded the omission cue, relative to responding to the no-cue chain, whereas no such change in distribution of responding to the two chains was observed in group OC-S (Fig. 6C). Thus, suppression of responding for the omission cue in group O-SC was attributable to its previous pairing with the omission of food. In contrast, rats with CeA lesions (Fig. 6B,D) showed no significant preferences for either chain as a function of omission cue training; neither the lesioned rats in group O-SC (Fig. 6B) nor those in group OC-S (Fig. 6D) showed a preference for the no-cue chain.
An initial group × lesion × chain (cue vs non-cue) × trial blocks ANOVA showed significant group × lesion × chain (F(1,26) = 4.69, p = 0.040) and group × lesion × chain × blocks (F(7,182) = 2.73, p = 0.010) interactions. We then focused our analysis on responding during the middle half of the test session, as in experiment 1. ANOVA of these data showed a significant group × lesion × chain interaction (F(1,26) = 6.62, p = 0.016). Planned comparisons showed that sham-lesioned rats in group O-SC responded significantly less to the cue chain than to the no-cue chain (p = 0.015), whereas no such preferences were observed in the CeA-lesioned rats in that group or in either set of rats in group OC-S (p values >0.14). Normalized preference ratios (Fig. 6E) showed a similar pattern; ANOVA showed a significant group × lesion interaction (F(1,26) = 6.69, p = 0.016). Post hoc comparisons showed that the normalized preference ratio was lower in group O-SC shams than in any other treatment/lesion condition (p values <0.05). Thus, CeA was critical to the establishment of aversive properties to a cue paired with the omission of expected food.
Aversive cue training and testing
Both sham- and CeA-lesioned rats acquired freezing to the auditory cue in group OC-S, in which that cue was paired with shock, but not group O-SC, in which that cue was unpaired with shock (Fig. 5B). However, as in studies from other laboratories (Koo et al., 2004), freezing occurred at much lower levels in lesioned rats. A group × lesion × trial ANOVA showed main significant effects of all three variables (F values >5.30, p values <0.001), as well as significant interactions of group with lesion and trials (F values >5.94, p values <0.001). Post hoc tests showed more freezing in the sham-lesioned rats in group OC-S than the rats in each of the other treatment/lesion conditions (p values <0.001). In turn, CeA-lesioned rats in group OC-S showed more freezing than either sham- or CeA-lesioned rats in group O-SC (p values <0.001). No other differences were significant.
After the instrumental choice test of the aversive properties of the omission cue, the rats received a second choice test, intended to assess the ability of the shock cue to serve as a conditioned punisher of chain pulling. This test was identical to the omission test, except that pulls on one chain yielded presentations of the shock cue (group OC-S) or the control cue (group O-SC), and pulls on the other chain had no consequence. In this test, the initial response-contingent presentations of the shock cue appeared to produce substantial suppression of both the cue and no-cue responses. A group × lesion × chain × 4-min block ANOVA on response rates showed only a significant main effect of group (F(1,27) = 18.00, p <0.001) and block (F(7,189) = 8.97, p < 0.001); the critical two-, three-, and four-way interactions involving group and lesion were all insignificant (F values <1, p values >0.350). ANOVA on the middle half of responding (as conducted on the data in test 1) also showed only the effect of group to be significant (F(1,27) = 13.92, p < 0.001). Finally, to capture the suppression observed during initial cue presentation in this test, suppression ratios (SR) of the form SR = test responding/(test responding + baseline training responding) were calculated for each response over the first 4 min of test in each test condition. These ratios were significantly lower in the groups tested with the shock cue than those tested with the control cue (F(1,27) = 31.37, p < 0.001) for both cue- and no-cue-producing chains, which did not differ (F < 1, p = 0.494). For the cue-producing and no-cue responses, respectively, these ratios were 0.06 ± 0.02 and 0.14 ± 0.05 in group OC-S sham, 0.17 ±. 04 and 0.11 ± 0.04 in group OC-S CeA, 0.33 ± 0.05 and 0.26 ± 0.06 in group O-SC sham, and 0.38 ± 0.07 and 0.32 ± 0.03 in group O-SC CeA. Note that, although in typical usage of this suppression measure a value of 0.50 indicates no suppression, it must be recognized that here chain-pull responding was non-reinforced in the 4 min test period but reinforced in the training, baseline period. Thus, the observation of suppression ratios <0.50 in the control groups is of no significance; the important observation is the lower suppression ratios in the OC-S groups than in the O-SC groups.
Discussion
Tests of freezing and conditioned punishment showed that cues trained with either shock or the omission of expected food, respectively, acquired aversive properties. Neurons in CeA represented each kind of aversive information and were critical to the emergence of both conditioned freezing to the shock-paired cue and the ability of the food-omission cue to serve as a conditioned punisher of instrumental behavior. Surprisingly, separate populations of CeA neurons were activated by shock and food-omission cues. Thus, under these test conditions, a different subset of CeA neurons represented aversive states produced by expectation of shock and omission of food. Furthermore, food-omission and shock cue neurons were not segregated within CeA; each was found in similar numbers and proportions in both lCeA and mCeA. Finally, neurons activated by food omission or shock cues in group O-S rats appeared evenly dispersed, with no systematic clustering of Arc-expressing or Homer1a-expressing neurons within sampled sections.
Test of conditioned punishment with shock cues
Aspects of the results of the final instrumental choice test of experiment 2, in which the effect of response-contingent delivery of the shock cues were evaluated, warrant additional consideration. First, unlike in the test of the conditioned punishment power of the food-omission cues, mere presentation of the shock cues produced substantial suppression of both instrumental responses compared with responding of rats that received control cue presentations. Although this outcome makes it impossible to attribute reduced test responding to conditioned punishment specifically, the shock-paired cue clearly had acquired the ability to suppress rewarded instrumental behavior, another common measure of the aversiveness of cues (Estes and Skinner, 1941). The absence of such general suppression in the previous food-omission cue test suggests that cue was either less aversive overall than the shock cue or its aversiveness was more temporally specific. Note that, in training, whereas food was omitted at the onset of the omission cue, the shock was delivered 10 s after onset of the shock cue.
Second, unlike freezing behavior, there was no evidence that the ability of the shock cue to suppress instrumental behavior was affected by CeA lesions. This observation is consistent with results from traditional conditioned suppression experiments in which pavlovian cues for shock are superimposed on a baseline of food-rewarded instrumental responding (J. L. Lee et al., 2005; McDannald, 2010; but see Killcross et al., 1997). In those experiments, although rats with CeA lesions showed substantially less conditioned freezing than their unlesioned controls, their display of conditioned suppression was only minimally affected.
Third, it is worth noting that our shock cue test occurred after the food-omission cue test, so it might be argued that this test may simply have been less sensitive than the initial test, because the rats had already experienced response-contingent presentation of another cue and extinction of both chain-pull responses. However, the fact that choice test performance of rats that were tested with the control cue was similar regardless of whether they were tested with that cue in the first or second test suggests that the confounded test order was not a major contributor to the difference in the results of the two tests.
Functions of mCeA and lCeA
The observation of comparable levels of activation in lCeA and mCeA contrasts with several recent observations of specialization of function of these two subregions of CeA. For example, using combinations of anatomical tracing, electrophysiological recording, transient activation, optogenetic, and behavioral methods, Lüthi and colleagues (Ciocchi et al., 2010; Haubensak et al., 2010) found lCeA to control the acquisition of conditioned fear, whereas mCeA was engaged in the expression of conditioned fear responses, under the tonic inhibitory control of lCeA neurons. Furthermore, in our laboratory, H. J. Lee et al. (2005, 2010) found that presentation of food cues either with or without food provoked FOS expression in mCeA but not lCeA. This difference suggests that food omission cues are processed differently from either food cues or unexpected food omission itself (presentation of a food cue without food), at least in lCeA. Instead, cues paired with previous omission of food activated both divisions of CeA, as did cues for shock. Although it is tempting to suggest that lCeA serves as a late, common path for aversive processing, regardless of its origins (shock or food omission), the lack of any overlap between neurons responsive to shock and food-omission cues makes such a claim premature. It would be especially interesting to ascertain both the projection targets of neurons activated by the two types of cues and to determine their phenotypes (e.g., on or off neurons in lCeA, as described by Ciocchi et al., 2010).
Multiple consequences of unexpected omission of food
Recent studies have shown that neurons in CeA respond to the unexpected omission of food. For example, Calu et al. (2010) found neurons in CeA that fired more to the omission (or delay) of an anticipated food delivery than to the delivery of that food. Similarly, Lee et al. (2010) identified a subpopulation of mCeA neurons that projected to the substantia nigra pars compacta, which exhibited more FOS expression after presentations of food cues in the absence of their usual food reinforcers than after presentations of normal cue–food pairings. Thus, CeA neurons appear to encode negative reward prediction error, reflecting the omission of an expected reward.
Considerable evidence indicates that the unexpected omission of food can have multiple consequences. First, the resultant negative prediction error can reinforce inhibitory, cue → no-food learning, as described by the Rescorla and Wagner (1972) model. Second, prediction error can also enhance attention to the cues present when food is omitted, which affects the rate at which those cues can participate in new associations (associability), as specified by the Pearce and Hall (1980) model (Holland and Gallagher, 1993a,b; Holland and Maddux, 2010). Third, it can endow accompanying cues with aversive properties, as described in this study. Interestingly, both the second and third of these depend critically on CeA function, but the first, the acquisition of conditioned inhibition, does not (Holland et al., 2001). Thus, CeA is not an essential part of circuitry that governs the formation of associations between cues and food reward but instead appears to use associative information to modulate emotional and attentional processes (Holland and Gallagher, 1999).
Implications for theories of conditioned emotional states
The present study demonstrates a critical role for CeA in the acquisition or expression of the ability of a cue paired with the omission of expected food to serve as a conditioned punisher. Both intact and sham-lesioned rats learned to reduce pulling of a chain that yielded presentations of the food-omission cue compared with pulling of another chain that had no consequences. Notably, this conditioned punishment effect was observed despite other influences that might have discouraged that outcome. For example, inhibitory associations between the food-omission cue and food (Holland, 1980) might nonselectively inhibit all food-based instrumental responses (Dickinson and Dearing, 1979). Furthermore, other studies have shown that conditioned stimuli or responses are “protected” from extinction when they are accompanied by a conditioned inhibitor during extinction training (Rescorla, 2003). Such an effect would encourage greater persistence of responding to the chain that yielded food-omission cue presentations compared with the noncontingent chain, the opposite of what we observed. Thus, we believe our test data show that the food-omission cue acquired aversive properties.
Nevertheless, the nature of that aversiveness remains unclear. Although the food-omission cue clearly functioned as a conditioned punisher, it did not control broadly acting conditioned suppression (as did the shock cue), and casual observation of video tapes of the test sessions of experiment 2 showed no obvious frustration or other responses elicited by presentation of the food-omission cue. Despite the frequent implication of the amygdala in the consequences of “frustrative nonreward” (Amsel, 1958; Kemble and Beckman, 1970), it is notable that these are typically increases in the rate or vigor of responding, not decreases, as observed in our conditioned punishment test.
Rules for the production and interaction of various learned emotional states with each other and with behavior have often been described within psychological learning theory (Estes and Skinner, 1941; Mowrer, 1947; Rescorla and Solomon, 1967). For example, Mowrer (1960) described the acquisition of hope or disappointment and fear or relief to stimuli paired with the presentation or termination/omission of positive and negative reinforcers, respectively, and suggested motivational commonalities between states of similar valence (e.g., fear and disappointment, or more operationally, signals for shock and signals for omission of food), regardless of their origin. Such claims are supported by demonstrations that cues paired with the termination of shock not only inhibit aversively motivated behavior but also can serve as positive reinforcers (Lolordo, 1969) and that cues for food omission can serve as conditioned punishers, as noted here. Although the present results suggest that, as widely believed, correlates of these varied emotional states may be found in CeA, their representations remain distinct even at this level of processing. Progress toward understanding their relations will likely depend on delineation of circuit functions in particular behavioral systems rather than on broad assertions of their functional equivalence.
Footnotes
This research was supported in part by National Institutes of Health Grant MH53667.
References
- Amsel A. The role of frustrative nonreward in noncontinuous reward situations. Psychol Bull. 1958;55:102–119. doi: 10.1037/h0043125. [DOI] [PubMed] [Google Scholar]
- Balleine BW. Neural bases of food-seeking: affect, arousal and rewards in corticostraitolimbic circuits. Physiol Behav. 2005;86:717–730. doi: 10.1016/j.physbeh.2005.08.061. [DOI] [PubMed] [Google Scholar]
- Berridge KC. Reward learning: reinforcement, incentives, and expectations. Psychol Learn Motiv. 2001;40:223–278. [Google Scholar]
- Bolles RC. Reinforcement, expectancy, and learning. Psychol Rev. 1972;79:394–409. [Google Scholar]
- Bottai D, Guzowski JF, Schwarz MK, Kang SH, Xiao B, Lanahan A, Worley PF, Seeburg PH. Synaptic activity-induced conversion of intronic to exonic sequence in Homer 1 immediate early gene expression. J Neurosci. 2002;22:167–175. doi: 10.1523/JNEUROSCI.22-01-00167.2002. [DOI] [PMC free article] [PubMed] [Google Scholar]
- Calu DJ, Roesch MR, Haney RZ, Holland PC, Schoenbaum G. Neural correlates of variations in event processing during learning in central nucleus of amygdala. Neuron. 2010;68:991–1001. doi: 10.1016/j.neuron.2010.11.019. [DOI] [PMC free article] [PubMed] [Google Scholar]
- Choi JS, Cain CK, LeDoux JE. The role of amygdala nuclei in the expression of auditory signaled two-way active avoidance in rats. Learn Mem. 2010;17:139–147. doi: 10.1101/lm.1676610. [DOI] [PMC free article] [PubMed] [Google Scholar]
- Ciocchi S, Herry C, Grenier F, Wolff SB, Letzkus JJ, Vlachos I, Ehrlich I, Sprengel R, Deisseroth K, Stadler MB, Müller C, Lüthi A. Encoding of conditioned fear in central amygdala inhibitory circuits. Nature. 2010;468:277–282. doi: 10.1038/nature09559. [DOI] [PubMed] [Google Scholar]
- Corbit LH, Balleine BW. The general and outcome-specific forms of Pavlovian-instrumental transfer are differentially mediated by the nucleus accumbens core and shell. J Neurosci. 2005;25:962–970. doi: 10.1523/JNEUROSCI.2711-11.2011. [DOI] [PMC free article] [PubMed] [Google Scholar]
- Corbit LH, Balleine BW. Double dissociation of basolateral and central amygdala lesions on the general and outcome-specific forms of Pavlovian-instrumental transfer. J Neurosci. 2011;31:11786–11794. doi: 10.1523/JNEUROSCI.4507-04.2005. [DOI] [PMC free article] [PubMed] [Google Scholar]
- Davis M. The role of the amygdala in conditioned and unconditioned fear and anxiety. In: Aggleton JP, editor. The amygdala: a functional analysis. Oxford: Oxford UP; 2000. pp. 213–287. [Google Scholar]
- Dickinson A, Dearing MF. Appetitive aversive interactions and inhibitory processes. In: Dickinson A, Boakes RA, editors. Mechanisms of learning and motivation. Hillsdale, NJ: Erlbaum; 1979. pp. 203–231. [Google Scholar]
- Estes KW, Skinner BF. Some quantitative properties of anxiety. J Exp Psychol. 1941;29:390–400. [Google Scholar]
- Gewirtz JC, Davis M. Second-order fear conditioning prevented by blocking NMDA receptors in amygdala. Nature. 1997;388:471–474. doi: 10.1038/41325. [DOI] [PubMed] [Google Scholar]
- Hatfield T, Han JS, Conley M, Gallagher M, Holland P. Neurotoxic lesions of basolateral, but not central amygdala interfere with Pavlovian second-order conditioning and reinforcer-devaluation effects. J Neurosci. 1996;16:5256–5265. doi: 10.1523/JNEUROSCI.16-16-05256.1996. [DOI] [PMC free article] [PubMed] [Google Scholar]
- Haubensak W, Kunwar PS, Cai H, Ciocchi S, Wall NR, Ponnusamy R, Biag J, Dong HW, Deisseroth K, Callaway EM, Fanselow MS, Lüthi A, Anderson DJ. Genetic dissection of an amygdala microcircuit that gates conditioned fear. Nature. 2010;468:270–276. doi: 10.1038/nature09553. [DOI] [PMC free article] [PubMed] [Google Scholar]
- Holland PC. Second-order conditioning with and without unconditioned stimulus presentation. J Exp Psychol Anim Behav Proc. 1980;6:238–250. doi: 10.1037//0097-7403.6.3.238. [DOI] [PubMed] [Google Scholar]
- Holland PC, Gallagher M. Amygdala central nucleus lesions disrupt increments, but not decrements, in conditioned stimulus processing. Behav Neurosci. 1993a;107:246–253. doi: 10.1037//0735-7044.107.2.246. [DOI] [PubMed] [Google Scholar]
- Holland PC, Gallagher M. Effects of amygdala central nucleus lesions on blocking and unblocking. Behav Neurosci. 1993b;107:235–245. doi: 10.1037//0735-7044.107.2.235. [DOI] [PubMed] [Google Scholar]
- Holland PC, Gallagher M. Amygdala circuitry in attentional and representational processes. Trends Cogn Sci. 1999;3:65–73. doi: 10.1016/s1364-6613(98)01271-6. [DOI] [PubMed] [Google Scholar]
- Holland PC, Maddux JM. Brain systems of attention in associative learning. In: Mitchell CJ, LePelley ME, editors. Attention and learning. Oxford: Oxford UP; 2010. pp. 305–349. [Google Scholar]
- Holland PC, Chik Y, Zhang Q. Inhibitory learning tests of conditioned stimulus associability in rats with lesions of the amygdala central nucleus. Behav Neurosci. 2001;115:1154–1158. [PubMed] [Google Scholar]
- Kemble ED, Beckman GJ. Runway performance of rats following amygdaloid lesions. Physiol Behav. 1970;5:45–47. doi: 10.1016/0031-9384(70)90011-9. [DOI] [PubMed] [Google Scholar]
- Killcross S, Robbins TW, Everitt BJ. Different types of fear conditioned behavior mediated by separate nuclei within amygdala. Nature. 1997;388:377–380. doi: 10.1038/41097. [DOI] [PubMed] [Google Scholar]
- Koo JW, Han JS, Kim JJ. Selective neurotoxic lesions of basolateral and central nuclei of the amygdala produce differential effects on fear conditioning. J Neurosci. 2004;24:7654–7662. doi: 10.1523/JNEUROSCI.1644-04.2004. [DOI] [PMC free article] [PubMed] [Google Scholar]
- LeDoux J. The emotional brain, fear, and the amygdala. Cell Mol Neurobiol. 2003;23:727–738. doi: 10.1023/A:1025048802629. [DOI] [PMC free article] [PubMed] [Google Scholar]
- Lee HJ, Groshek F, Petrovich GD, Cantalini JP, Gallagher M, Holland PC. Role of amygdalo-nigral circuitry in conditioning of a visual stimulus paired with food. J Neurosci. 2005;25:3881–3888. doi: 10.1523/JNEUROSCI.0416-05.2005. [DOI] [PMC free article] [PubMed] [Google Scholar]
- Lee HJ, Gallagher M, Holland PC. The central amygdala projection to the substantia nigra reflects prediction error information in appetitive conditioning. Learn Mem. 2010;17:531–538. doi: 10.1101/lm.1889510. [DOI] [PMC free article] [PubMed] [Google Scholar]
- Lee JL, Dickinson A, Everitt BJ. Conditioned suppression and freezing as measures of aversive Pavlovian conditioning: effects of discrete amygdala lesions and overtraining. Behav Brain Res. 2005;159:221–233. doi: 10.1016/j.bbr.2004.11.003. [DOI] [PubMed] [Google Scholar]
- Lolordo VM. Positive conditioned reinforcement from aversive situations. Psychol Bull. 1969;72:193–203. doi: 10.1037/h0027907. [DOI] [PubMed] [Google Scholar]
- Lyford GL, Yamagata K, Kaufmann WE, Barnes CA, Sanders LK, Copeland NG, Gilbert DJ, Jenkins NA, Lanahan AA, Worley PF. Arc, a growth factor and activity-regulated gene, encodes a novel cytoskeleton-associated protein that is enriched in neuronal dendrites. Neuron. 1995;14:433–445. doi: 10.1016/0896-6273(95)90299-6. [DOI] [PubMed] [Google Scholar]
- Mahler SV, Berridge KC. Which cue to “want?” Central amygdala opioid activation enhances and focuses incentive salience on a prepotent reward cue. J Neurosci. 2009;29:6500–6513. doi: 10.1523/JNEUROSCI.3875-08.2009. [DOI] [PMC free article] [PubMed] [Google Scholar]
- McDannald MA. Contributions of the amygdala central nucleus and ventrolateral periaqueductal grey to freezing and instrumental suppression in Pavlovian fear conditioning. Behav Brain Res. 2010;211:111–117. doi: 10.1016/j.bbr.2010.03.020. [DOI] [PMC free article] [PubMed] [Google Scholar]
- Mowrer OH. On the dual nature of learning: a reinterpretation of conditioning and problem solving. Harv Educ Rev. 1947;17:102–148. [Google Scholar]
- Mowrer OH. Learning theory and behavior. New York: Wiley; 1960. [Google Scholar]
- Pearce JM, Hall G. A model for Pavlovian learning: variations in the effectiveness of conditioned but not of unconditioned stimuli. Psychol Rev. 1980;106:532–552. [PubMed] [Google Scholar]
- Petrovich GD, Holland PC, Gallagher M. Amygdalar and prefrontal pathways to the lateral hypothalamus are activated by a learned cue that stimulates eating. J Neurosci. 2005;25:8295–8302. doi: 10.1523/JNEUROSCI.2480-05.2005. [DOI] [PMC free article] [PubMed] [Google Scholar]
- Petrovich GD, Ross CA, Mody P, Holland PC, Gallagher M. Central, but not basolateral amygdala, is critical for control of feeding by aversive learned cues. J Neurosci. 2009;29:15205–15212. doi: 10.1523/JNEUROSCI.3656-09.2009. [DOI] [PMC free article] [PubMed] [Google Scholar]
- Rescorla RA. Protection from extinction. Learn Behav. 2003;31:124–132. doi: 10.3758/bf03195975. [DOI] [PubMed] [Google Scholar]
- Rescorla RA, Solomon RL. Two process learning theory: relationships between classical conditioning and instrumental learning. Psychol Rev. 1967;74:151–182. doi: 10.1037/h0024475. [DOI] [PubMed] [Google Scholar]
- Rescorla RA, Wagner AR. A theory of Pavlovian conditioning: variations in the effectiveness of reinforcement and nonreinforcement. In: Black AH, Prokasy WF, editors. Classical conditioning II. New York: Appleton Century Crofts; 1972. pp. 64–99. [Google Scholar]
- Saddoris MP, Holland PC, Gallagher M. Associatively-learned representations of taste outcomes activate taste-encoding neural ensembles in gustatory cortex. J Neurosci. 2009;29:15386–15396. doi: 10.1523/JNEUROSCI.3233-09.2009. [DOI] [PMC free article] [PubMed] [Google Scholar]
- Swanson LW. Brain maps: Computer graphics files. Amsterdam: Elsevier; 1998. [Google Scholar]
- Vazdarjanova A, Guzowski JF. Differences in hippocampal neuronal population responses to modifications of an environmental context: evidence for distinct, yet complementary, functions of CA3 and CA1 ensembles. J Neurosci. 2004;24:6489–6496. doi: 10.1523/JNEUROSCI.0350-04.2004. [DOI] [PMC free article] [PubMed] [Google Scholar]