

Abstract
Background and Aims
Survival of patients with hepatocellular carcinoma (HCC) is determined by the extent of the tumor and the underlying liver function. We aimed to develop a survival model for HCC based on objective parameters including the Model for End stage Liver Disease (MELD) as a gauge of liver dysfunction.
Methods
This analysis is based on 477 patients with HCC seen at Mayo Clinic Rochester between 1994 and 2008 (derivation cohort) and 904 patients at the Korean National Cancer Center between 2000 and 2003 (validation cohort). Multivariable proportional hazards models and corresponding risk score were created based on baseline demographic, clinical, and tumor characteristics. Internal and external validation of the model was performed. Discrimination and calibration of this new model were compared against existing models including Barcelona Clinic Liver Cancer (BCLC), Cancer of the Liver Italian Program (CLIP), and Japan Integrated Staging (JIS) scores.
Results
The majority of the patients had viral hepatitis as the underlying liver disease (100% in the derivation cohort and 85% in the validation cohort). The survival model incorporated MELD, age, number of tumor nodules, size of the largest nodule, vascular invasion, metastasis, serum albumin, and alpha-fetoprotein. In cross validation, the coefficients remained largely unchanged between iterations. Observed survival in the validation cohort matched closely with what was predicted by the model. The c-statistic for this model (0.77) was superior to that for BCLC (0.71), CLIP (0.70), or JIS (0.70). The score was able to further classify patient survival within each stage of the BCLC classification.
Conclusions
A new model to predict survival of HCC patients based on objective parameters provides refined prognostication and supplements the BCLC classification.
Keywords: liver cancer, BCLC, staging
Introduction
Liver cancer is a common yet lethal malignancy globally, claiming nearly 700,000 lives as of 2008. It is the third leading cause of cancer deaths in the world1. In the U.S., the incidence of HCC, has been reported to have tripled over the past three decades2 and, because of the poor survival of these patients, mortality associated with HCC also rose in parallel with the incidence3.
HCC is unique in that survival of patients is determined not only by the extent of the tumor, but also by the severity of underlying liver dysfunction. In addressing interrelationship of prognostic factors in HCC, there have been at least seven staging systems developed for HCC. These include the Barcelona Clinic Liver Cancer system (BCLC)4, Cancer of the Liver Italian Program score (CLIP)5, 6, Japan Integrated Staging score (JIS)7, the American Joint Committee on Cancer, Tumor, node, metastasis (AJCC TNM)8, Okuda9, Chinese University Prognostic Index (CUPI)10, and Groupe d'Etude et de Traitement du Carcinome Hepatocellulaire Prognostic classification (GETCH)11. Most of these systems include some measures of the tumor extent and abnormal physiology associated with liver disease. The BCLC staging system has been endorsed by The American Association for the Study of Liver Disease (AASLD) and The European Association for the Study of the Liver (EASL) as a standard staging system in HCC. However, drawbacks of the BCLC system include the use of subjective components particularly performance status and the Child-Turcott-Pugh score and a wide range of patients' prognosis within a given category.
The overall aim of this study was to develop and validate a multivariable survival model for patients with HCC so as to produce prognostic information that may be standardized. Specifically, the model was designed to (1) utilize predictors that are consistently reproducible and (2) provide estimates of survival in a clinically meaningful time frame. We a priori planned to incorporate the Model for End-Stage Liver Disease (MELD) as a gauge of liver disease severity. MELD has been shown to be a useful measure of hepatic insufficiency since it was adopted as a standard to determine organ allocation priorities among liver transplant candidates in the US and elsewhere12.13 One of the appeals of MELD is that it consists only of laboratory variables that are widely available and reproducible, consistent with the goal of the work.
Material and Methods
Patients
This analysis incorporates two sets of data such that a survival model was derived from the first data set and then applied to the second set to examine its validity. The first data set, used to derive the survival model, consisted of HCC patients at Mayo Clinic Rochester (‘derivation cohort’ henceforth). This was derived from a prospective database tracking HCC cases at Mayo Clinic Rochester. When the database was started in the early 1990s, the scope of the database was limited to HCCs from a viral etiology (chronic hepatitis B virus (HBV) or hepatitis C virus (HCV) infection). While cases from other etiologies have sporadically been added since, the database captured all patients with chronic viral hepatitis. These patients enrolled in the database between January 1994 and December 2008 were included in the analysis. HBV infection was ascertained by positive serum HBsAg, whereas HCV infection was defined by 1) detectable HCV RNA or 2) positive anti-HCV with a documented history of chronic liver disease.
Patient demographic information, HCC etiology, performance status, laboratory data at the initial assessment of HCC were extracted from medical records. Principally, the AASLD guideline was used to define HCC14. Thus, of the 477 patients represented in the data, a majority (n=323) was diagnosed by histology, whereas the radiographic criteria were met in 108 upon review by a single radiologist (BHK). In addition, we included 46 patients that had lesions with compatible cross-sectional and angiographic imaging characteristics and underwent transarterial chemoembolization (TACE) or transarterial radioembolization (TARE)15.
The second data set (‘validation cohort’ henceforth) was obtained in 904 patients diagnosed with HCC between November 2000 and December 2003 at the Center for Liver Cancer at National Cancer Center in Goyang, South Korea16. The diagnosis of HCC was made following a previously published local guideline, based upon histology and/or clinical evidence such as radiographic characteristics, serum alpha fetoprotein (AFP) levels and the presence of risk factors.17: HCC was diagnosed in the absence of histological evidence, if risk factors for HCC (i.e., chronic viral hepatitis or cirrhosis) was present and (1) AFP was greater than 400ng/mL and radiographic appearance characteristic of HCC in at least one of three modalities (multiphasic CT, MRI, or angiography) was present or (2) AFP was less than 400ng/mL but characteristic appearance in at least two modalities was present. The study was approved by the Institutional Review Board of Mayo Foundation and the Ethics Committee of the Korean National Cancer Center.
Data Collection and Analysis
The HCC lesions were characterized by cross-sectional radiographic characteristics, which included (1) the number of tumor nodules, (2) the diameter of the largest nodule and (3) vascular invasion (enhancing vascular tumor thrombi), and (4) extra-hepatic metastasis. Based on these radiographic information and laboratory data at entry into the study, individual patients were staged according to the BCLC, the CLIP score and the JIS score. The original MELD score (before modification for the purpose of organ allocation) was calculated as published previously.18
For survival analysis, patients were followed from the first visit date for HCC assessment forward until July 22, 2010 and September 1, 2004 in the derivation and validation cohorts, respectively. To ascertain complete capture of all decedents, a proprietary information source (Accurint ®) was used to supplement information in the medical records in the derivation cohort and the National Cancer Registry data in the validation cohort. Death from any causes was considered as an event in this analysis. In the base-case analysis, liver transplantation was not considered an event, whereas a subsequent sensitivity analysis was conducted censoring liver transplantation.
Patient survival probability was estimated using the Kaplan-Meier method. The main tool for survival analysis was the proportional hazards model. Based on variables with univariate significance (p<0.10) and clinical relevance, multivariable models were created. The output of the model was expressed as coefficients, which were used to compute hazard ratios. In addition, the coefficients were used to calculate a risk score, which, in turn, was used to predict survival.
In the derivation cohort, cross validation was used to examine the reproducibility of the survival model. The data was randomly divided into four equal subsets and the coefficients were recalculated after removing one subset of the data at a time. The concordance (c)-statistic was computed using the new coefficients in the remainder of the data. The c-statistic from each of the four subsets was compared to one another.
In testing the accuracy of the model prediction in the validation cohort, patients were divided into three groups at the 25th and 75th percentiles of the risk score. The observed survival in the validation cohort was compared with survival estimated by the survival model. The goodness of fit of the models was assessed using the c-statistics.
Results
Model Derivation Cohort
Table 1 summarizes characteristics of the subjects in the derivation cohort (n=477). The median age of the cohort was 56 years and the majority were male. As expected, HCV was the predominant etiology of liver disease in this US cohort. Most patients (88%) had evidence of cirrhosis. The median MELD score was 9.2 and most patients had normal performance status and were ambulatory. A majority of patients had a single lesion with a wide range in the size of the tumors with half of the patients meeting the so-called Milan criteria. Vascular invasion or extrahepatic spread was relatively infrequent. Curative therapy was employed including resection in 17% (n=71) and liver transplantation in 31% (n=133). Local ablation was used in 9% (n=37), transarterial therapy in 25% (n=106) and systemic chemotherapy in 5% (n=22). In 56 patients (13%), only comfort care was possible. In patients who underwent liver transplantation, their median MELD score were 9 (interquartile range [IQR] =7 - 13). As expected, nearly all (88%) were within the Milan criteria. The median follow up was 23 months and 295 (62%) died during the follow-up.
Table 1. Description of the derivation cohort (Mayo Clinic patients, n=477).
| Patient Characteristics | Tumor Characteristics | ||
|---|---|---|---|
| Age | 56 [51-67] | Size of the largest nodule | |
| Male | 372 (78%) | <=1cm | 14 (3%) |
| Family history of HCC | 16 (4%) | 1-2cm | 82 (18%) |
| Etiology | 2-3cm | 109 (24%) | |
| HBV | 84 (18%) | 3-5cm | 122 (26%) |
| HCV | 384 (81%) | 5-10cm | 104 (23%) |
| HBV+HCV | 6 (1%) | 10-15cm | 21 (5%) |
| Platelet | 110 [70-165] | 15-20cm | 9 (2%) |
| Bilirubin | 1.4 [0.9-2.4] | >20cm | 0 (0%) |
| INR | 1.1 [1.0-1.3] | Number of nodules | |
| Creatinine | 1.0 [0.9-1.2] | 1 | 249 (53%) |
| Albumin | 3.4 [2.9-3.8] | 2 | 81 (17%) |
| MELD | 9.2 [6.5-12.7]* | 3 | 43 (9%) |
| CTP | 7 [7-9] | 4 | 29 (6%) |
| Cirrhosis | 420 (88%) | >=5 | 72 (15%) |
| Performance status | Alpha fetoprotein (ng/ml) | 47.9 [8.8-588.0] | |
| 0 | 70% | Vascular invasion | 103 (22%) |
| 1 | 26% | Distant metastasis | 32 (7%) |
| ≥2 | 4% | Within Milan criteria | 238 (50%) |
| Treatment | |||
| Transplantation | 133 (31%) | ||
| Resection | 71 (17%) | ||
| Local ablation | 37 (9%) | ||
| TACE/TARE | 106 (25%) | ||
| Chemotherapy | 22 (5%) | ||
| Comfort care | 56 (13%) |
number (proportion) or median [interquartile range] are shown.
TACE: Transarterial chemoembolization, TARE: Transarterial radioembolization
The MELD score was calculated according to the original formula without rounding or lower and upper bounds in the variables and the final score.18
Predictor of Survival and Risk Score Model
The univariate Cox proportional hazards analysis was performed in the derivation cohort (Table 2a). All of the data elements that represent liver disease severity and tumor extent were significantly associated with risk of mortality, whereas age had a marginal effect. Family history and liver disease etiology (HBV or HCV) had no apparent impact on survival. When variables with univariate significance were considered in a multivariable model, age, MELD, serum albumin and the four radiographic variables that reflect the tumor extent (the size of the largest tumor nodule, the number of nodules, vascular invasion and metastasis) as well as AFP were selected as independent predictors of survival. Figure 1 illustrates the relation between MELD and risk of death after adjusting for other variables in the multivariable model. There was little change in mortality risk with low MELD scores. The risk started to increase demonstrably at a score of 13, beyond which a one-point increase in the MELD score was associated with a 10% rise in mortality in a largely linear fashion. For this reason, we instituted a lower bound of MELD score at 13 in the development of the survival model. Results of similar analysis on age, albumin, serum AFP, tumor size, and tumor numbers are illustrated in Supplementary Figure 2-6.
Table 2. Prediction model for survival.
| Table 2a Univariate and multivariable analyses (derivation cohort) | ||||
|---|---|---|---|---|
| Univariate | Multivariate | |||
| Variable | Hazard Ratio | P value | Hazard Ratio | P value |
| Age (in decades) | 1.108 (0.997, 1.230) | 0.06 | 1.262 (1.128, 1.412) | <0.01 |
| Gender | 1.207 (0.912, 1.598) | 0.18 | ||
| Family History of HCC | 0.916 (0.501, 1.676) | 0.77 | ||
| HBV | 0.906 (0.653, 1.256) | 0.55 | ||
| HCV | 1.028 (0.750, 1.408) | 0.86 | ||
| CTP score | 1.237 (1.142, 1.339) | <0.01 | ||
| MELD† | 1.121 (1.097, 1.146) | <0.01 | 1.104 (1.064, 1.147) | <0.01 |
| Bilirubin | 1.112 (1.086, 1.138) | <0.01 | ||
| Creatinine | 1.408 (1.202, 1.650) | <0.01 | ||
| INR | 2.059 (1.586, 2.672) | <0.01 | ||
| Albumin | 0.733 (0.607, 0.885) | <0.01 | 0.676 (0.538, 0.851) | <0.01 |
| Platelets in units of 50 | 1.141 (1.071, 1.215) | <0.01 | ||
| No. Nodule†† | 1.325 (1.225, 1.433) | <0.01 | 1.166 (1.062, 1.280) | <0.01 |
| Size††† | 1.622 (1.468, 1.792) | <0.01 | 1.336 (1.182, 1.511) | <0.01 |
| AFP†††† | 1.221 (1.166, 1.279) | <0.01 | 1.086 (1.028, 1.146) | <0.01 |
| Extrahepatic Metastasis | 5.287 (3.523, 7.936) | <0.01 | 3.095 (1.865, 5.137) | <0.01 |
| Vascular invasion | 5.728 (4.376, 7.498) | <0.01 | 3.070 (2.177, 4.328) | <0.01 |
| Table 2b. Calculation of the MESIAH score |
|---|
|
|
| MESIAH Score = 0.232 * (Age in Decades) |
| + 0.099 * (MELD†) |
| - 0.391 * (Albumin) |
| + 0.290 * (Tumor size†††) |
| + 0.153 * (Tumor number††) |
| + 1.122 * (Vascular invasion) |
| + 1.130 * (Metastasis) |
| + 0.082 * (AFP††††) + 1 |
|
|
| † MELD scores =< 13 set to 13†† Number of nodules: 1=1, 2=2, 3=3, 4=4, 5=5 or greater |
| ††† Size of the largest nodule: 1=<=1cm, 2=1-2, 3=2-3, 4=3-5, 5=5-10, 6=10-15, 7=15-20, 8=>20 |
| †††† ln(AFP) with AFP capped at 10,000 units |
| Table 2c. Calculation of probability of survival according to the MESIAH score | |||||||
|---|---|---|---|---|---|---|---|
| Month | 1 | 3 | 6 | 12 | 24 | 36 | |
| S0(t) | 98.0 | 95.2 | 88.5 | 77.6 | 62.1 | 52.8 | |
S0(t) gives the estimated survival probabilities for a patient with a risk score of 4.13, which is the median risk score of the patients in the derivation cohort. To calculate the probability of survival at t months of a given patient, use the following equation: S(t)=S0(t)exp(MESIAH-4.13)
Figure 1. Impact of MELD on the 3 year mortality prediction after adjusting for other risk score variables.
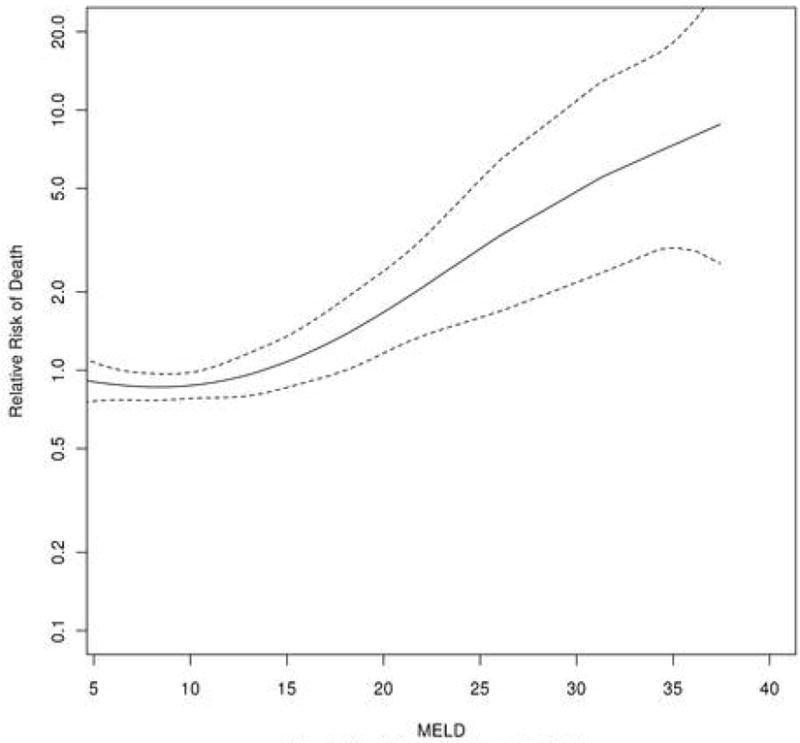
MELD=10*(0.957*log(creatinine) + 1.12*log(INR) + 0.378*log(total bilirubin) + 0.643)
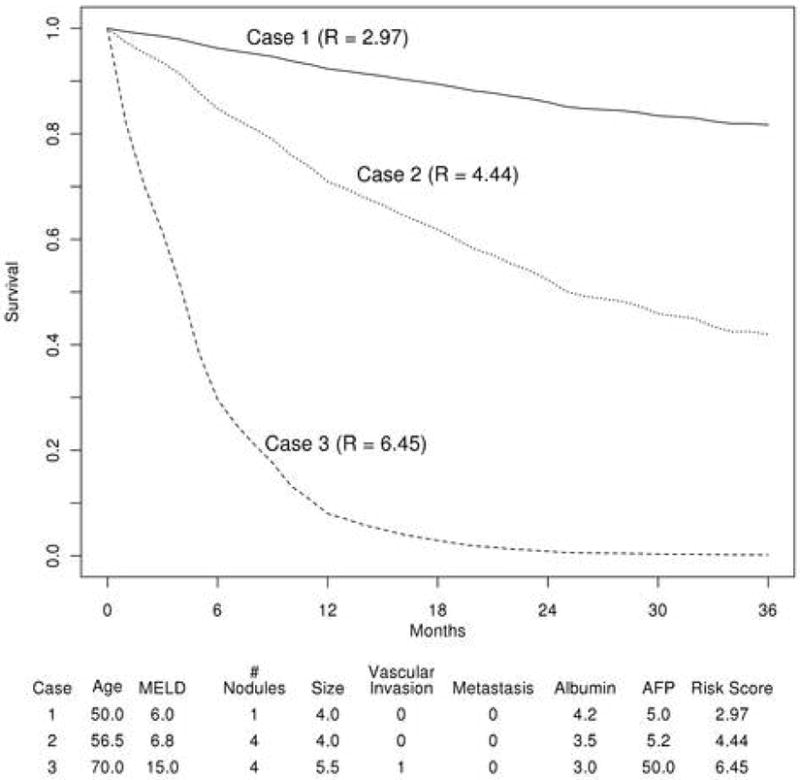
Based on the multivariable model, a risk score (MESIAH; Model to Estimate Survival in Ambulatory HCC patients score, MESIAH henceforth) can be calculated using the formula shown in Table 2b. Further, Table 2c illustrates expected survival for patients with the median MESIAH score in the derivation cohort. Application of the risk score in individual patients allows calculation of expected survival. For example, the one- and three-year survival probability in patients in the lowest quartile (MESIAH score<3.62), was 85.8%, 68.1%, respectively. In the highest quartile (MESIAH score>5.05), survival decreased to 52.9% and 20.1% at one and three years, respectively. Further example of the application of the model is provided in Figure 2.
Figure 2. Expected survival of three hypothetical patients.
Internal Validation of Risk Score
The c-statistics of the MESIAH model for the derivation cohort was 0.77 (95% confidence interval [CI]= 0.74-0.80), whose interpretation is as follows. If two patients from the cohort are randomly selected, 77% of the time, the score is able to identify correctly which one of the pair will survival longer. For the internal validation, patients in the derivation cohort were randomly divided into four groups and the coefficients were recalculated after removing a quarter of patients in the derivation cohort. The coefficients remained largely unchanged between iterations, with the average c-statistic of 0.77 (c-statistics of the 4 iterations: 0.73, 0.77, 0.76, and 0.81). As the MELD score was derived in patients with end stage liver disease, we tested the performance of the model in subgroups of patients with and without cirrhosis. The c- statistic was 0.77 (95%CI: 0.74-0.81) in patients with cirrhosis and 0.78 (0.70-0.87) in those without, indicating that the model works well in the non-cirrhotic population as well.
External Validation
Table 3 summarizes the characteristics of the subjects in the validation cohort (n=904). In contrast to the derivation cohort, HBV was the most common (75%) in the validation cohort. Accordingly, fewer patients (73%) had evidence of cirrhosis and the MELD scores were lower in the validation cohort than in the derivation cohort. However they tended to have more advanced tumors with only 28% of patients meeting the Milan criteria. TACE was the most common choice of initial treatment (n=518, 57%), followed by resection (n=121, 13%), systemic chemotherapy (n=81, 9%), and ablation (n=17, 2%). In 144 (16%), comfort care only was provided. Liver transplantation was not available for patients in the validation data set. After a median follow up of 15 months, 508 (56%) patients died. The MESIAH score had a high degree of discrimination in the validation cohort with a concordance statistic of 0.82 (95%CI: 0.80-0.83), which was even higher than that in the derivation cohort (median=0.77, Table 4). The calibration of the model prediction was also satisfactory, as illustrated in Figure 3 in which patients in the validation cohort were divided into three groups and their expected survival was found to match closely with observed survival, although the large sample size and number of events resulted in significant p-values for the comparison (p for overall observed vs expected < 0.01; p for Tier 1< 0.01, Tier 2 = 0.50, and Tier 3 < 0.01). The model performed equally well regardless of the underlying etiology (c-statistic for HBV patients =0.81(95%CI: 0.79-0.83), for HCV =0.82 (95%CI: 0.76-0.88), and for non HBV/HCV=0.82 (95%CI: 0.77-0.87).
Table 3. Validation cohort (KNCC patients, n=904).
| MESIAH Variable | Data |
|---|---|
|
| |
| Age | 56 [49-63] |
| MELD | 6.8 [4.2-10.3] |
| Albumin | 3.5 [3.1-3.9] |
| Size of the largest nodule | |
| <=1cm | 9 (1%) |
| 1-2cm | 87 (10%) |
| 2-3cm | 114 (13%) |
| 3-5cm | 230 (25%) |
| 5-10cm | 273 (30%) |
| 10-15cm | 163 (18%) |
| 15-20cm | 25 (3%) |
| >20cm | 2 (0%) |
| Number of nodules | |
|
| |
| 1 | 337(38%) |
|
| |
| 2 | 160 (18%) |
|
| |
| 3 | 68 (8%) |
|
| |
| 4 | 27 (3%) |
|
| |
| >=5 | 305 (34%) |
|
| |
| Vascular invasion | 283 (31%) |
|
| |
| Distant metastasis | 127 (14%) |
|
| |
| Alpha fetoprotein (ng/ml) | 185.1 [15.0-5405.5] |
Table 4. Comparison of MESIAH Score model with other staging systems.
| Models | Derivation Cohort | Validation Cohort |
|---|---|---|
|
| ||
| MESIAH Score | 4.13 (1.92-9.44) | 4.74 (2.46-10.52) |
| c-statistics | 0.77 (0.74, 0.80) | 0.82 (0.80, 0.83) |
|
| ||
| CLIP Score | ||
| 0 | 26 (6%) | 150 (17%) |
| 1 | 141(32%) | 84 (9%) |
| 2 | 140 (32%) | 377 (42%) |
| 3 | 69 (16%) | 118 (13%) |
| 4 | 39 (9%) | 111 (12%) |
| 5 | 15 (3%) | 47 (5%) |
| 6 | 7 (2%) | 11 (1%) |
| c-statistics | 0.70 (0.66, 0.74) | 0.75 (0.73, 0.77) |
|
| ||
| JIS Score | ||
| 0 | 10 (2%) | 52 (6%) |
| 1 | 67 (15%) | 181 (20%) |
| 2 | 148 (33%) | 252 (28%) |
| 3 | 125 (28%) | 272 (30%) |
| 4 | 63 (14%) | 116 (13%) |
| 5 | 30 (7%) | 31 (3%) |
| c-statistics | 0.70 (0.66, 0.73) | 0.78 (0.76, 0.80) |
|
| ||
| BCLC | ||
| O | 8 (2%) | |
| A | 166 (37%) | |
| B | 76 (17%) | |
| C | 129 (29%) | |
| D | 71 (16%) | |
| c-statistics | 0.71 (0.67, 0.74) | |
C-statistic for BCLC staging was not available as performance status information was not available in validation cohort.
The difference in the C- statistics between MESIAH and BCLC (p<0.01), MESIAH and CLIP (p<0.01), MESIAH and JIS scores (p<0.01) were statistically significant. MESIAH, Model to Estimate Survival in Ambulatory HCC patients
BCLC, Barcelona Clinic Liver Cancer
CLIP, Cancer of the Liver Italian Program
JIS, Japan Integrated Staging
Figure 3.
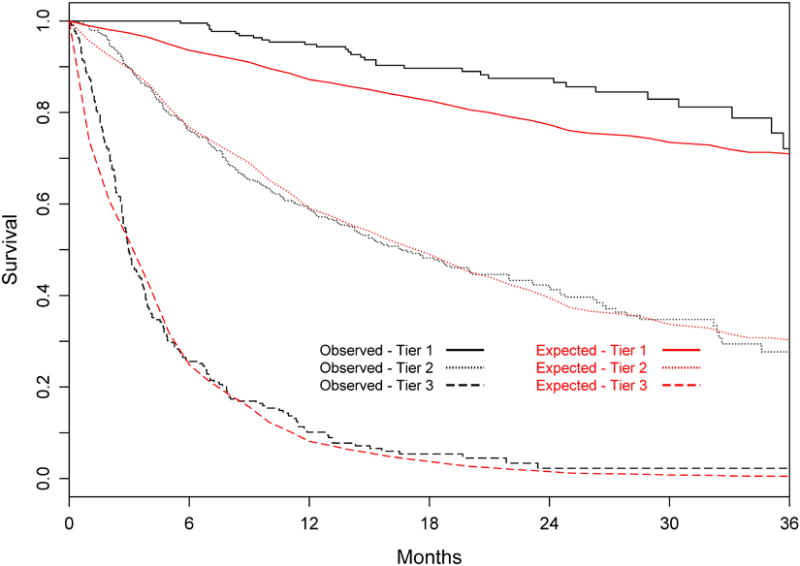
Expected versus observed survival in the validation cohort Patients were divided into three tiers at the 25th and 75th percentiles of the risk score (Tier 1 includes the best 25%, Tier 2 the middle 50%, and Tier 3 the worst 25%).
Comparison with Other Staging Systems
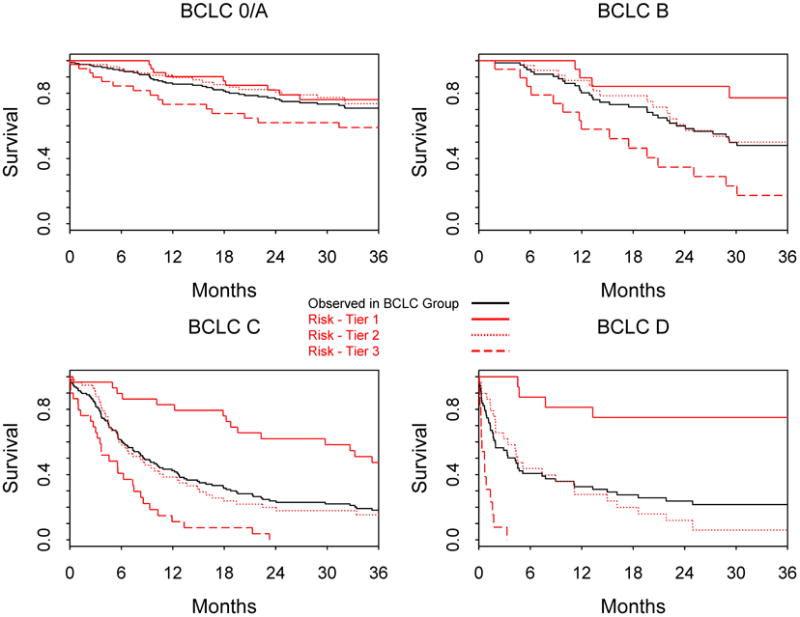
In Table 4, the performance of the MESIAH score is compared to that of BCLC, CLIP, and JIS. These staging systems, however, had lower c-statistics than the MESIAH model in both derivation and validation cohorts. We further investigated whether the MESIAH score can further classify survival of patients within each stratum of the BCLC staging system (Figure 4). Whereas patients in BCLC stage 0 or A did well overall, there was a large degree of variability in survival of patients with BCLC stage B to D. In BCLC stage B, patients in the lowest quartile of the MESIAH score had 77% 3-year survival compared to those in highest quartile with 17% survival. The gap was even wider in BCLC stage C patients, in whom the 3-year survival in the lowest and highest quartiles was 49% and 0% respectively.
Figure 4. Observed survival in MESIAH score tiers within BCLC groups Patients were divided into three tiers at the 25th and 75th percentiles of the risk score within each stratum of the BCLC staging system.
Sensitivity analyses were performed to test the robustness of the MESIAH score. First, we examine the effect of censoring patients at the time of liver transplantation (n=133) as the procedure may fundamentally affect the natural history of HCC. The result, however, was that censoring LTx did not affect the overall performance of the model. The c-statistic in the derivation cohort was 0.79 and validation 0.81, which were again better than other staging systems (Supplementary Table). Second, we repeated the validation analysis excluding non-viral hepatitis patients in the validation cohort. Again, the result did not change materially (data not shown).
Discussion
In general, patient characteristics that determine the prognosis in HCC tend to be more complex than those for other solid tumors, as the vast majority of patients with HCC have underlying liver cirrhosis and the degree of hepatic dysfunction, in addition to the extent of the tumor, affects prognosis. This analysis demonstrates that, the extent of the tumor as represented by variables such as the number and size of the lesions, vascular invasion, and extrahepatic metastasis and the underlying liver function, measured by MELD are important independent predictors of survival in HCC patients Although this is not the first observation that MELD may be useful in prognosticating patients with HCC, 19one of the advantages of the MESIAH score is that it only includes objective, reproducible variables. The value of an objectively quantifiable measure of disease has been appreciated with MELD, which has been rapidly become a common language among physicians globally. Similarly, we believe that the MESIAH score could be applied in retrospective studies or in epidemiologic research where nuanced details of clinical information are unavailable.
We are reassured of the validity of the MESIAH score model as it performed well in our cross-validation as well as in the independent data set of our validation cohort. The c-statistic in the validation cohort was higher than that in the derivation cohort, indicating that it was easier for the score to separate HCC patients according to their prognosis in the former. This is likely attributed to the wider range of the score (and thus survival) with fewer patients receiving treatment that potentially alters the natural history in that cohort. One might consider the dissimilarities between the derivation and validation data sets as a weakness of the study. On the contrary, we submit that our validation using a data set that is racially, geographically, chronologically and diagnostically disparate from the derivation set is a strength, as it demonstrates that the model is applicable (‘portable’) in patients beyond the particular group of patients in which it was derived20. While the derivation cohort was limited to HCC patients with a viral etiology, the model performed well in our validation cohort which included patients with HCC from all causes. This is consistent with the fact that no evidence indicates that the prognosis of patients with HCC associated with chronic viral hepatitis is clinically meaningfully different from that of non-viral patients. Nonetheless, given the large proportion (85%) of patients with viral hepatitis in our validation set, further examination of the MESIAH model in other categories of patients, for example those with HCC associated with NAFLD or alcohol will be appropriate and helpful. In the mean time, to the extent that the majority of HCCs in the world are attributable to HCV or HBV, we believe that the MESIAH model is directly applicable to a large majority of HCC patients today.
Comparison between our model and other existing HCC staging systems highlights the superior performance of the former. We believe that this is partially because our model, being a continuous score, is able to differentiate between patients with a relatively small difference, whereas other categorical systems would lump them together. The BCLC system has been advocated as the most useful of the staging systems currently available 14, 21. A major advantage of BCLC staging system is its ability to guide treatment strategies 4. However, our data show that within the same BCLC category, a wide range in survival experience is seen. In contrast, the MESIAH score can further classify patients with substantially different prognosis, particularly in BCLC B to D patients (Figure 3). Thus, while the BCLC system remains a widely accepted standard on which to base management decisions, the MESIAH score nicely complement the BCLC and other existing models by providing a more finely tuned survival prediction.
Further, in comparison to a number of staging systems for HCC that are currently available, one feature of the MESIAH score that makes it useful in practice is its ability to assign predicted survival probabilities. The computation of this score may be implemented easily using a spreadsheet program, a web-based worksheet or a handheld device. We anticipate such information to be helpful not only in informing the clinician counseling patients but also in estimating the prognosis of HCC patients in epidemiologic research. In that regard, we acknowledge that this analysis includes patients who received several types of treatment and thus may not strictly represent the natural history of HCC. Obvious examples include liver transplantation as well as TACE and molecular targeted therapy which have been shown to improve patient's survival. In order to analyze the magnitude of this concern, we showed in a sensitivity analysis that censoring patients at liver transplantation did not affect the results. Further examination of this issue in patient groups in whom no intervention is applied is certainly desirable, although a pure natural history cohort with all the necessary data is not very likely to be found easily.
Importantly, whether MESIAH may inform treatment decisions remains to be determined. For example, a patient with poor liver function and early stage HCC may have a risk score (and expected survival) similar to that of a patient with preserved liver function and advanced HCC. The optimal therapy, however, would be different for the two patients. As with other decision aids based on mathematical models, our risk score is best thought of as a guide that must be tempered by clinician's acumen and experience. We acknowledge other limitations of the study. First, we had only a small portion of patients (2% in the derivation and 1% in the validation cohorts) with a high MELD score (e.g., >30). This mitigates our confidence with which we can rely on the predicted survival and, thus, further validation of the model in patients with a high MELD score is warranted. The vast majority of our patients had preserved performance status, which is known to be an important prognostic indicators. To what extent our model applies to patients with poor performance remains to be determined. Since HCC patients with poor performance status (i.e., ECOG status 3-4: bed-ridden >50% of the time) have extremely limited survival, the utility of a prediction tailored for those patients is likely limited. Given these limitations, we look forward to further validation of the MESIAH score in other patient cohorts to highlight its complementary role to the BCLC and other staging systems.
In summary, based on large cohorts of patients with HCC, we have developed and validated a survival model for HCC based on readily reproducible predictors. While further studies will strengthen its validity, evidence herein shows that the model outperforms other staging systems such as the BCLC, CLIP, or JIS score. Based on these data, we propose that the MESIAH score is useful in epidemiologic research and in clinical practice for patient counseling and prognostication.
Acknowledgments
Grant support: This study was supported by the National Institutes of Diabetes and Digestive and Kidney Diseases (DK-34238)
Abbreviations
- HCC
hepatocellular carcinoma
- MELD
model for end stage liver disease
- HR
hazard ratio
- MESIAH
model to estimate survival in ambulatory HCC patients
Footnotes
Disclosure: There is no conflict of interest to report.
References
- 1.Yang JD, Roberts LR. Hepatocellular carcinoma: a global view. Nat Rev Gastroenterol Hepatol. 2010;7:448–58. doi: 10.1038/nrgastro.2010.100. [DOI] [PMC free article] [PubMed] [Google Scholar]
- 2.Altekruse SF, McGlynn KA, Reichman ME. Hepatocellular carcinoma incidence, mortality, and survival trends in the United States from 1975 to 2005. J Clin Oncol. 2009;27:1485–91. doi: 10.1200/JCO.2008.20.7753. [DOI] [PMC free article] [PubMed] [Google Scholar]
- 3.Kim WR, Gores GJ, Benson JT, Therneau TM, Melton LJ., 3rd Mortality and hospital utilization for hepatocellular carcinoma in the United States. Gastroenterology. 2005;129:486–93. doi: 10.1016/j.gastro.2005.05.001. [DOI] [PubMed] [Google Scholar]
- 4.Llovet JM, Bru C, Bruix J. Prognosis of hepatocellular carcinoma: the BCLC staging classification. Semin Liver Dis. 1999;19:329–38. doi: 10.1055/s-2007-1007122. [DOI] [PubMed] [Google Scholar]
- 5.A new prognostic system for hepatocellular carcinoma: a retrospective study of 435 patients: the Cancer of the Liver Italian Program (CLIP) investigators. Hepatology. 1998;28:751–5. doi: 10.1002/hep.510280322. [DOI] [PubMed] [Google Scholar]
- 6.Prospective validation of the CLIP score: a new prognostic system for patients with cirrhosis and hepatocellular carcinoma. The Cancer of the Liver Italian Program (CLIP) Investigators. Hepatology. 2000;31:840–5. doi: 10.1053/he.2000.5628. [DOI] [PubMed] [Google Scholar]
- 7.Kudo M, Chung H, Osaki Y. Prognostic staging system for hepatocellular carcinoma (CLIP score): its value and limitations, and a proposal for a new staging system, the Japan Integrated Staging Score (JIS score) J Gastroenterol. 2003;38:207–15. doi: 10.1007/s005350300038. [DOI] [PubMed] [Google Scholar]
- 8.Lei HJ, Chau GY, Lui WY, Tsay SH, King KL, Loong CC, Wu CW. Prognostic value and clinical relevance of the 6th Edition 2002 American Joint Committee on Cancer staging system in patients with resectable hepatocellular carcinoma. J Am Coll Surg. 2006;203:426–35. doi: 10.1016/j.jamcollsurg.2006.06.030. [DOI] [PubMed] [Google Scholar]
- 9.Okuda K, Ohtsuki T, Obata H, Tomimatsu M, Okazaki N, Hasegawa H, Nakajima Y, Ohnishi K. Natural history of hepatocellular carcinoma and prognosis in relation to treatment. Study of 850 patients. Cancer. 1985;56:918–28. doi: 10.1002/1097-0142(19850815)56:4<918::aid-cncr2820560437>3.0.co;2-e. [DOI] [PubMed] [Google Scholar]
- 10.Leung TW, Tang AM, Zee B, Lau WY, Lai PB, Leung KL, Lau JT, Yu SC, Johnson PJ. Construction of the Chinese University Prognostic Index for hepatocellular carcinoma and comparison with the TNM staging system, the Okuda staging system, and the Cancer of the Liver Italian Program staging system: a study based on 926 patients. Cancer. 2002;94:1760–9. doi: 10.1002/cncr.10384. [DOI] [PubMed] [Google Scholar]
- 11.Chevret S, Trinchet JC, Mathieu D, Rached AA, Beaugrand M, Chastang C. A new prognostic classification for predicting survival in patients with hepatocellular carcinoma. Groupe d'Etude et de Traitement du Carcinome Hepatocellulaire. J Hepatol. 1999;31:133–41. doi: 10.1016/s0168-8278(99)80173-1. [DOI] [PubMed] [Google Scholar]
- 12.Kamath PS, Wiesner RH, Malinchoc M, Kremers W, Therneau TM, Kosberg CL, D'Amico G, Dickson ER, Kim WR. A model to predict survival in patients with end-stage liver disease. Hepatology. 2001;33:464–70. doi: 10.1053/jhep.2001.22172. [DOI] [PubMed] [Google Scholar]
- 13.Kamath PS, Kim WR. The model for end-stage liver disease (MELD) Hepatology. 2007;45:797–805. doi: 10.1002/hep.21563. [DOI] [PubMed] [Google Scholar]
- 14.Bruix J, Sherman M. Management of hepatocellular carcinoma. Hepatology. 2005;42:1208–36. doi: 10.1002/hep.20933. [DOI] [PubMed] [Google Scholar]
- 15.Yang JD, Kim WR, Coelho R, Mettler TA, Benson JT, Sanderson SO, Therneau TM, Kim B, Roberts LR. Cirrhosis is Present in Most Patients with Hepatitis B and Hepatocellular Carcinoma. Clinical Gastroenterology and Hepatology. 2011;9:64–70. doi: 10.1016/j.cgh.2010.08.019. [DOI] [PMC free article] [PubMed] [Google Scholar]
- 16.Park KW, Park JW, Choi JI, Kim TH, Kim SH, Park HS, Lee WJ, Park SJ, Hong EK, Kim CM. Survival analysis of 904 patients with hepatocellular carcinoma in a hepatitis B virus-endemic area. J Gastroenterol Hepatol. 2008;23:467–73. doi: 10.1111/j.1440-1746.2007.05112.x. [DOI] [PubMed] [Google Scholar]
- 17.Park JW. Practice guideline for diagnosis and treatment of hepatocellular carcinoma. Korean J Hepatol. 2004;10:88–98. [PubMed] [Google Scholar]
- 18.Wiesner R, Edwards E, Freeman R, Harper A, Kim R, Kamath P, Kremers W, Lake J, Howard T, Merion RM, Wolfe RA, Krom R. Model for end-stage liver disease (MELD) and allocation of donor livers. Gastroenterology. 2003;124:91–6. doi: 10.1053/gast.2003.50016. [DOI] [PubMed] [Google Scholar]
- 19.Marrero JA, Fontana RJ, Barrat A, Askari F, Conjeevaram HS, Su GL, Lok AS. Prognosis of hepatocellular carcinoma: comparison of 7 staging systems in an American cohort. Hepatology. 2005;41:707–16. doi: 10.1002/hep.20636. [DOI] [PubMed] [Google Scholar]
- 20.Justice AC, Covinsky KE, Berlin JA. Assessing the generalizability of prognostic information. Ann Intern Med. 1999;130:515–24. doi: 10.7326/0003-4819-130-6-199903160-00016. [DOI] [PubMed] [Google Scholar]
- 21.Bruix J, Sherman M, Llovet JM, Beaugrand M, Lencioni R, Burroughs AK, Christensen E, Pagliaro L, Colombo M, Rodes J. Clinical management of hepatocellular carcinoma. Conclusions of the Barcelona-2000 EASL conference European Association for the Study of the Liver. J Hepatol. 2001;35:421–30. doi: 10.1016/s0168-8278(01)00130-1. [DOI] [PubMed] [Google Scholar]