

Abstract
AKT3, a member of the serine/threonine kinase AKT family, is involved in a variety of biological processes. AKT3 is expressed in immune cells, and is the major AKT isoform in the CNS representing 30% of the total AKT expressed in spinal cord, and 50% in the brain. Myelin-oligodendrocyte glycoprotein (MOG)-induced experimental autoimmune encephalomyelitis (EAE) is a mouse model in which lymphocytes and monocytes enter the CNS, resulting in inflammation, demyelination, and axonal injury. We hypothesized that during EAE, deletion of AKT3 would negatively impact the CNS of AKT3-/- mice making them more susceptible to CNS damage. During acute EAE, AKT3-/-mice were more severely affected than wildtype (WT) mice. Evaluation of spinal cords showed that during acute and chronic disease, AKT3-/- spinal cords had more demyelination compared to WT spinal cords. Quantitative RT-PCR determined higher levels of IL-2, IL-17, and IFNγ mRNA in spinal cords from AKT3-/- mice than WT. Experiments using bone marrow chimeras demonstrated that AKT3-/- mice receiving AKT3-deficient bone marrow cells had elevated clinical scores relative to control WT mice reconstituted with WT cells, indicating that altered function of both CNS cells and bone marrow-derived immune cells contributed to the phenotype. Immunohistochemical analysis revealed decreased numbers of FoxP3+ Tregs in the spinal cord of AKT3-/- mice compared to WT mice, whereas in vitro suppression assays showed that AKT3-deficient T-helper cells were less susceptible to Treg-mediated suppression than their WT counterparts. These results indicate that AKT3 signaling contributes to the protection of mice against EAE.
Keywords: AKT, myelin-oligodendrocyte glycoprotein, experimental autoimmune encephalomyelitis, inflammation, cytokines, axonal damage, demyelination
INTRODUCTION
AKT or protein kinase B family of serine/threonine protein kinases consists of three isoforms. AKT1-3(PKBα,β,γ) are crucial signaling molecule in the PI3K pathway regulating cell growth, proliferation, survival, and metabolism (1, 2). Single and double knockout mice indicate that the functions of AKT isoforms are not entirely redundant. AKT1-/- mice are smaller in size with a proportional decrease in size in all organs (3-5). Constitutively active AKT1 expressed in oligodendrocytes and oligodendrocyte progenitor cells (OPCs) results in enhanced myelination (6). AKT2-/- animals are insulin intolerant and present with a diabetes-like syndrome (3, 4, 7, 8); the brain size of AKT2 null mice and WT are the same (9). Unlike AKT2 null mice, AKT1-/- mice and AKT3-/- mice maintain normal levels of circulating free-fatty acids indicative of normal lipid metabolism; have normal clearance of circulating sugar, and normal blood glucose levels (8). AKT3 is the most prevalent isoform expressed in brain and plays a role in brain development and neurodegeneration. AKT3-/- mice have a 25% decrease in brain size resulting in fewer and smaller cells but no difference in the general anatomic organization of the brain. The ventricular system is proportionally reduced ruling out a disturbance in the production, circulation and absorption of cerebrospinal fluid as a cause for the observed reduction in AKT3-/- brain size (8, 9).
In the immune system, numerous studies have addressed the role of AKT1 in T cell function. Activation of AKT1 occurs in response to engagement of CD28 and other costimulatory and cytokine receptors to regulate T cell proliferation, glucose uptake, cytokine expression and cell survival (10-14). A transgenic mouse constitutively expressing an activated AKT1 showed that signaling through this kinase results in enhanced Treg-induced differentiation and impaired Th17 responses reducing the severity of MOG-induced EAE (15). During thymocyte development, AKT3 may regulate the double negative to double positive transition however, little information is available on the possible role of AKT3 in the regulation of effector T cell responses (16). We induced EAE in WT and AKT3-/- mice to determine the role of AKT3 in regulating susceptibility to EAE through its role in the CNS and immune system. MOG-induced EAE in C57Bl/6 mice is extensively used to address the impact of autoimmunity and inflammation on spinal cord pathology. Our goal was to test the hypothesis that AKT3-/- mice would a have a more severe disease course than WT mice during EAE since AKT3 is necessary for proper CNS cell integrity and may regulate T cell function (16).
MATERIALS AND METHODS
Mice
AKT3-/- mice (9) were obtained from Dr. Morris Birnbaum (University of PA. School of Medicine). All mice were extensively backcrossed on wildtype (WT) C57Bl6/J mice by the Birbaum and Shafit-Zagardo laboratories, and WT littermates were used as controls. All experiments were performed with male mice, 8 weeks of age. All animal procedures were approved by the Institute of Animal Care Committee at Albert Einstein College of Medicine in complete compliance with the NIH Guide for Care and Use of Laboratory Animals. FoxP3-red fluorescent protein (RFP+) mice in a C57Bl6/J were obtained from Jackson Laboratories Bar Harbor, Maine and crossed with AKT3-/- mice generating FoxP3-RFP+AKT3-/- mice.
MOG-induced EAE: Active Induction of EAE
C57Bl6/J WT control mice, and AKT3-/- mice were immunized with MOG peptide at 8 weeks of age. MOG35-55 (3mg/ml; Peptides International, Cleveland, OH) was emulsified in an equal volume of CFA. CFA was composed of M. tuberculosis (10mg/ml; Difco Laboratories, Detroit, MI) in incomplete Freund's adjuvant (Difco Laboratories). Mice were anaesthetized with isoflurane and 100 μl of emulsion was injected subcutaneously on each flank (200 μl total/mouse) on day 0. In addition, 200 μl of pertussis toxin (2.5 μg/ml; List Biological Laboratories, Campbell, CA) was injected into the tail vein on days 0 and 2. Mice were monitored and graded daily for clinical symptoms of disease as follows: 0, no disease; 1, limp tail; 2, limp tail and hind limb weakness; 3, hind limb paralysis; 4, hind limb and front limb paralysis; 5, moribund.
Spinal cord dissection and tissue preparation
Mice were anaesthetized with ethyl ether (Fisher Scientific, Pittsburgh, PA) and sacrificed by total body perfusion with 4% paraformaldehyde (Fisher Scientific), or 1x PBS, pH 7.3. Spinal cords were removed and dissected into cervical, thoracic, and lumbar regions. Sections were placed in fixative for immunohistochemistry, or sonicated on ice with a tissue master 125 sonicator (Omni International, Marietta, GA) in protein buffer (140 mM sodium chloride, 1 mM Tris/HCl, pH 7.4) containing 0.5% Triton X-100 and protease inhibitors [2 μg/mL leupeptin; 2 mM ethylene glycol-bis(β-aminoethylether)-N,N,N',N'-tetraacetic acid; 4 μg/mL pepstatin; 5 mM sodium pyrophosphate; 30 mM β-glycerophosphate; 30 mM sodium fluoride; 100 mM sodium orthovanadate; 100 mM 4-(2-aminoethyl) benzenesulfonyl fluoride hydrochloride] to yield total protein homogenates. The homogenates were cleared by centrifugation at 4°C at 7000 xg for 10min. Aliquots were frozen at -80°C.
Antibodies, Immunohistochemistry and Stains
Myelin basic protein (MBP) mAb SMI99 (1:1000) and neurofilament mAb SMI32 (1:20,000) was purchased from Covance, Emoryville, CA. Iba1 polyclonal antibody (pAb) (1:600) was purchased from WAKO Chemicals USA, Richmond, VA. CD3 was purchased from DAKO USA, Carpinteria, California. CD45 was purchased from BD Biosciences. FoxP3 clone FJK16s was purchased from eBioscience.
Paraformaldehyde fixed sections were stored overnight at 4°C, transferred to 25% sucrose, and paraffin-embedded and frozen sections were prepared from the paraformaldehyde fixed sections. Seven μM paraffin-embedded sections were incubated with xylenes and descending alcohols, brought to 1× Tris buffered saline pH 7.4 (1× TBS). Antigen retrieved was achieved by boiling the slides for 30 min in 1x TBS in a steamer. Then, all sections were incubated for 30 min with 1× TBS containing 0.25% Triton X-100, followed by a 1 h incubation in 5% goat serum and 5% nonfat dry milk in 1× TBS, and incubated with antibodies diluted in 5% nonfat dry milk in 1× TBS, overnight at 4 °C. Sections were washed 3x in 1x TBS and incubated with secondary antibody followed by incubation with the appropriate Vecta staining kit (Vector Laboratories, Inc.; Burlingame, CA) and visualized by diaminobenzidine (DAB; Sigma). Sections were visualized on a Zeiss Axioskop2 plus microscope with an AxioCam MRC camera, or a Leica Leitz DRMB microscope with an Olympus DP12 camera.
Myelin Black-Gold II stain (Millipore) was performed exactly as detailed by the manufacturer. To directly compare sections from each mouse the fixed, frozen sections (20 μm) were incubated with the myelin black-gold stain for exactly 12 minutes at 60 °C.
Western blot analysis
Total T cell protein homogenates from WT and AKT3-/- mice (40 μg and 80 μg) were loaded in 1x final concentration loading buffer containing 2% SDS, 0.017% bromophenol blue dye, and 0.28M β-mercaptoethanol (load dye), and separated in a 10% SDS-PAGE (17). Following electrophoresis, proteins were transferred to nitrocellulose (18). Blots were incubated with 5% non-fat dry milk and 5% goat serum in 1x TBS for μg 1h at room temperature. After blocking, membranes were incubated with respective primary antibodies followed by horseradish peroxidase-conjugated secondary antibodies. AKT3 monoclonal antibody and secondary antibody were from Cell Signaling. β-actin antibody was from Sigma. Visualization was by enhanced chemiluminescence (GE Healthcare; Piscataway, NJ).
Immunoblot analysis was performed on homogenates of lumbar spinal cord following saline perfusion. The lumbar region of the spinal cord of naïve and chronic EAE mice, at day 40 post-sensitization, was homogenized in buffer (1X PBS, 0.25% TritonX100, containing a cocktail of protease and phosphatase inhibitors) and aliquots were frozen at -80° C. Image J was used to determine the relative density index (RDI) for MAP-2 (1:1000; Sigma)/ β-actin (1:5000, Sigma) for naïve and sensitized mice.
Flow Cytometry
For Treg analysis single cell suspensions from mouse spleen were prepared in PBS, stained with the Blue LIVE/DEAD viability dye (BluVID) (Molecular Probes, Eugene OR), and washed with FACS buffer (PBS + 2% fetal calf serum + 0.05% sodium azide). The cells were then blocked with mouse anti-FcγRII/III (clone 2.4G2) and surface stained with anti-CD3e (FITC clone 145-2C11), anti-CD4 (APC-Cy7 clone RM4-5), and anti-CD25 (biotin clone PC-61) (BD Biosciences), followed by labeling with Streptavidin-Alexa Fluor® 405 (Molecular Probes, Eugene OR). Cells were fixed and permeabilized using the eBioscience FoxP3 staining kit according to the manufacturer's instructions and stained with anti-FoxP3 (Alexa Fluor® 647 clone FJK-16s) (eBioscience). Samples were acquired on an LSR II flow cytometer (BD Biosciences), and analysis was performed using FlowJo software (TreeStar, Inc., Ashland, OR). For the identification of Treg, aggregates were excluded from analysis by gating on cells with equivalent FSC-H/FSC-A profiles, and dead cells were excluded by gating on BluVID negative cells. Tregs were identified by gating on CD4+ T cells that were also positive for CD25 and FoxP3.
Quantitative real-time polymerase chain reaction (qRT-PCR)
Total RNA was prepared from lumbar spinal cord using Qiazol Reagent with a RNeasy kit (Qiagen). RNA was used to synthesize cDNA with oligo-dT primers and the Superscript polymerase (Invitrogen). cDNA was synthesized from total RNA samples, and gene expression was analyzed using SYBR Green in a StepOne Plus thermocycler (Applied Biosystems). qRT-PCR was performed using a SYBR Green qPCR Master (Abgene) and specific primers to amplify a fragment from the following genes: TNFα, IL-6, IL-2, IL-17, IFNγ, β-actin. A threshold was set in the linear part of the amplification curve and the number of cycles needed to reach it determined (Ct). Fold induction was calculated as 2-ΔΔCt, using β-actin as an internal control for normalization. Melting curves were determined from every sample to establish the specificity of the amplified band. Mouse-specific primers for IL-17, IL-2, and IFNγ were as follows: IL-17: forward, 5’-CAGCAGCGATCATCCCTCAAAG; reverse, 5’-CAGGACCAGGATCTCTTGCTG. IL-2: forward, 5'-CCCAAGCAGGCCACAGAATTGAAA; reverse, 5'-TGAGTCAAATCCAGAACATGCCGC. IFNγ: forward, TCAAGTGGCATAGATGTGGAAGAA; reverse: TGGCTCTGCAGGATTTTCATG. Primers for TNFα: forward, CCCTCACACTCAGATCATCTTCT; reverse, GCTACGACGTGGGCTACAG. IL-6: forward, ATGGATGCTACCAAACTGGAT; reverse, TGAAGGACTCTGGCTTTGTCT; β-actin: forward, TGCACCACCAACTGCTTAG; reverse, GGATGCAGGGATGATGTTC; were synthesized through Invitrogen.com (18). Additional control primers included GAPDH and HPRT. GAPDH: forward, CGTCCCGTAGACAAAATGGT; reverse, TTGATGGCAACAATCTCCAC. HPRT: forward, GATTAGCGATGATGAAC; reverse, GAGCAAGTCTTTCAGTCCTGTCCA.
Enzyme-linked immunosorbent assay (ELISA)
Cytokines (IL-2, IL-17 and IFNγ) were measured in supernatants recovered from T cells activated under different conditions by sandwich ELISA. Capture and biotinylated anti-cytokine antibodies were purchased from BD biosciences.
Bone marrow chimeras and Induction of EAE
Bone marrow chimera (BMC) experiments were performed as detailed (17). Four groups of 7 week old irradiated male WT and AKT3-/- mice (920 rads) received 107 bone marrow (BM) cells from 6 week old male mice 24h after irradiation. Mice were housed in quarantine for 6 weeks, at which time the mice were sensitized with human MOG35-55 peptide as above. Mice were monitored for clinical signs of disease. Individual scores were analyzed for group significance using the Bonferroni Multiple Comparison Test. Animals in all groups showed similar numbers of CD4+ and CD8+ T cells and CD4+CD25+FoxP3+ Tregs in spleen and lymph nodes after reconstitution.
Isolation of T cells and suppression assays
CD4+ T cell were isolated from lymph nodes and spleen of naïve or MOG-sensitized mice using anti-CD4 coupled magnetic beads (Invitrogen). To generate Th1 cells, T cells were stimulated with 0.5μg/ml plate bound anti-CD3ε and 0.5μg/ml anti-CD28 (BD) and differentiated for 7 days with IL-12 (10ng/ml) (Cell Sciences), anti-IL-4 (10μg/ml) and recombinant human IL-2 (10U/ml) (NCI BRB Preclinical Repository). To generate Th17 cells, CD4+ T cells were activated with 0.5 μg/ml of plate bound anti-CD3ε and 0.5 μg/ml of anti-CD28 antibodies and differentiated for 5 days with IL-6 (20ng/ml), TGFβ (2.5 ng/ml), IL-23 (10 ng/ml) anti-IFNγ (5 μg/ml) (BD Biosciences), anti-IL-4 (10 μg/ml) (NCI BRB preclinical repository), anti-IL10 (1 μg/ml) and anti-IL-2 (2 μg/ml) (BD Biosciences). Cells were cultured in Dulbecco's modified Eagle's medium supplemented with 10% fetal calf serum, 2mM L-glutamine, nonessential amino acids, essential vitamins (Cambrex), and 50 μM β-mercaptoethanol. T cells (5×10³) were stimulated with 0.1 μg/ml plate-bound anti-CD3ε and anti-CD28 in 96 well plates for 48 hours. Supernatants were collected and IL-2 levels were measured in a sandwich ELISA following the manufacture's recommendations (BD, or eBioscience). CD4+CD25+ T cells were isolated by using a Cellection Biotin Binder Kit (Invitrogen), according to the manufacturer's protocol. RFP+ Tregs were purified from spleen and lymph nodes of FoxP3-RFP+ mice by cell sorting. In vitro suppression assays were performed with 2.5×10⁵ preactivated Tregs (0.5 μg/ml plate-bound antiCD3ε and 0.5 μg/ml antiCD28, 100 U/ml IL-2 for 24 hours) and equal numbers of naive or Th1 CD4+ T cells. T cells were then activated with 0.1 μg/ml plate-bound antiCD3ε and 0.1 μg/ml antiCD28. Supernatants were collected. IL-2 production was assayed by ELISA.
Statistical Analysis
To analyze significance during EAE a Mann-Whitney test was performed on the clinical indices at each time point. For bone marrow chimera studies two-way ANOVA analysis was performed. Unless otherwise stated student's t-test was performed for two group comparisons.
RESULTS
Following sensitization with MOG peptide AKT3-/- mice are more severely affected than WT mice
As AKT3 constitutes 50% of the total AKT in brain and 30% of spinal cord, and is increased during cellular stress, we questioned whether AKT3-/- mice would be more severely compromised than WT mice following sensitization with MOG35-55 peptide. Figure 1A shows that AKT3-/- mice succumbed to EAE earlier, and remained significantly sicker during the acute phase spanning the first 21 days post-MOG injection. From day 9 through day 14 there was a higher incidence of EAE in AKT3-/- mice and clinical scores were increased at nearly all points of the acute phase of disease until day 21. The disease incidence was 100% in both groups of mice. While disease severity in the AKT3-/- mice (n=4) peaked at ~ day 13, the WT mice (n=5) had a less severe disease course and recovered to a degree leaving the AKT3-/- mice chronic and sicker than the WT mice. Male AKT3-/- mice with higher clinical scores during acute disease was observed in four independent experiments (p<0.05, Mann-Whitney). In one experiment with female mice, AKT3-/- mice (n=7) had significantly higher clinical scores than WT mice (n=8) after three consecutive days with clinical scores (p<0.05, Mann-Whitney).
Figure 1. AKT3-/- mice have significantly higher clinical scores than WT mice and increased CD45+ and Iba1+ inflammation in lumbar spinal cord during acute EAE.

A. Following MOG sensitization, WT and AKT3-/- mice were monitored and graded daily for evidence of EAE as follows: 0, no disease; +1, limp tail or hind limb weakness; +2, limp tail and hind limb weakness; +3, hind limb paralysis; +4, hind and front limb paralysis; +5, moribund # p<0.05. B, C. Increased CD45 and Iba1 immunostaining in AKT3-/- spinal cord during EAE. Lumbar spinal cord sections from mice with clinical scores for 10 days were incubated with anti-CD45 (B) and anti-Iba1 (C). The clinical score of the WT mouse was 1.5 and the AKT3-/- mouse was 2.0. Data is Mean ± SEM. Visualization was by DAB. Asterisk in B,C indicates the designated area in the panels B,C (c,d) at higher magnification. C. Evaluation of Iba1+ inflammation in spinal cord sections. Three to four sections of spinal cord were examined per mouse. Each section was scored for the extent of inflammation on a 1-4 scale, and the averaged/mouse was noted and compared with the WT for statistical significance using a Mann-Whitney test. The extent of Iba1+ inflammation was evaluated on cross sections of spinal cord as follows: A score of 1= mild inflammation at lesions; 2= moderate inflammation at lesions; 3= severe inflammation at lesions; 4=very severe inflammation involving >50% of the spinal cord. WT mice (n=8) and AKT3-/- mice (n=7) were examined. The overall score for the AKT3-/- spinal cords was 3.7±0.18 (±SEM). The overall score of the WT spinal cords was 2.6± 0.42 (±SEM); p ≤ 0.05.
MOG-sensitized AKT3-/- mice with clinical scores for 10 days have significantly more CD45+ and Iba1+ cells in the ventral funiculus of spinal cord relative to WT mice
In pathological states, microglia and macrophages are activated and exhibit dramatic morphological changes that can be detected when stained with CD45 and the calcium-binding protein Iba1. We examined whether activated resident microglia along with macrophages contribute to the more severe disease course observed in AKT3-/- mice. CD45 immunostaining from 3-4 sections from the lumbar region of the spinal cord from five WT and four AKT3-/- mice were examined and scored on a scale of 1-4 with four being maximal CD45+ immunoreactivity. The mean value for the WT mice was 1.8±0.37 (values = 1,1,2,2,3) whereas the mean value for the AKT3-/- mice was 3.3±0.48 (values= 3,4,4,2); p ≤ 0.05. In the AKT3-/- spinal cords there was more widespread areas of inflammation. Figure 1B illustrates the CD45+ staining in frozen sections from lumbar spinal cord of mice that had clinical scores for 10 consecutive days. Although we observed a significant increase in the number of CD45+ cells in lumbar spinal cord, we did not observe a significant increase in total CD45+ high, CD11b+ lo macrophages in total brain and spinal cord of individual mice (n=4) by flow cytometry. The mean CD45 high, CD11b low for WT mice was 256,424±24,005, and the value for the AKT3-/- was 186,294±20,056, p>0.05.
CD11b+ high, CD45+ lo/intermediate were significantly less in the AKT3-/- mice (228,122 ± 24,640 N=4) relative to the WT (412,682 ± 42,910 N=4) p<0.01, likely reflecting the 25% decrease in brain and spinal cord weight observed in the AKT3-/- mice. Since CD11b does not distinguish between activated and total microglia/macrophages, we examined whether there was a difference in activated microglia by staining cross sections of lumbar and lumbar-sacral spinal cords of WT and AKT3-/- mice with Iba1. Figure 1C shows the spinal cord of a representative WT mouse and an AKT3-/- mouse with similar scores (WT: CI 1.5, AKT3-/-: CI=2.0). All mice had clinical scores for 10 days. Examination of multiple sections of the spinal cord show that while the mice had similar scores the spinal cord of AKT3-/- mice have more extensive Iba1+ immunostaining than WT spinal cord; this was more evident in mice with higher clinical scores. To determine whether there was a significant difference in Iba1 staining, three to four sections of spinal cord per mouse was examined, and scored on a 1-4 scale. The extent of Iba1+ inflammation was scored as follows: 1= mild inflammation at lesions; 2= moderate inflammation at lesions; 3= severe inflammation at lesions; 4=very severe inflammation involving >50% of the spinal cord. We examined 8 WT mice and 7 AKT3-/- mice, and obtained statistical analysis using Mann-Whitney test. The overall score for the AKT3-/- spinal cords (n=7 mice) was 3.7±0.18 (SEM). The overall score of the WT spinal cords (n=8 mice) was 2.6± 0.42 (SEM); p < 0.05.
Following active MOG sensitization, overt demyelination is observed in AKT3-/- spinal cord during acute disease
To determine whether the AKT3-/- mice had more demyelination that WT mice, we sacrificed mice 3 days, 4 days, 5 days, and 10 days after the initial clinical sign of disease (CI≥1.0) and by MBP immunostaining examined paraffin-embedded spinal cord sections to evaluate whether AKT3-/- mice had sustained demyelination relative to WT mice. Three-four non-serial sections were examined from multiple mice/time points. As demonstrated in figure 2A, AKT3-/- mice had earlier signs of demyelination in the ventral spinal cord relative to WT mice. Signs of demyelination were more obvious in the AKT3-/- lumbar spinal cord 3-4 days following clinical signs of disease (Figure 2A:a-h). The asterisk in each of the low magnification panels indicates the designated area in the panels at higher magnification. In mice with clinical scores for 5 days and 10 days there were visible signs of demyelination in the WT mice (Figure 2A:i,j, Figure 2B:c,d). AKT3-/- mice had higher clinical scores and more extensive demyelination in the ventral funiculus (Figures 2A:k,l; 2B:g,h). Iba1 staining in WT and AKT3-/- spinal cord are illustrated in Figure 2B:g-l. The representative mice had the mean clinical score for the WT and AKT3-/- mice at the time of sacrifice. To quantify the extent of demyelination in mice with clinical scores for 10 days, frozen spinal cord sections from WT mice (n=5) and AKT3-/- mice (n=4) were incubated with Myelin Black-Gold II stain and analyzed in ImageJ. The extent of demyelination was calculated as percentage of the dark demyelinated area relative to the percentage of the total white matter area within the dorsal, ventral and lateral regions. The mean percentage of demyelination for the WT mice was 3.5 ±1.4 (±SD), and the mean percentage of demyelination for the AKT3-/- mice was 9.8±0.74, p=0.0026.
Figure 2. AKT3-/- mice have more demyelination in the ventral funiculus than WT mice during acute EAE.

Paraffin-embedded cross-sections of lumbar spinal cord, with clinical scores for 3-5 days (A) or 10 days (B), were incubated with MBP mAb SMI99 and visualized by DAB. B. Representative sections stained with H+E (a,e), or incubated with antibody to Iba1 (Bd and Bf), and MBP (c,d,g,h) and visualized by DAB. Asterisk indicates the designated area in the panels at higher magnification. C. Myelin Black Gold II staining of frozen spinal cord sections from WT (n=5) and AKT3-/- mice (n=4) with clinical scores for 10 days. Analysis in Image J.
During chronic disease MOG-induced EAE pathology in AKT3-/- mice includes extensive demyelination, and SMI32+ axonal spheroids in white matter
Longitudinal spinal cord sections from mice with clinical scores for 29-30 days were evaluated for demyelination and axonal damage following immunostaining with MBP and SMI32. Figure 3a-d show representative longitudinal sections with SMI32+ axonal swellings extending the length of the white matter tracts of both WT (Figure 3 a,c) and AKT3-/- lumbar spinal cord (Figure 3 b,d). The arrow in Figures 3a and b denotes the level of the cord magnified in Figures 3c and d. Although the AKT3-/- spinal cord appeared to have more SMI32+ axonal swelling at this time point, evaluation of multiple cross-sections of WT and AKT3-/- spinal cords from mice with clinical scores for 3-5 days (day 14 post-sensitization), or 10 days did not have statistically significant differences (p> 0.05).
Figure 3. AKT3-/- mice have more demyelination than WT mice during chronic EAE.

Longitudinal sections of lumbar spinal cord from AKT3-/- and WT mice, with clinical scores for 29-30 days, were incubated with SMI32 (a-d) and MBP (e-h); visualization was by DAB. Arrows in a,b,e,f denote areas of magnification in c,d,g,h, respectively. Arrow in f, lower right also denotes a region of myelin pallor. Arrowhead in h shows an oligodendrocyte extending MBP+ processes adjacent to axons.
Demyelination was more severe in AKT3-/- mice than WT mice during the chronic phase, consistent with demyelination during acute disease. Examination of MBP immunostaining determined that demyelination in the AKT3-/- mice extended further up the spinal cord. A clear region of myelin pallor is visible in Figure 3f (arrow), and extends toward a region of more extensive myelin staining. At high magnification (Figure 3h), an oligodendrocyte extending MBP+ processes adjacent to axons are observed, arrowhead.
We examined brain stem at the level of pons from the aforementioned WT and AKT3-/- mice with MBP and MAP-2 and observed no overt lesions in the sections examined.
Relative to WT, MAP-2 in AKT3-/-, lumbar spinal cord is significantly reduced during chronic EAE
Western blot analysis and immunohistochemistry confirm a significant decrease in MAP-2 in lumbar spinal cord in AKT3-/- mice (n=4) relative to WT (n=3) at day 40 post-sensitization (Figure 4). The CI's of the WT mice ranged from 0-1.5, whereas the CI's of the AKT3-/- mice ranged from 1-4. Naïve WT (n=1) and AKT3-/- (n=3) lumbar spinal cords were analyzed and compared with the sensitized spinal cords. As shown in Figure 4A, MAP-2 in the lumbar region of spinal cord of sensitized AKT3-/- mice was significantly reduced relative to lumbar spinal cords from sensitized WT mice, p = 0.039. There was no significant loss in MAP-2 in the sensitized WT mice relative to the naïve mice. MAP-2 in the sensitized AKT3-/- spinal cord was significantly reduced relative to the naïve AKT3-/- spinal cord (p=0.017).
Figure 4. Significant loss of MAP-2 during chronic EAE is observed by immunoblot and immunohistochemical analysis.

A. Western blot analysis shows a significant loss of MAP-2 in lumbar spinal cord at 40 days post-sensitization. 20 μg of lumbar spinal cord protein homogenate was loaded/lane. The upper portion of the blot was incubated with a monoclonal antibody to MAP-2 (Sigma, 1:1000), and the lower portion was incubated with a monoclonal antibody to β-actin (Sigma). Visualization was by ECL (Amersham). Densitometry and RDI was performed on signals in the linear range (ImageJ). B. Longitudinal sections of lumbar spinal cord from sensitized mice with clinical scores for 30 days were incubated with antibodies to MBP, Iba1 and MAP-2. Boxed region denotes region magnified in MAP-2 stained sections. C. Longitudinal sections of lumbar spinal cord from naïve, 10 week old WT and AKT3-/- mice incubated with antibodies to MAP-2 and MBP.
In addition to performing immunoblot analysis, we examined MAP-2 immunoreactivity using longitudinal sections of spinal cord with areas of demyelination and inflammation. Figure 4B shows MBP, Iba1 and MAP-2 immunostaining for the sensitized WT and AKT3-/- mice. The mice had clinical scores for 30 days. The boxed areas, denoting part of the lesion with reduced MBP immunoreactivity and Iba1 staining, is further illustrated at higher magnification for MAP-2. In the AKT3-/- sections there is MAP-2 pallor that is consistent with the immunoblot analysis. Figure 4C shows sections of spinal cord from naive WT and AKT3-/- mice stained for MBP and MAP-2. In the multiple naïve AKT3-/- mice examined there was no overt loss of MBP or MAP-2 immunoreactivity consistent with the immunoblot analyses. Further, there was no overt alteration in the length of the spinal cord in the AKT3-/- spinal cord relative to the WT spinal cord (Supplemental Figure 1).
Relative to WT mice, AKT3-/- mice express increased inflammatory cytokine mRNAs during acute EAE
To address the contribution of resident and infiltrating inflammatory cells, mRNA was isolated from the lumbar spinal cords of mice having three consecutive days of clinical scores (~day 14 post EAE). Quantitative RT-PCR (qRT-PCR) was performed using primers specific for IL-17, IL-2, INFγ, IL-6 and TNFα to quantify the expression of these cytokines. Similar analyses were performed with RNA isolated from the same region of spinal cord from naïve mice. Values were normalized to levels of β-actin mRNA and calculated as the fold induction mRNA relative to naïve mice for AKT3-/- and WT mice for IL-2, IL-17 and IFNγ. Additional analyses used HPRT and GAPDH as controls with similar results. No detectable levels of IL-6 or TNFα were obtained in naïve mice and therefore, levels represent values expressed at day 14 post EAE. As demonstrated in figure 5, there was a significant increase in INFγ, IL-2, and IL-17 mRNA expression in AKT3-/- lumbar spinal cords (n=9) relative to WT lumbar spinal cords (n=6) during acute EAE; p <0.05. Relative to naïve mice, IL-6 and TNFα mRNA were dramatically increased in the WT and AKT3-/- spinal cord during EAE. While the levels of IL-6 mRNA in AKT3-/- mice was markedly increased relative to the WT mice significance was not obtained. Further, there was no difference in TNFα mRNA between the two treated groups of mice (p >0.05).
Figure 5. Quantitative RT-PCR demonstrates that relative to WT mice, AKT3-/- mice have increased inflammatory cytokine expression in spinal cord during acute EAE.
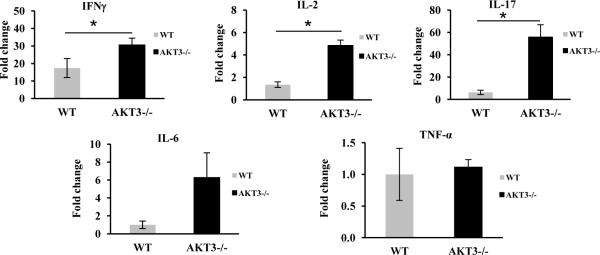
Total RNA was isolated from spinal cords of naïve mice and MOG-sensitized WT and AKT3-/- mice following three consecutive days of clinical scores (~day 14). Values were normalized to levels of actin mRNA and calculated as the fold induction mRNA relative to naïve mice for AKT3-/- and WT mice for IL-2, IL-17 and IFNγ; p≤0.05. Similar statistically significant results were obtained when the data was normalized to GAPDH or HPRT. No detectable levels of IL-6 or TNFα were obtained for naïve mice and therefore, levels represent values expressed during EAE; p > 0.05.
Bone Marrow Chimera (BMC) studies support the hypothesis that immune cells contribute to the more severe disease course observed in AKT3-/- mice
To explore whether immune cells could also contribute to the more severe disease course observed in AKT3-/- mice, four groups of 7 week old irradiated male mice (WT and AKT3-/-) received 107 bone marrow (BM) cells from 6 week old male mice 24h after irradiation. Mice were housed in quarantine for 6 weeks, at which time the mice were sensitized with MOG35-55 peptide. Mice were monitored for clinical signs of disease as detailed above, and data from the experiment are presented in Figure 6 and Tables I and II. Irradiated WT or AKT3-/- mice receiving BM cells from AKT3-/- mice had a more severe disease course than AKT3-/- mice receiving BM cells from WT mice or WT mice reconstituted with WT bone marrow cells. Table I and II show the mean clinical scores and the statistical analyses for the four groups of mice from days 17-20. The data show that AKT3-/- mice receiving AKT3-/- BM cells are significantly sicker than the groups of mice receiving WT BM cells. The data indicate that both defects in radioresistant cells and radiosensitive BM derived cells contribute to the increased severity of MOG-induced EAE observed in AKT3-/- mice.
Figure 6. Mice receiving bone marrow (BM) cells from AKT3-/- mice have higher mean clinical scores following MOG-induced EAE.
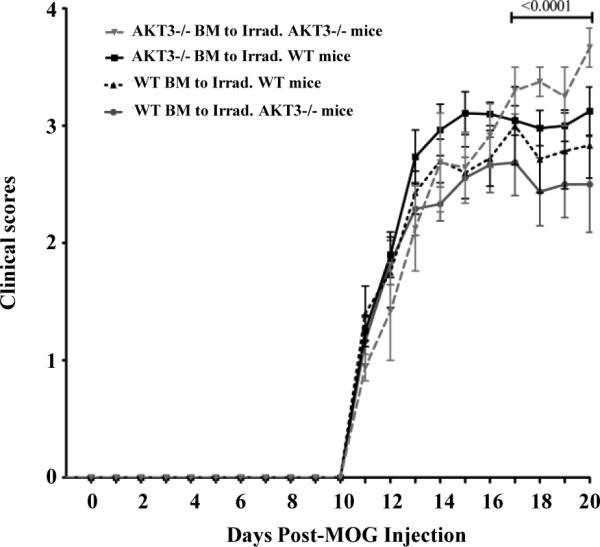
Upon sacrificing the mice we analyzed the re-population of T cells in spleen. Our analysis demonstrated that the repopulation of BM cells in groups 1 through 4 were successful. Data were normalized to the day of onset of disease for each group of mice. Inverted grey triangle, AKT3-/- BM to Irrad. AKT3-/- Mice (n=8). Black square, AKT3-/- BM to Irrad. WT Mice (n=20). Upward triangle, WT BM to Irrad. WT Mice (n=10). Circle, WT BM to Irrad. AKT3-/- Mice (n=12).
Table I. Mice receiving BM cells from AKT3-/- mice have higher mean clinical scores following MOG-induced EAE.
Mean Clinical Scores of Mice (Days 17-20).
| Groups | Mean ± SEM |
|---|---|
| WT BM to Irrad. AKT3-/- mice | 2.5 ± 0.063 |
| AKT3-/- BM to Irrad. WT mice | 3.0 ± 0.025 |
| WT BM to Irrad. WT mice | 2.8 ± 0.063 |
| AKT3-/- BM to Irrad. AKT3-/- mice | 3.4 ± 0.095 |
Table II.
Comparison Test days 17-20.
| Bonferroni's Multiple Comparison Test | P < 0.05 | Summary |
|---|---|---|
| WT BM to AKT3-/- vs AKT3-/- BM to WT mice | Yes | ** |
| WT BM to AKT3-/- mice vs WT BM to WT mice | Yes | * |
| WT BM to AKT3-/- mice vs AKT3-/- BM to AKT3-/- mice | Yes | **** |
| AKT3-/- BM to WT mice vs WT BM to WT mice | No | ns |
| AKT3-/- BM to WT mice vs AKT3-/- BM to AKT3-/- mice | Yes | ** |
| WT BM to WT mice vs AKT3-/- BM to AKT3-/- mice | Yes | *** |
p <0.05
p<0.01
p<0.001
p<0.0001
Ns, not significant p>0.05, Prism 5.04 Windows.
CNS tissues from AKT3-/- mice have fewer Tregs in lumbar spinal cord than WT mice
Based on the results obtained with the BM chimeras, and given the key role of T cells in the pathogenesis of EAE, we evaluated whether differences in the number of infiltrating T cells could be observed between WT and AKT3-/- mice. We sacrificed mice at day 14, when all mice had clinical scores for 3-5 days. Brain and spinal cords were isolated from WT and AKT3-/- mice and the number of CD4+FoxP3+ cells was determined by FACS analysis. As demonstrated in figure 7A, the mean number of CD4+FoxP3+ cells in WT CNS was 8,199±1,129 (n=4) and the mean number in the AKT3-/- CNS was 4,058± 683 (n=4), p<0.02. FACS analysis of CD3+ cells in total brain and spinal cord from WT (223,082 ± 15,177, n=4) and AKT3-/- mice (155,649 ± 21,144 N=4) showed fewer CD3+ cells in AKT3-/- mice relative to the WT, p≤ 0.05. We next determined the ratio of CD3+/FoxP3+ in the CNS and determined that there was a significant difference in the ratio of these cell populations in the WT (28.6±3.4, n=4) and the AKT3-/- mice (39.2±2.4, n=4), p≤0.05.
Figure 7. During acute EAE, fewer Tregs are present in the spinal cord of AKT3-/- mice than WT mice.

A. FACS analysis of brain and spinal cord of mice having clinical scores for 3-4 days show fewer FoxP3+ Tregs in the CNS of AKT3-/- mice during acute EAE. The ratio of CD3+/FoxP3+ cells is significantly increased in AKT3-/- brain and spinal cord, *p≤0.05; **<0.02. B. Mice with clinical scores for 4 days were sacrificed on day 14. Multiple 7 μm, 4% paraformaldehyde-treated sections of spinal cord were stained with H+E, and incubated with antibodies to CD3 and FoxP3. Arrow in a and e denote area in c,d,g,h at higher magnification.
In addition, we performed immunohistochemistry and focused our attention on the lumbar spinal cord. At this time point, the mean clinical scores of the AKT3-/- mice were 2.7 ± 0.25 (n=6) and the WT mice were 1.8 ± 0.14 (n=4); p=0.02. Four sections of spinal cord and 3 non-serial slides were analyzed for CD3 and FoxP3 expression by immunohistochemistry. A representative H&E stained section of WT and AKT3-/- spinal cord is shown in figure 7B a,e; the arrow denote the lesion documented at high magnification following staining with CD3, and FoxP3. CD3 immunostaining in Figure 7B b,f illustrates the lesions and extent of CD3+ T cells at low magnification. The number of CD3+ cells in each section was too abundant to count, and overlapping cells were difficult to assess at higher magnification (Figure 7B b,c,f,g); therefore, full spinal cord sections were scanned in Image J and the mean relative intensity (rdi) was determined. There was no significant difference in the number of CD3+ cells in the lumbar and lumbar sacral region of the spinal cords of the two groups of mice p> 0.05. To assess the total number of FoxP3+ cells within the lumbar spinal cord section for each mouse, multiple non-serial sections were counted; FoxP3+ cells in the meninges were excluded from the count. We observed a significant reduction in FoxP3+ Tregs in the spinal cord of the AKT3-/- mice (p = 0.02; Figure 7 d,h). The mean number of FoxP3+ Tregs in the AKT3-/- spinal cord cross section was 10.1 ± 1.3 versus 27.5 ± 4.8 in the WT spinal cord. The representative cross sections of WT and AKT3-/- mice had clinical scores equivalent to the mean value. Thus, lumbar spinal cords of AKT3-/- mice had fewer FoxP3+ regulatory T cells, higher cytokine mRNA levels in the lumbar spinal cord, and a more severe clinical course of disease than the WT mice. In an additional experiment, we examined FoxP3+ cells in frozen sections of lumbar spinal cord from mice with clinical scores for 10 days. At this time point there was no significant difference in the number of FoxP3+ cells in the two groups of mice by immunohistochemistry suggesting that the Tregs might have already trafficked out of the CNS.
We then analyzed whether the differences observed in Treg infiltration in spinal cord might reflect differences in the general distribution of Treg cells in lymphoid organs. The Supplemental Table shows the distribution of CD4+CD25+ and CD4+CD25- T cells isolated from the spleen and lymph nodes of naïve WT and AKT3-/- mice. Of the overall CD4+ T cells 10-12% were CD4+CD25+ in both WT and AKT3-/- mice. Labeling with a FoxP3 antibody, revealed that the percentage of FoxP3+ T cells in the CD4+CD25+ population was ~84%, corroborating that equivalent numbers of FoxP3+ Tregs were present in the peripheral repertoire of WT and AKT3-/- mice (Figure 8A). To further substantiate that the number of peripheral CD4+CD25+FoxP3+ cells were equivalent in naïve WT and AKT3-/- mice, AKT3-/- mice were crossed with FoxP3+RFP+ mice and the resulting FoxP3+RFP+/AKT3+/+ and FoxP3+RFP+/ AKT3-/- mice were analyzed by flow cytometry. As shown in figure 8B, equivalent cells were observed in both spleen and lymph node populations, p>0.05.
Figure 8. Equivalent numbers of regulatory T cells are found in spleen and lymph nodes of naïve WT and AKT3-/- mice.
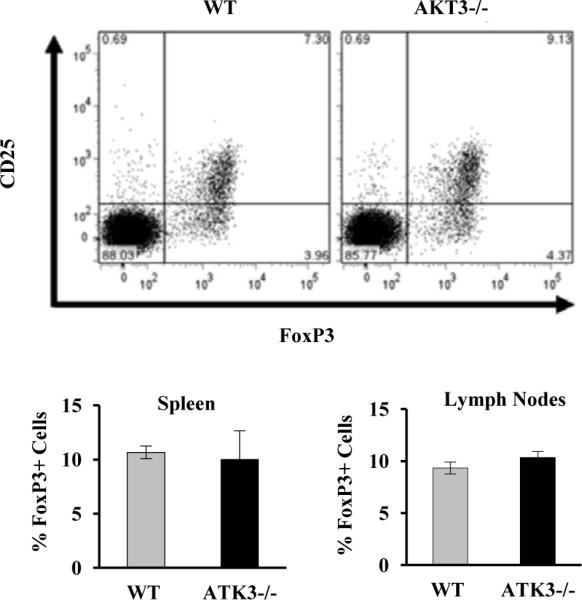
A. The percentage of CD25+FoxP3+ T cells in the CD4+ T cell population was assessed by FACS in cells isolated from spleen of WT and AKT3-/- mice. B. Quantification of the percentages of Foxp3+ cells in the CD4+ T cell population in spleen and lymph nodes of WT and AKT3-/- mice.
AKT3-deficient T cells are resistant to Treg-mediated suppression
Given the increased cytokine production observed in AKT3-/- spinal cords during EAE, we examined whether efficient Treg-mediated suppression of T cells could rely on AKT3. First, to determine whether AKT3 was expressed in mature T cells, protein homogenates of CD4+ T cells isolated from the spleens of WT and AKT3-/- mice were examined for AKT3 expression by immunoblot analysis. As shown in figure 9A, AKT3 was detected in WT T cell homogenates but not in T cells from AKT3-/- mice. We then examined whether loss of AKT3 may cause resistance to Treg-mediated suppression that could account for the increased cytokine expression detected in spinal cords of AKT3-/-mice during EAE. Figures 9B and C show that in vitro differentiated Th1 cells (Supplemental Figure 2A) from both WT mice and AKT3-/- mice expressed similar levels of IL-2 when stimulated using plate-bound anti-CD3 and anti-CD28, indicating that activation-induced cytokine expression is not altered in AKT3-/- CD4+ T cells. Furthermore, Tregs from the WT mice and the AKT3-/- mice were able to suppress WT T cell activation. By contrast, CD4+CD25- Th1 cells from AKT3-/- mice could not be efficiently suppressed by either AKT3-/- or WT Tregs; the data was consistent across genders, indicating that AKT3-/- T cells are more resistant to Treg-mediated suppression. Similar results were obtained when Th17 cells (Supplemental Figure 2B) were analyzed. While the overall level of Treg-mediated suppression of cytokine production was lower than what we had detected in Th1 cells, still there was a significant decrease in the susceptibility to Treg-mediated suppression in AKT3-deficient Th17 cells compared to wild type cells (Fig. 9E).
Figure 9. CD4+ T cells isolated from naïve AKT3-/- mice and following MOG-induced EAE are more resistant to Treg-mediated suppression than T cells from WT mice.

A. Total T cell protein homogenates were prepared from WT and AKT3-/- mice and incubated with an AKT3 monoclonal antibody followed by β-actin. Lanes 1 and 2: WT; lanes 3 and 4: AKT3-/-. 40 μg (lanes 1, 3) and 80 μg (lanes 2, 4) of protein were loaded for each sample. B and C. In vitro differentiated primary Th1 cells from WT or AKT3-/- naïve mice were activated with plate bound antiCD3 and antiCD28 in the presence or absence of WT or AKT3-/- Tregs for 24 hours and IL-2 production measured by ELISA. Results are mean ± SEM from 3 independent experiments; p<0.01. C. Suppression was evaluated as a percentage of inhibition of IL-2 expression induced by WT Tregs on WT or AKT3-/- Th1 cells; p=0.013. D. Spleens and lymph nodes from WT or AKT3-/- mice were pooled according to the clinical scores (2-3 mice/group). Each assay was performed in triplicate. CD4+ Tconv cells were activated in the presence and absence of Treg (50,000 cells each) were co-cultured for 48h. Supernatants were then harvest for ELISA assay to detect IL-2 production; p=0.026. E: In vitro differentiated Th17 cells from wild type or AKT3-deficient mice were activated with plate bound antiCD3 in the presence or absence of wild type Tregs. IL-17 production was measured by ELISA. Results are presented as percentage of suppression of IL-17 production in the presence of Tregs compared to control activated Th17 cells. Graph represents mean+SEM from three independent experiments. *p<0.05.
To further substantiate the contribution of T cells to severity of disease in the AKT3-/- mice, we examined the T cell populations in the periphery of WT and AKT3-/- EAE mice. In three independent experiments, we examined the susceptibility of T cells from AKT3-/- mice to Treg-mediated suppression. In the experiment shown in Figure 9D, AKT3-/- mice (n=8) and WT mice (n=7) were examined during the acute phase of disease. Mice were sacrificed and spleen and lymph nodes were harvested. CD4+CD25- Tconv cells and CD4+CD25+ Tregs were isolated, and suppression of activation-induced IL-2 production was evaluated. Spleens and lymph nodes were pooled from 2-3 mice with comparable clinical scores; all mice showed signs of disease. The ability of WT CD4+CD25+ Tregs to suppress AKT3-/- CD4+CD25- Tconv cells was significantly less than in WT Tconv (p = 0.026). As observed in naïve mice, in the absence of Tregs the level of IL-2 production did not differ between AKT3-/- mice and WT mice. These data demonstrate that a disruption in the AKT3 signaling pathway in sensitized AKT3-/- mice results in increased resistance to Treg-mediated suppression with enhanced cytokine production.
In summary, our combined studies show that following MOG-induced EAE AKT3-/- mice have a more severe course of disease resulting in inefficient suppression of Teff cells, fewer Tregs in the CNS, increased cytokine mRNA expression, extensive Iba1+ microglia and reduced MBP expression in the ventral funiculus during acute disease, and prolonged demyelination during chronic disease. Bone marrow chimera studies indicate that both hematopoietic cells and cells of the CNS contribute to the more severe pathology in AKT3-/- mice. The extensive demyelination observed in the ventral funiculus of AKT3-/- mice support the hypothesis that AKT3 is an important signaling pathway in the CNS.
DISCUSSION
As a result of an incomplete understanding of the abundance and specific activities of each of the AKT isoforms in normal tissue and in disease states, we initiated a study to define the role of AKT3 in the CNS using the experimental model EAE. While expressed in most cell types (8, 9), AKT3 is the predominant form expressed in the CNS of naive mice and the major AKT isoform in neurons (21). In the immune system, AKT3 contributes to the pre-TCR-induced signaling required for the double-negative to double-positive transition in thymocytes, however functions of this AKT isoform in mature T cells have not been yet characterized (16). AKT3-/- mice are viable, show no growth retardation with the exception of a smaller brain size and weight, and have no anatomical malformations in brain structure except for a thinner white matter fiber tract within the corpus callosum (8).
To test our hypothesis that deletion of AKT3 would negatively impact the CNS making AKT3-/- mice more susceptible to degeneration, we sensitized mice with MOG35-55 peptide. Our data show that AKT3-/- mice had higher clinical scores following MOG-induced EAE, more Iba1+ and CD45+ cells in lumbar spinal cord during acute disease, more demyelination during acute and chronic disease, expressed more IL-2, INFγ, and IL-17, and IL-6 mRNA, and had fewer FoxP3+ Treg in the CNS than WT mice. As AKT3 is expressed by many cell types and can play a role in the periphery, we examined MOG-induced EAE in bone marrow chimeras using WT and AKT3-/- mice. Our results show that only when irradiated AKT3-/- mice received AKT3-/- bone marrow cells were the mice significantly more impaired during MOG-induced EAE than irradiated WT mice receiving bone marrow cells from WT mice. These results support a role for AKT3 not only in the CNS but also in the regulation of the activity of bone marrow-generated cells.
Our initial evaluation of naïve WT and AKT3-/- mice determined that they had comparable CD4+CD25- conventional cells and FoxP3+RFP+ Tregs in the periphery. Yet, following sensitization with MOG, there were fewer FoxP3+ Tregs that entered the spinal cord of AKT3-/- mice during acute EAE. Flow cytometry showed that the number of neutrophils, and NK cells were comparable (data not shown). The observed decrease in CD4+CD25+FoxP3+ cells combined with the activated state of the Iba1+ glia likely contributed to the increase in cytokine mRNA and the more severe disease course observed in the AKT3-/- mice. Tregs have been shown to modulate EAE and adoptive transfer of these suppressor cells ameliorates EAE progression (22). Interestingly, Tconv cells of naïve AKT3-/- mice failed to be efficiently suppressed by Treg. This resistance to Treg-mediated suppression was also observed when T cells from AKT3-/- EAE mice were analyzed. The exact defect in the suppressive mechanism in T cells lacking AKT3 is currently unknown. Although AKT1 hyperactivation has been shown to confer resistant to suppression (23), we did not observe any compensatory increase in the activation of other AKT kinases in AKT3-/- mice (data not shown), which suggest that signaling pathways regulated specifically by AKT3 modulate the susceptibility of conventional CD4+ T cells to suppression by Tregs. However, AKT3 deficiency did not appear to affect Treg function, as Tregs from AKT3-/- mice were able to efficiently suppress effector T cells from WT mice, indicating that the defect caused by the lack of AKT3 activity does not affect the Treg's ability to suppress but rather causes an inability of the conventional CD4+ T cells to be efficiently suppressed.
Th1 and Th17 cells promote inflammation by cytokine production. Th1 cells produce IFN-γ, and Th17 cells produce IL-17. IFNγ can down-regulate EAE by signaling macrophages, microglia and astrocytes to produce inducible NO synthase and subsequently NO generation (24-28). However, IFNγ treatment in vitro inhibits cell cycle exit in differentiating oligodendrocyte progenitor cells (29) and in marmosets does not abate the EAE disease course (30). This indicates that an inflammatory to anti-inflammatory balance is essential to modulate EAE progression. Inefficient T cell suppression could then result in increased production of proinflammatory molecules that would exacerbate disease progression as is observed in AKT3-/- mice during EAE. Production of proinflammatory molecules can be upregulated in the CNS as a result of the migration of inflammatory cells into the CNS, as well as secretion of proinflammatory factors by resident glia. IL-17 is a potent inflammatory cytokine that helps to recruit monocytes and neutrophils to the site of inflammation, similar to IFNγ (31). IL-17 activates immune cells to produce a host of chemokines, cytokines, and adhesion molecules and as a result contributes to a more severe EAE disease course (32). In addition, IL-17 has been shown to contribute to the pathology of multiple sclerosis. We found that IL-17, plus INFγ, and IL-2 and production are increased during acute EAE in both WT and AKT3-/- mice, with significantly higher mRNA expression in spinal cords from AKT3-/- mice. This suggests that influx of inflammatory cells into the CNS and/or activation of resident inflammatory cells significantly increased cytokine mRNA production in AKT3-/- spinal cord relative to WT mice. IL-6 produced by T cells, macrophages and microglia can be both proinflammatory and anti-inflammatory. IL-6 can suppress TNFα which itself can promote inflammation or promote remyelination depending upon which receptor (TNFR1 or TNFR2) is activated (33). During EAE TNFα mRNA was significantly increased in the sensitized WT and AKT3-/- spinal cords relative to the naive spinal cords, however, there was no significant difference in mRNA between the two groups of mice.
Our data support our hypothesis that the loss of AKT3 impacts the severity of EAE. Currently, there are no known downstream substrates for AKT3, and additional studies are warranted to explore this line of study. It is also possible that rather than novel substrates for each AKT isoform there is preferential localization of each isoform to a sub-cellular region of the cell without which normal cell signaling cannot occur. As AKT3 was determined to be activated following heat shock and oxidative stress (34), it likely contributes to maintaining normal homeostasis in the CNS, and in its absence the resulting damage may increase influx of infiltrating inflammatory cells. This effect may be compounded by the fact that AKT3-deficient effector CD4+ T cells are less susceptible to Treg-mediated suppression.
Supplementary Material
Acknowledgements
We thank Ms. Rebecca Bauer for her help with the Myelin Black-Gold II stain. Ms. Bauer participated in the high school summer research program. We thank Dr. Hyeon-Sook Suh and Sunhee Lee for access to some of their mouse cytokine and control primer pairs.
This work was supported by a grant from the National Multiple Sclerosis Society (NMSS; RG 4046-A6), the National Institutes of Health AI059738 and GM007288, and the Neuropathology training grant T32NS007098.
Abbreviations
- BM
bone marrow
- BMC
bone marrow chimera
- CI
Clinical Index
- DAB
diaminobenzidine
- IGF1
insulin growth factor 1
- Irrad.
irradiated
- MBP
myelin basic protein
- MOG-induced EAE
myelin-oligodendrocyte glycoprotein induced experimental autoimmune encephalomyelitis
- NF
neurofilament
- OLs
oligodendrocytes
- OPCs
oligodendrocyte progenitor cells
- pAb
polyclonal antibody
- qRT-PCR
quantitative real-time polymerase chain reaction
- R
receptor
- RDI
relative density index
- Tconv cells
conventional T cells
- Tregs
regulatory T cells
- WT
wildtype C57Bl6/J mice
Footnotes
The authors have no financial conflicts of interest.
REFERENCES
- 1.Manning BD, Cantley LC. AKT/PKB signaling: navigating downstream. Cell. 2007;129:1261–1274. doi: 10.1016/j.cell.2007.06.009. [DOI] [PMC free article] [PubMed] [Google Scholar]
- 2.Engelman JA, Luo J, Cantley LC. The evolution of phosphatidylinositol 3-kinases as regulators of growth and metabolism. Nat Rev Genet. 2006;7:606–619. doi: 10.1038/nrg1879. [DOI] [PubMed] [Google Scholar]
- 3.Cho H, Thorvaldsen JL, Chu Q, Feng F, Birnbaum MJ. Akt1/PKBalpha is required for normal growth but dispensable for maintenance of glucose homeostasis in mice. J Biol Chem. 2001;276:38349–38352. doi: 10.1074/jbc.C100462200. [DOI] [PubMed] [Google Scholar]
- 4.Yang ZZ, Tschopp O, Hemmings-Mieszczak M, Feng J, Brodbeck D, Perentes E, Hemmings BA. Protein kinase B alpha/Akt1 regulates placental development and fetal growth. J Biol Chem. 2003;278:32124–32131. doi: 10.1074/jbc.M302847200. [DOI] [PubMed] [Google Scholar]
- 5.Chen WS, Xu PZ, Gottlob K, Chen ML, Sokol K, Shiyanova T, Roninson I, Weng W, Suzuki R, Tobe K, Kadowaki T, Hay N. Growth retardation and increased apoptosis in mice with homozygous disruption of the Akt1 gene. Genes Dev. 2001;15:2203–2208. doi: 10.1101/gad.913901. [DOI] [PMC free article] [PubMed] [Google Scholar]
- 6.Flores AI, Narayanan SP, Morse EN, Shick HE, Yin X, Kidd G, Avila RL, Kirschner DA, Macklin WB. Constitutively active Akt induces enhanced myelination in the CNS. J Neurosci. 2008;28:7174–7183. doi: 10.1523/JNEUROSCI.0150-08.2008. [DOI] [PMC free article] [PubMed] [Google Scholar]
- 7.Cho H, Mu J, Kim JK, Thorvaldsen JL, Chu Q, Crenshaw EB, 3rd, Kaestner KH, Bartolomei MS, Shulman GI, Birnbaum MJ. Insulin resistance and a diabetes mellitus-like syndrome in mice lacking the protein kinase Akt2 (PKB beta). Science. 2001;292:1728–1731. doi: 10.1126/science.292.5522.1728. [DOI] [PubMed] [Google Scholar]
- 8.Tschopp O, Yang ZZ, Brodbeck D, Dummler BA, Hemmings-Mieszczak M, Watanabe T, Michaelis T, Frahm J, Hemmings BA. Essential role of protein kinase B gamma (PKB gamma/Akt3) in postnatal brain development but not in glucose homeostasis. Development. 2005;132:2943–2954. doi: 10.1242/dev.01864. [DOI] [PubMed] [Google Scholar]
- 9.Easton RM, Cho H, Roovers K, Shineman DW, Mizrahi M, Forman MS, Lee VM, Szabolcs M, de Jong R, Oltersdorf T, Ludwig T, Efstratiadis A, Birnbaum MJ. Role for Akt3/protein kinase Bgamma in attainment of normal brain size. Mol Cell Biol. 2005;25:1869–1878. doi: 10.1128/MCB.25.5.1869-1878.2005. [DOI] [PMC free article] [PubMed] [Google Scholar]
- 10.Ahmed NN, Grimes HL, Bellacosa A, Chan TO, Tsichlis PN. Transduction of interleukin-2 antiapoptotic and proliferative signals via Akt protein kinase. Proc Natl Acad Sci U S A. 1997;94:3627–3632. doi: 10.1073/pnas.94.8.3627. [DOI] [PMC free article] [PubMed] [Google Scholar]
- 11.Cantrell D. Protein kinase B (Akt) regulation and function in T lymphocytes. Semin Immunol. 2002;14:19–26. doi: 10.1006/smim.2001.0338. [DOI] [PubMed] [Google Scholar]
- 12.Kane LP, Andres PG, Howland KC, Abbas AK, Weiss A. Akt provides the CD28 costimulatory signal for up-regulation of IL-2 and IFN-gamma but not TH2 cytokines. Nat Immunol. 2001;2:37–44. doi: 10.1038/83144. [DOI] [PubMed] [Google Scholar]
- 13.Plas DR, Talapatra S, Edinger AL, Rathmell JC, Thompson CB. Akt and Bcl-xL promote growth factor-independent survival through distinct effects on mitochondrial physiology. J Biol Chem. 2001;276:12041–12048. doi: 10.1074/jbc.M010551200. [DOI] [PubMed] [Google Scholar]
- 14.Wieman HL, Wofford JA, Rathmell JC. Cytokine stimulation promotes glucose uptake via phosphatidylinositol-3 kinase/Akt regulation of Glut1 activity and trafficking. Mol Biol Cell. 2007;18:1437–1446. doi: 10.1091/mbc.E06-07-0593. [DOI] [PMC free article] [PubMed] [Google Scholar]
- 15.Pierau M, Engelmann S, Reinhold D, Lapp T, Schraven B, Bommhardt UH. Protein kinase B/Akt signals impair Th17 differentiation and support natural regulatory T cell function and induced regulatory T cell formation. J Immunol. 2009;183:6124–6134. doi: 10.4049/jimmunol.0900246. [DOI] [PubMed] [Google Scholar]
- 16.Mao C, Tili EG, Dose M, Haks MC, Bear SE, Maroulakou I, Horie K, Gaitanaris GA, Fidanza V, Ludwig T, Wiest DL, Gounari F, Tsichlis PN. Unequal contribution of Akt isoforms in the double-negative to double-positive thymocyte transition. J Immunol. 2007;178:5443–5453. doi: 10.4049/jimmunol.178.9.5443. [DOI] [PubMed] [Google Scholar]
- 17.Laemmli UK. Cleavage of structural proteins during the assembly of the head of bacteriophage T4. Nature. 1970;227:680–685. doi: 10.1038/227680a0. [DOI] [PubMed] [Google Scholar]
- 18.Towbin H, Staehelin T, Gordon J. Electrophoretic transfer of proteins from polyacrylamide gels to nitrocellulose sheets: procedure and some applications. Proc Natl Acad Sci U S A. 1979;76:4350–4354. doi: 10.1073/pnas.76.9.4350. [DOI] [PMC free article] [PubMed] [Google Scholar]
- 19.Suh HS, Cosenza-Nashat M, Choi N, Zhao ML, Li JF, Pollard JW, Jirtle RL, Goldstein H, Lee SC. Insulin-like growth factor 2 receptor is an IFNgamma-inducible microglial protein that facilitates intracellular HIV replication: implications for HIV-induced neurocognitive disorders. Am J Pathol. 2010;177:2446–2458. doi: 10.2353/ajpath.2010.100399. [DOI] [PMC free article] [PubMed] [Google Scholar]
- 20.Stromnes IM, Goverman JM. Active induction of experimental allergic encephalomyelitis. Nat Protoc. 2006;1:1810–1819. doi: 10.1038/nprot.2006.285. [DOI] [PubMed] [Google Scholar]
- 21.Endersby R, Zhu X, Hay N, Ellison DW, Baker SJ. Nonredundant functions for Akt isoforms in astrocyte growth and gliomagenesis in an orthotopic transplantation model. Cancer Res. 2011;71:4106–4116. doi: 10.1158/0008-5472.CAN-10-3597. [DOI] [PMC free article] [PubMed] [Google Scholar]
- 22.Davidson TS, Shevach EM. Polyclonal Treg cells modulate T effector cell trafficking. Eur J Immunol. 2011;41:2862–2870. doi: 10.1002/eji.201141503. [DOI] [PMC free article] [PubMed] [Google Scholar]
- 23.Wehrens EJ, Mijnheer G, Duurland CL, Klein M, Meerding J, van Loosdregt J, de Jager W, Sawitzki B, Coffer PJ, Vastert B, Prakken BJ, van Wijk F. Functional human regulatory T cells fail to control autoimmune inflammation due to PKB/c-akt hyperactivation in effector cells. Blood. 2011;118:3538–3548. doi: 10.1182/blood-2010-12-328187. [DOI] [PubMed] [Google Scholar]
- 24.Xie QW, Whisnant R, Nathan C. Promoter of the mouse gene encoding calcium-independent nitric oxide synthase confers inducibility by interferon gamma and bacterial lipopolysaccharide. J Exp Med. 1993;177:1779–1784. doi: 10.1084/jem.177.6.1779. [DOI] [PMC free article] [PubMed] [Google Scholar]
- 25.Misko TP, Trotter JL, Cross AH. Mediation of inflammation by encephalitogenic cells: interferon gamma induction of nitric oxide synthase and cyclooxygenase 2. J Neuroimmunol. 1995;61:195–204. doi: 10.1016/0165-5728(95)00091-f. [DOI] [PubMed] [Google Scholar]
- 26.Tada Y, Ho A, Matsuyama T, Mak TW. Reduced incidence and severity of antigen-induced autoimmune diseases in mice lacking interferon regulatory factor-1. J Exp Med. 1997;185:231–238. doi: 10.1084/jem.185.2.231. [DOI] [PMC free article] [PubMed] [Google Scholar]
- 27.Lin RF, Lin TS, Tilton RG, Cross AH. Nitric oxide localized to spinal cords of mice with experimental allergic encephalomyelitis: an electron paramagnetic resonance study. J Exp Med. 1993;178:643–648. doi: 10.1084/jem.178.2.643. [DOI] [PMC free article] [PubMed] [Google Scholar]
- 28.Galea E, Reis DJ, Feinstein DL. Cloning and expression of inducible nitric oxide synthase from rat astrocytes. J Neurosci Res. 1994;37:406–414. doi: 10.1002/jnr.490370313. [DOI] [PubMed] [Google Scholar]
- 29.Chew LJ, King WC, Kennedy A, Gallo V. Interferon-gamma inhibits cell cycle exit in differentiating oligodendrocyte progenitor cells. Glia. 2005;52:127–143. doi: 10.1002/glia.20232. [DOI] [PubMed] [Google Scholar]
- 30.Thakur AB, Landolfi NF. A potent neutralizing monoclonal antibody can discriminate amongst IFNgamma from various primates with greater specificity than can the human IFNgamma receptor complex. Mol Immunol. 1999;36:1107–1115. doi: 10.1016/s0161-5890(99)00096-6. [DOI] [PubMed] [Google Scholar]
- 31.Kang Z, Altuntas CZ, Gulen MF, Liu C, Giltiay N, Qin H, Liu L, Qian W, Ransohoff RM, Bergmann C, Stohlman S, Tuohy VK, Li X. Astrocyte-restricted ablation of interleukin-17-induced Act1-mediated signaling ameliorates autoimmune encephalomyelitis. Immunity. 2010;32:414–425. doi: 10.1016/j.immuni.2010.03.004. [DOI] [PMC free article] [PubMed] [Google Scholar]
- 32.Komiyama Y, Nakae S, Matsuki T, Nambu A, Ishigame H, Kakuta S, Sudo K, Iwakura Y. IL-17 plays an important role in the development of experimental autoimmune encephalomyelitis. J Immunol. 2006;177:566–573. doi: 10.4049/jimmunol.177.1.566. [DOI] [PubMed] [Google Scholar]
- 33.Arnett HA, Mason J, Marino M, Suzuki K, Matsushima GK, Ting JP. TNF alpha promotes proliferation of oligodendrocyte progenitors and remyelination. Nat Neurosci. 2001;4:1116–1122. doi: 10.1038/nn738. [DOI] [PubMed] [Google Scholar]
- 34.Shaw M, Cohen P, Alessi DR. The activation of protein kinase B by H2O2 or heat shock is mediated by phosphoinositide 3-kinase and not by mitogen-activated protein kinase-activated protein kinase-2. Biochem J. 1998;336(Pt 1):241–246. doi: 10.1042/bj3360241. [DOI] [PMC free article] [PubMed] [Google Scholar]
Associated Data
This section collects any data citations, data availability statements, or supplementary materials included in this article.